Massive hbar bullish divergence!Hedera is developing this beautiful bullish divergence since the 28th of december.
Bitcoin looks good too. Close to a bottom.
All the market is primed for a pump.
Ready or not bears will be obliterated!
Here for you, as always, Crypto Soap!
Hbar

Hbar/btc cup and handle!hbar need to get higher than 0.888, retest it and hold it.
After this move we can expect a test of the all time high of 0.1200.
Here for you, as always, CryptoSoaP!

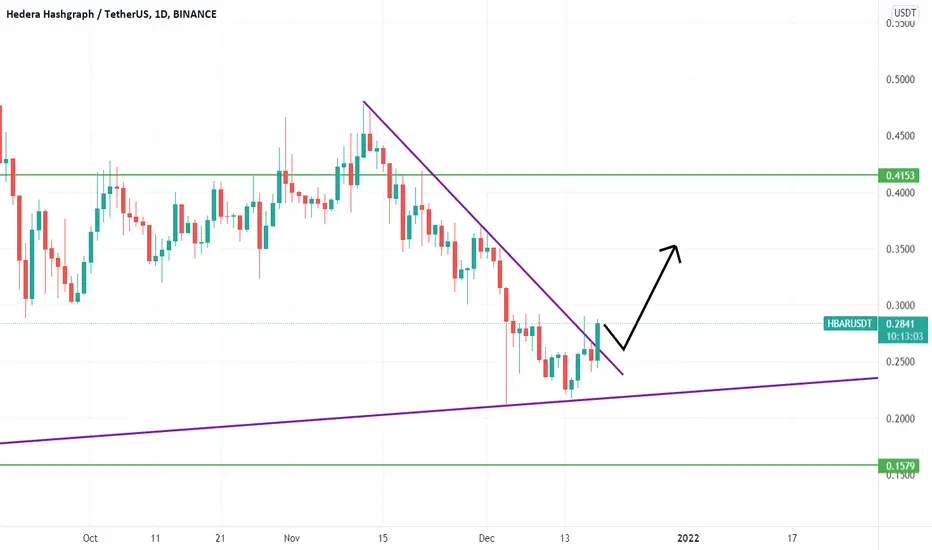
HBARUSDT-LONGBased on technical factors there is a long position in HBARUSDT Hedera
HBARUSDT Hedera
Score 2️⃣
🔵Long Now or set on Key Level 0.2828
🟢Target 1 0.3190
🟢Target 2 0.3495
❌Stop loss 0.2670
#K_Level
Every signal has a score from 1 to 5, so accordingly adjust your risk for each signal. The signals with the score of 5 are the most probable ones.
Please support our activity with your likes and comments.


Hbar (and the whole market) is ready to pump.We can notice a pretty bullish divergence on hbar 4 hour chart. Also the weekly stochastic is very low and ready to pump.
-1th time it was this low—>8x
-2th time it was this low—>12x
-3th time it was this low—>4x
-4th time it is this low—> 4x? 8x?12x?
The setting looks similar to the previous pumps and hbar has been building a good volume these days. Im pretty excited for whats coming and im very catious at the same time. I believe its time to hold more than ever right now and im maybe wrong but i will still hold!
We can also notice the price being between 0,018/0.060 during all 2020 and during all 2021 being between 0,15 and 0,60. We simply just added a 10x and consolidated higher. HOPE IT HELPS!
Here for you, as always, Crypto Soap!

HBARUSDT LONG OR SHORTIf the resistance and pullback fail, we can continue the upward trend, but if the trend of the short position weakens, it is more effective.

$HBAR, Aiming for ~750 sats from here in two potential paths$HBAR
Aiming for ~750 sats from here in two potential paths
UCTS turning bullish signals across multiple timeframes
#HBAR
👑Hedera (HBAR) Jan-04 #HBAR $HBAR
.
📈RED PLAN
♻️Condition : If 1-Day closes ABOVE 0.28$ zone
🔴Buy : 0.3 - 0.28
🔴Sell : 0.36 - 0.42 - 0.48
📉BLUE PLAN
♻️Condition : If 1-Day closes BELOW 0.28$ zone
🔵Sell : 0.28
🔵Buy : 0.24 - 0.2
❓Details
🚫Stoploss for Long : 10%
🚫Stoploss for Short : 5%
📈Red Arrow : Main Direction as RED PLAN
📉Blue Arrow : Back-Up Direction as BLUE PLAN
🟩Green zone : Support zone as BUY section
🟥Red zone : Resistance zone as SELL section

HBAR/USD could be one of the best performing coinsIn the short run, HBAR does look extremely bullish and could outperform most altcoins along with Bitcoin. We expect the price to hit 161.8% fibs, which corresponds to the previous resistance area.

$HBAR QUICK TA 4hr$HBAR nice move above .30 wait for it to retests support if HBAR holds above .30 will likely trend higher
bullish above .30 bearish below

HBAR is ascendingIf you've seen my past signal on HBAR you know already that the white lines are two strong R/S and I think they are still in play, however watching the weekly chart I think currently the chart is into an ascending channel. Off course ascending channels eventually break downwards but as I said.... eventually!
For reasons I don't know HBAR did a strong reversal (at the time of writing the daily candle is at +22%) but should it close over that white R that would make me very happy. As you can see until we hit the upper border of the channel there's a long +90% still do be achieved as we price jsut bounced on lower border, so it's the right time to enter.
Check the volume, it's currently over 11mil while yesterday was below 3mil, VLPR (not shown here) shows buys are distribuited and price is over the control's line and SMI show a bullish DIV. Moreover the project is very good and people keeps calling for coinbase to list this one which is totally possible, especially considering that coinbase has recently listed a ton of shitcoins so why should they snub a very good project?
I'd open a 20% position here and then set a 30-40% position around 0.27 USDT because this should retrace a bit after this run.
Good luck

Hedera broke longterm trendlineIt made a channel to break trendline and now reached resistance level near channel's top, so we should expect a downtrend to channel's bottom.

HBAR 4h/1h STRONG BULLISH DIVERGENCEHbar is looking good. Stochastic RSI is oversold. RSI is oversold and it show a good and strong bullish divergence.
Volume is coming in right not.
We’ll have an announcement in the first days of january. Some voices are saying it wil be walmart releasing the partnership with skux built on hedera (coupons).
We will never know but its sure that it will be a big one.
Here for you, as always, Crypto Soap!

HBAR START OF A NEW UPTREND!Forming higher lows and higher highs on the USD chart. There is also an S/R Flip on the BTC chart. Looks bullish

HBAR/USDT Chart If you follow, like and comment I would be grateful.
HBAR seems to be a really interesting investment right now. The coin just broke the 0.30$ resistance and is ready to a move towards 0.40$. The RSI on the daily and 4H chart is more bullish than bearish, considering the fact that BTC had a recent move to 51K and most alts are going up. I know that in this situations buying strenght is better than buying the coin that is going down, but coins like AVAX, LUNA, CRO and SOL already made their moves and will now suffer from a small correction before continuing their uptrend. The market looks good right now, and if I find any bearish signal on BTC that can cause a crash I will post an update . Merry Christmas and thanks!

HBAR underperforming BTC in long term but short-term buy signalHBAR has formed a short-term buy signals but it is underperforming against BTC in the long term.

Hbar 4h LongSetup: 4h 50 ma advancing upwards, we will wait for breakout above resistance and entry will only be at when macd crossover
Entry: Breakout and when macd crossover
SL at 1 ATR below recent lows at 0.30387
TP at 0.41655

HBAR growth from supportDespite the market decline, this is one of the few coins that is growing. Now the price is on the retest of the support level, from where further growth is possible


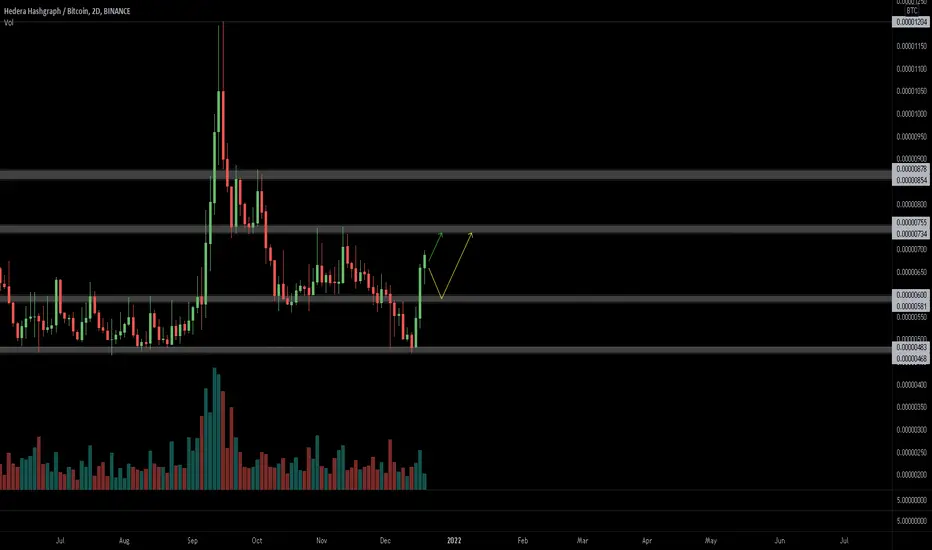
HBAR / BTC - Successful Re-test of Weekly BreakoutBack in early -> mid September, HBAR broke out and tapped 1200 sats and then quickly corrected back to re-test it's weekly break-out trend. Bitcoin and most alts are doing the same on HTF charts, most on weekly while TOTAL crypto MC appears to be doing the same on monthly.
HBAR is among some of the first to react at this area, appearing strong and unable to reach its trend, only wicking down to this level and then a strong reaction pushing back upwards.
There was also the potential for a double top on the LTF, which brought us down to 492, but with the reaction mentioned above we failed our double top and got back above 567. At this point, if we stay above 567, we should see 720. Get and stay above 720 and our failed double top on the LTF has us heading back towards our previous ATH (prior to 1200) @ around 864 (target on the chart is 874).
If we can manage to get above 864 again and hold, we're likely to revisit our highs and potentially break above them.
Meanwhile, look out for a possible re-test of the area around 567 if we turn down momentarily. Again, if we stay above 567, HBAR should see continue moving up, above 720 a much stronger move starts becoming possible.

HBARUSDT - Trend Breakout + Head & Shoulder PatternHBARUSDT (4h Chart) Technical analysis
HBARUSDT (4h Chart) Currently trading at $0.285
Buy level :Above $0.293 (Buy after Breakout)
Stop loss: Below $0.239
TP1: $0.321
TP2: $0.362
TP3: $0.410
TP4: $0.474
Max Leverage 2x
Always keep Stop loss
Follow Our Tradingview Account for More Technical Analysis Updates, | Like, Share and Comment Your thoughts.

Hedera Hashgraph (HBAR) able to flip daily MA Ribbon?Hedera Hashgraph (HBAR) able to flip daily MA Ribbon?
The bounce of the RSI support seems quite strong - what do you think? 😎
Drop me a nice comment if you'd like me to analyze any other cryptocurrency or do another comparison.
*no financial advice
do your own research before investing

hbar / usdt daily chart long ideahbar / usdt daily chart long idea
descending trend line is broken...you can enter long position after retest or correction