A long way for #Hellofuture (hbar)Hbar is the future. Its a new generation of blockchain, its a graph. This is something different and a lot of people cant understand it.. we'll have our pump, it will push higher, its about time.
Hbar

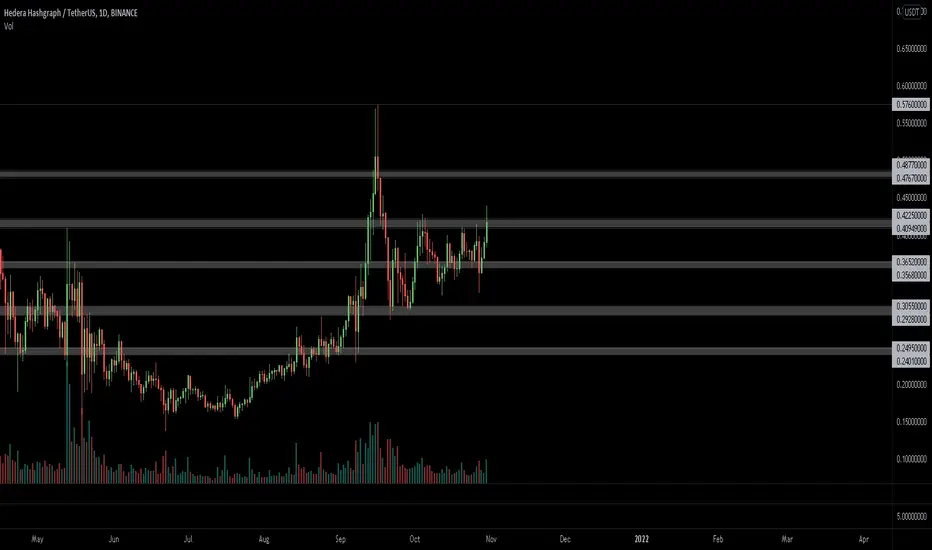
HBARUSDTI am still a beginner in trading and trying to analyze this coin. No questions on this coin's fundamentals strength. However, I think this coin is challenged on breaking the resistance at 0.4256-ish due to the low volume. It kept on bouncing between .3477 - 0.4000. I may add a small bag if there would be a volume expansion with price increase at >0.4300
not a financial advice.

Hedera Hashgraph's long term viewForming inverted head and shoulder formation known to be the bullish pattern on weekly timeframe. Fundamentally, #HBAR is a state of the art distributed ledger technology.

Hbar 400% plus profit potential End of the run target?Hello Traders,
I wanted to put together this analysis on Hbar Hedera Hashgraph for you as this is a great project with an amazing team and partnerships behind it. As Hbar is holding this support line which was prior resistance and has recently broken out of a Symmetrical Triangle to the bullish side it seems as if the price action wants to continue to head upward to the targets that I have laid out for you in this chart. In this analysis I have placed a target showing what I believe the price will hit at minimum by the end of this run. This is based off of a few factors. First being that Hbar has been running in an upward channel for as far back as we can see the price action going. As we are currently riding the support trend line that we are sitting right now, this area will need to hold for this analysis to play out well. I do believe it will yet, we will wait and see.
I have put some information together below on Hbar regarding the project fundamentals and where you might be able to invest in this asset.
As always, have a green week,
Savvy
----------------------------------------------------------------------------------------------------------------------------------------------------------------------------------------------------------------------------------------------------------------------------------------
Fundamental Analysis
HBAR Price Live Data
The live Hedera price today is $0.394607 USD with a 24-hour trading volume of $264,766,667 USD. We update our HBAR to USD price in real-time. Hedera is down 4.63% in the last 24 hours. The current CoinMarketCap ranking is #35, with a live market cap of $5,926,576,124 USD. It has a circulating supply of 15,018,941,582 HBAR coins and a max. supply of 50,000,000,000 HBAR coins.
If you would like to know where to buy Hedera, the top exchanges for trading in Hedera are currently Binance, Mandala Exchange, OKEx, FTX, and Huobi Global. You can find others listed on our crypto exchanges page.
What Is Hedera (HBAR)?
Hedera is the most used, sustainable, enterprise-grade public network for the decentralized economy that allows individuals and businesses to create powerful decentralized applications (DApps).
It is designed to be a fairer, more efficient system that eliminates some of the limitations that older blockchain-based platforms face — such as slow performance and instability.
It was funded through an initial coin offering (ICO) in August 2018 and first launched open access to its mainnet just over a year later in September 2019. As part of the ICO, investors were able to purchase the platform’s native utility token (HBAR) at the lowest possible pricing.
The HBAR token has a dual role within the Hedera public network.
First and foremost, HBAR the fuel that powers Hedera services, such as smart contracts, file storage and regular transactions. Second, it's used to help secure the network, since HBAR users can stake their tokens to assist with maintaining the integrity of the platform.
Who Are the Founders of Hedera Hashgraph?
Hedera Hashgraph has two founders: Dr. Leemon Baird and Mance Harmon.
Dr. Leemon Baird is credited as the investor of the hashgraph distributed consensus algorithm and currently works as Hedera's chief scientist.
Prior to founding Hedera Hashgraph, Baird accumulated more than a decade of experience in various computer science and security roles and previously worked as a senior research scientist at the Academy Center by Cyberspace Research. He also holds the position of co-founder and CTO at Swirlds Inc., a platform for building DApps.
On the other hand, Mance Harmon is Hedera’s CEO and an experienced technology executive and seasoned entrepreneur. Harmon has around two decades of experience holding executive roles at prominent firms — many of which are in the IT security industry. Like Dr. Leemon Baird, Mance Harmon also holds a second position at Swirlds Inc., as its co-founder and CEO.
In addition to the founders, the Hedera leadership team also comprises more than a dozen individuals, many of which have had distinguished careers.
What Makes Hedera Hashgraph Unique?
Unlike most other cryptocurrency platforms, Hedera Hashgraph isn’t built on top of a conventional blockchain. Instead, it introduces a completely novel type of distributed ledger technology known as a Hashgraph.
This technology allows it to improve upon many blockchain-based alternatives in several key areas, including speed, cost, and scalability. Hedera transactions have an average transaction fee of just $0.0001 USD and typically reach finality in under five seconds. Overall, Hedera Hashgraph claims it can handle more than 10,000 transactions per second (TPS) — compared to the around 5-20 for most popular proof-of-work (PoW)-based blockchains.
The platform offers several major network services. These include:
A token service that allows users to easily configure and mint both fungible and non-fungible tokens (NFTs) on Hedera with just a few lines of code.
A consensus service that acts as a layer of trust for any application or network that needs a secure, verifiable log of events.
Smart contract tools that let developers build powerful and efficient decentralized applications.
Decentralized file storage services with features include proof-of-deletion, controlled mutability, and time-based file expiry.
Related Pages:
Check out Ethereum (ETH) — the most popular blockchain for decentralized applications.
Check out Polkadot (DOT) — another massively scalable blockchain.
Learn about decentralized applications (DApps) with CoinMarketCap Alexandria.
Have you seen the CoinMarketCap blog?
How Many Hedera Hashgraph (HBAR) Coins Are There in Circulation?
The Hedera Hashgraph token, HBAR, has a maximum total supply of 50 billion units. Out of this, almost seven billion were in circulation as of January 2021 — equivalent to around 14% of the total supply.
Hedera publishes regular reports detailing when the next wave of HBAR tokens will be unlocked. These reports can be viewed here.
According to Hedera's resources, the two project founders each have a coin grant of two billion HBARs, equivalent to 4% of the total supply each. These tokens are vested over a six-year period.
Other senior executives at Hedera (that joined prior to 2018) have coin grants of between 250 million and 300 million coins. These tokens are vested over a period that ends in December 2021.
According to Hedera's Economics Whitepaper (published June 2020), around 17.03 billion HBAR is estimated to be in circulation by 2025 — equivalent to 34% of the total supply.
How Is the Hedera Hashgraph Network Secured?
Hedera Hashgraph uses a novel consensus system known as Hashgraph consensus to keep its network secure.
This uses a rotating governing council consisting of up to 39 highly diversified organizations that span across up to 11 different industries. These are involved with directing the Hedera codebase, voting on platform decisions and operating the initial nodes on the Hedera public network.
Hedera uses a novel form of proof-of-stake (PoS) which allows HBAR users to stake their resources to help protect the network. Right now, all Hedera nodes are managed by either Hedera itself or the governing council members, but there are plans to switch to a permissionless system in the future.
\ Overall, Hedera's security setup ensures it achieves "asynchronous” Byzantine fault tolerance (ABFT) — meaning it can guarantee both the timing and order of a set of transactions, even if some data is delayed or lost.
Where Can You Buy Hedera Hashgraph (HBAR)?
HBAR is a popular digital asset that is available to trade on several prominent exchange platforms, including Binance, Bittrex and Huobi Global.
Some of the more popular HBAR trading pairs include HBAR/USDT, HBAR/BTC and HBAR/ETH, and there are also several fiat trading options for the cryptocurrency, including HBAR/USD, HBAR/KRW and HBAR/INR.

HBAR/USDT TRADE SETUP! Hello everyone, if you like the idea, do not forget to support with a like and follow.
Welcome to this Altcoin setup of HBAR. HBAR looks very promising here. It already broke out from the channel and currently retesting it. Also, fundamentally it's very strong. They have some NFT related events in the month of November. So I'm buying some here and adding more in dips.
Entry range:- $0.38-$0.42
Target1:- $0.448
Target2:- $0.484
Target3:- $0.542
Target4:- $0.6
SL:- $0.3682
Buy it on spot and hold it or if you want you can buy it with low leverage 3x-5x with tight SL.
If you like this idea the do appreciate it with like and follow.
Also, share your views in the comment section.
This isn't financial advice. DYOR before investing.
Thank You!

$HBAR, Trying to go for a break above ~.4$ $HBAR
Trying to go for a break above ~.4$ (highest level since September)
UCTS signalling the 1D Buy signal..
Looking for a flip at current breakout retest on the 12H as signal of continuation
#HBAR
HBARUSDT Technical Analysis⏳ Spot
💎 HBARUSDT has been below a very strong resistance, after the breakout and also breaking above the symmetrical triangle it has had a successful retest, I expect that it continue to go higher.
🌐 Tradingview
🏁 Short & Medium Term
💵 Invest Only 5% of your Portfolio
🎳 Entry at Market or at 0.3850 - 0.4040
☕️ TP1 0.4400
🍺 TP2 0.5100
🍻 TP3 0.5940
🍾 TP4 0.7000
🍷 TP5
🍸 TP6
🍹 TP7
🎁 TP8
🚫 SL 0.3600
Good Luck 🎲
Check the Links in Description and If you LIKE this analysis, Please support our page and Ideas by hitting the LIKE 👍 button. ❤️ Your Support is really appreciated! ❤️
Traders, if you have your own opinion about it, please write your own in the comment box. We will be glad for this.
Feel free to request any pair/instrument analysis or ask any questions in the comment section below.
We will have more FREE forecasts in TradingView soon
Have a profitable day 😊👍🏻

HBAR: If we clear this $0.40/0.45 area it’s full send mode.This area is particularly important, as there are two different resistances. There’s the midrange resistance from the highlighted parallel channel, and there’s a general resistance around the $0.4/0.45 mark as we can see that the price struggles to break this barrier (multiple touches of this zone in the past).
If HBAR manages to break on the upside, chances are we could see a new ATH.
Good luck!

HBAR breakout of bullish falling wedgeHBAR/BTC
1D/12H
Its good to check both pairs when trading alts to see if there’s confluence in both pairs and the BTC pair looks as bullish as the USDT.
Price had been accumulating 7 months between March and September and broke out and corrected, formed a bullish falling wedge and has broke out taking liquidity before retested the daily demand zone collecting any remaining orders before starting an impulse move with higher volume.
MACD showing crossover with volume gaining on histogram on both timeframes. 12H just starting to cross over the centreline giving a bullish signal.
Fib projections on the chart, expected to head into the 1.272 and the 1.618

HBAR BreakoutHBAR/USDT
1D/12HH
Broken out of the symmetrical triangle with supporting volume and broke though 0.5 fib on 12H, looks good for a continuation of bullish momentum.
Price corrected and collected liquidity and orders from daily supply zone before taking out the highs and breaking out.
Fib projection into the 1.272 and 1.618, could see this heading to $1. In an expanding channel in the lower range with a bullish formation breakout, getting squeezed on the MACD with the histogram showing first bullish candle and crossover. I’d expect price to head towards the upper structure of the channel into the fib zones

Hedera HasgraphHbar breakout a symmetrical triangle. I like the big volume. It might be wise to wait for the retest support line but I don’t know if that will happen. I already jumped into a trade.

HBAR breaking outHBAR broke out as I predicted (on my twitter... sorry if I forgot to post it here) and it's testing that important resistance (white line). Judging by candles it will probably get rejected and try again. If it does get rejected I'd suggest to buy some between 0.36-0.38 in case you don't have any.
If instead the volume increases during the retracement wait a bit (for some updates on my signal).
Sorry for the short explanation, I'm very tired.

HBAR/USD - Preparing the fireworks... can it breakout? 😎HBAR looks very juicy, particularly on the BTC pair. On the USD pair here, you can see that price is compressing in the blue apex.
Soon we should get some fireworks. Bias is we will pump as the whole market is bullish right now.
Bias is somewhat bullish and has good potential. First we got to break the resistance, then we will fly.
As such, keep your eyes on this as it may get spicy soon.
Like and follow if you liked my idea!

$HBAR UPDATEHBAR bounced from the strong historic support trend-line and breakout
We can expect a new ATH from it within a short period of time.
Currently grabbing a small bag of this one!
----------------------
Best Regards, iSmashProfit™

HBAR analysisHBAR broke down from a bearish rising wedge target is 30 cents, but I think we will retest the bigf support line.
good luck!

HBARUSDT , Are you ready to buy with x12 R/r ??? :D :D Abtin00Hello everyone
In this chart , at first we should say we have amazing coin with powerful fundamental and in technical view we need to wait for a little correction then we can take in position buy we can buy at these price , the first target is nice but the second one is amazing with x12 ( amaze R/r ) , dont forget use stop loss and attention to money management
Please manage your PORTFOLIO and then buy new coin , if you cant manage it send messages to us , and our team do this for you
Be with us and sleep comfortably
Good Luck
Abtin

HBAR/USDT$HBAR is forming an Ascending Trinagle, with major resistance on the upwards.
If we break trough the red box we can see new all time high for $HBAR.

Looking for some feedback about HbarHbar has reached a new Ath just some days ago, thats's why we can see so much volatilitty on its price action. For the last moth it has been lateralizing and I was wondering if anyone else thinks something like this could play out. In the technical indicators we can see that st's accumulating without any divergence wgat makes me think of institutional money in little boughts. Personally i also like Hbar fundamentals so it's a crypto that i'm holding for the long term but i would love to read what you all think about it. We will discover if this triangle plays out as expected no more than 1 - 2 weeks but i would love to be in the move as the last big Hbar breakout was huge. My target would be at least reaching the last max.

3rd times the charm? #HBAR $HBARWe have been making higher highs and higher lows for some time now. We have broken out of the wedge but we must also break out of the ascending wedge on the 4h (must move past the 3rd flag). If we break the ascending channel and back test successfully, I will be buying in more. If we reject, I have a buy order at .36c - .37c as we land on the support at the bottom of the ascending channel. Good luck.

$hbar breaking out of triangle to the upsideGood fundamentals, good technicals, cbdc's., it all looks good from a short and long perspective

🔥 HBAR Huge Break Out Incoming?HBAR has been grinding up for almost three months now. During this period, we've only seen a spectacular move during the early days of September. Since then, the price has practically traded sideways, but making higher lows in the process.
The $0.40 area seems to be holding as a strong resistance. However, I'm expecting this resistance to (finally) break in the coming days. Once this area is broken, a lot of investors will be pouring in due to HBAR finally making a new local high.
Target area for the break out is placed around the current all time high: between $0.50 and $0.57.
Happy trading!

HBAR - Symmetrical triangleHBAR/USDT
1D/12H
HBAR forming a contracting symmetrical triangle on the daily chart making a series of higher lows under daily supply with volume picking up.
We pulled into the 0.5 fib from the initial move upwards into the high $0.57 showing a nice correction and sustained intact uptrend.
Expecting a breakout to the upside, reclaim the golden fib we have rejected and push past daily supply in the coming days/weeks. Could see price make its way to the 1.272 fib and into the 1.618 if the uptrend is sustained alongside the momentum of the market currently.
MACD on the daily looks bullish with the MAs above the centreline where its remained throughout the correction, (when in the bottom half of the centreline its in negative and not a buy signal, momentum is with the bears in that case). MACD histogram also showing strong divergences and. Bullish crossover just occurred with green bars starting to appear as buyers take over.
Fundamentals on this one are great, check it out as its a serious alt coin to be holding within your portfolio.

HBAR 4H Symmetrical Triangle break outHBAR Symmetrical Triangle break out with volume POC just under the descending trend forming a very nice base for a long.
Expecting a 51% measured move from the ST with good R:R stop just below the POC.
