BTC / USD market top predictionI think the market will play out like this in Q4 untill the end of January 2022 with a market top at around $ 85.000.
Hbar

Lets seach some crypto 3!!Flag at 40% projection, high volume, safe buy trigger at 0.433, risky trigger at 0.397 in 4h time for few days.
Tec. Explanation: flags when top line breaks usualy double his size.
Strategy: Stoploss at 0.358 sell point at 0.5 and 0.55


very critical level for HBAR to skyrocket If it passes 0.40 resistence level ıt will go up shortly to 0,5
it tested 3 times before. right now MACD and RSI both signal upwards
NOT FINANCIAL ADVISE

Hedera Hashgraph is an UNDERVALUED COINThis will be a will be a TOP 10 MC project at some point in the future. 4$ soon if history repeats
THE UNBREAKABLE 0.40$0.4 is very strong resistance we can not break it, if we do it will go up to 0.55$
Lets Wait and see


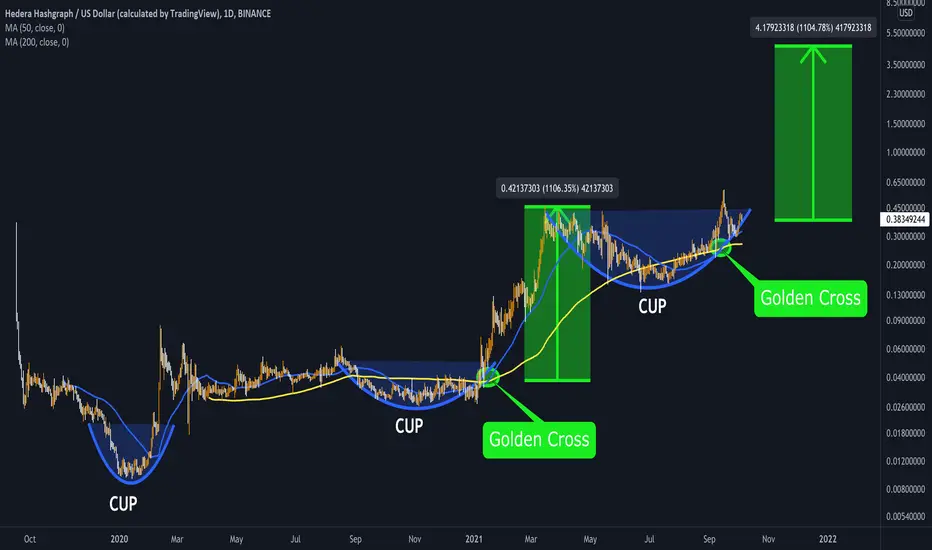
HBAR to $1?Massive cup and handle on HBAR.
I saw potential here at the bottom of the handle.
Levels to watch:
0.35 (confirmed as support already)
0.4 (currently working on breaking this resistance)
0.46 to 0.47 (golden pocket)
0.56 (Top of cup and handle, Expect lots of movement when it breaks this level)
0.75 (1.618 FIB level)
$1 (Top of cup and handle potential and also 2.618 FIB level)
BINANCE:HBARUSDT

🔥 HBAR Targets Reached: Break Out Soon?Two days ago I made an analysis on HBAR. In this analysis I argued that HBAR had likely found its local bottom at the support area and was prone to bounce.
Only two days later, HBAR smashed through both resistance targets and saw a nice 30% increase in value.
As for now, it appears that HBAR has found short term resistance at $0.39. I'm expecting this resistance to get taken out in the near future. Expect a break out through the resistance area soon.
Next target: $0.44
Happy trading!

🔥 HBAR Found Support: Potential Bounce IncomingOver the course of a month or so, HBAR seems to have found support in the area indicated on the chart.
Assuming that we're going to see a more bullish October, there's a decent chance that this area will be functioning as a major support throughout the month. Furthermore, keep an eye on the upward sloping trend line.
Two targets in this scenario. First target at $0.36, second at $0.39.
Happy trading!

HBAR / BTC - Double Bottom Continued: Min Target @ 1444 SatsI believe Hedera Hashgraph is going to be the next crypto with a sustained uptrend against BTC, similar to what Chainlink did last year, and similar to what Litecoin did back in 2014-2017.
To get there, we need to break our neckline @ approx 780 sats, and our previous ATH of 864 sats. Once we break the neckline, the next target would be the top of the line chart from the day we opened trading for this pair, and then 1444 sats becomes our MINIMUM target once we've confirmed the double bottom that has been proposed since last year.
Expect potential breaks above each of these areas, and then re-tests, or - on the other hand, stops at those same areas, and multiple tests to break above them. If we get to our min target @ 1444, I expect we'll go significantly higher, potentially into the 2400s and then 3000s.
If we fail to confirm our double bottom at any point and head down, a triple bottom may come into play, although I currently think this is unlikely.
Also on the chart, a snippet of a more detailed plan for what sort of pattern we might see with the HBAR / BTC pair (bottom right corner and linked below as "Repeating Pattern Idea") leading up to breaking the neckline for our double bottom.
See related ideas below:
*** for USD and BTC pairings ***
*** comparisons vs Chainlink and Litecoin as mentioned above ***
*** some early double bottom predictions from when we were at or near bottom ***
TradingView recently made it much easier to add images to charts, which is what motivated me to publish this one. Thanks TradingView!

Bitcoin [ BTC ] - Final Prediction... Possibly $150,000+ From the summer, I've been tracking Bitcoin and you can check back on all of my Bitcoin charts. I've been doing pretty well tracking and forecasting it's next movements.
This prediction of $150,000+ comes from many fundamentals and looking over the cycles from previous years. Bitcoin is being adopted in several countries as legal tender now . Being adopted by big corporations more than ever.
I believe Bitcoin was dumped in May, so that the WHALES could accumulate as much BTC as possible at a cheaper price. The accumulation is final now and they are all just HODLing until the next pump. I do not believe they plan to sell. People are seeking to buy BTC more than ever right now. Any Whales who sell will just lose their wallet positioning of BTC. Plenty of other whales ready to scoop it up immediately if this happens and no way are they going to let that happen. I don't there there will be a dump after the dump we already had.
BTC may or may not take off soon. In fact, it could drag out for weeks until it takes off. It's probably not a terrible idea to accumulate ALTS at this new $$40,000 floor if that happens. I believe it'll hold strong above $40,000, similar to how strong it held above @ $29,000 this summer. It's only going up from here.
I do think it's going to created a new ATH, then there will likely be a correction before it goes parabolic. When that happens, I'm seeing $150,000+ as a likely target. Could go more, depending on the strength of the pump when it goes parabolic. Just my take, after considering the whole situation and assessing BTC's chart activity over the past couple of months....


hbar can run uphbar have a long opportunitty
we broke the first trend line and we are on the way of breaking secound one
we have EMA 50 and EMA 200 in the way
if we pass the above we can have long by the entry 0.3473 to the next huge ressisstance at 1943

HBAR TRENDHbar trend analysis
HBAR is the native, energy-efficient cryptocurrency of the Hedera public network. Hbars are used to power decentralized applications and protect the network from malicious actors. Developers use hbars to pay for network services, such as transferring hbars, managing fungible and non-fungible tokens, and logging data.

HBARUSDTHello Crypto Lovers,
Mars Signals team wishes you high profits.
We are in a 4-hour time frame.
As you see, the price has formed head and shoulder pattern. We believe that the price would continue to drop so we drew expected support lines.
But if the price can break our resistance line upwards, becomes strong and stable, and we can consider the climb.
Warning: This is just a suggestion and we do not guarantee profits. We advise you analyze the chart before opening any position.
Wish you luck

50%+ for HBAR if price break up in next daysYOUR LIKE OR COMMENT IS MY FUEL FOR NEXT ANALYSIS :) IF U HAVE ANY QUESTION REACH ME HERE
This is not a financial advice. Always do your own research and always put stoploss in your trade (SL) :) If you want more detailed info how to study and read charts or just need help with some coin, just write to me here a comment, i will try to answer to everybody... i can help you :) all for free, don't worry, BE HAPPY!

hbar cup and handle - target +22% in next 24 hoursIf things go to plan, having recovered clearly from a massive head and shoulders pattern...

HBARUSDT Short Term Setup!HBARUSDT (30M Chart) Technical analysis
HBAR/USDT (30M Chart) Currently trading at $0.3484
head and Shoulder Pattern
Long Entry: above $0.3434
Stop loss : $0.3184
Target 1 : $0.358
Target 2 : $0.373
Target 3 : $0.390
Max leverage : 3x
Always keep stop loss

HBARUSDT Head and Shoulder PatternHBARUSDT (1h Chart) Technical analysis
HBAR/USDT(1h Chart) Currently trading at $0.346
Buy level : Above $0.343
Stop loss: Below $0.318
TP1: $0.364
TP2: $0.381
TP3: $0.396
TP4: $0.411
Max Leverage 3x
Always keep Stop loss
Follow Our Tradingview Account for More Technical Analysis Updates, | Like, Share and Comment Your thoughts.

HBAR - if you are bearish when you see this - you're dumb.HBAR will fly, technically, fundamentally, and because I had invested. :D

HBAR/USDT Scalping trade#HBAR/USDT Scalping Update:-
Entry 1:- $0.3327
Entry 2:- $0.314
Targets:- $0.3528/$0.3720/$0.40/$0.422
Stop Loss:- $0.286
