Hbar

HBAR has 20% short potentialHEDERA HASHGRAPH looks interesting today! If we successfully break the channel and confirm above 0.36, we might have another 20% increase in short time. If not, we will hit the weekly support again.

HBAR LongHello there ;
HBAR managed to hold above the moving averages on both the 4-hour charts and the daily charts. In the journal, we received a recovery from a previously tested region for the RSI. I think an Uptrend trial will come.
Merhaba ;
HBAR hareketli ortalamaların üzerinde tutunmayı hem 4 saatlik grafiklerde hem günlük grafiklerde başardı. Günlükte RSI için daha önce test edilmiş bir bölgeden toparlama aldık Bir Yükseliş denemesi geleceğini düşünüyorum .

Hedera Hashgraph - What's next for HBAR?If you haven't been living under a rock this bull run, you'd know that HBAR has been one of the most talked-about coins since its initial move up at the start of 2020. Currently, we stand at a crossroad. After rocketing 400% higher than the previous all-time high there are fears that HBAR might be running out of steam.
Bullish:
- Coin has been ranked number one on social blade multiple times in the past months and in the top ten literally dozens of times.
- Near perfect fundamentals: UK hospitals have been using HBAR to track the coronavirus vaccine, holocaust museums have been using HBAR to store survivor testimonies in the blockchain and they are rumoured to be working on the first "digital dollar" with centralised banks and the government.
- Amazing ability to gather public attention.
- Promising future fundamentals as COVID-19 will likely be around for at the very least a year or more to come and many government officials have admitted to be looking into working on a digital dollar that HBAR seems to be working on.
- Managed to avoid a double top drop, showing that the current 0.3 support is very strong and that investors are likely looking to hold HBAR for the long term. Usually, after a double top, we see a wave of panic selling that drops an asset down to previous support.
- The bull market.
Bearish:
- Volume is falling off in comparison to earlier this year, perhaps people are diversifying into coins that are yet to "moon" like HBAR has.
- Falling on the social blade. HBAR has gone from being mentioned in the top ten almost daily to hovering around the top 25. Perhaps this is because as altcoins start to pump left and right people are looking for more promising shorter-term investments.
- Double top (explained above)
- Potential triple top seems to be approaching as HBAR once again bounces off of the 0.3 support, if it does not break through on this attempt, with the dropping volume and weak RSI we will almost certainly see a drop to a previous support level.
HBAR could either somehow gain the volume (potentially via a new announcement) to push through the resistance and conduct a successful R/S flip (red arrows). Or we could see a triple top as HBAR fails to break through, after this investors would most likely lose some faith in the short term and we would see a sell off to previous support (orange arrows). Personally, I slightly favour the bearish scenario, however, it is impossible to be decisive, I would recommend not buying until we see a confirmation of a R/S flip above this resistance and not selling until we see a break below the support.
Buy big sell BIGGER - Megawhale

hbarSince the rectangle confirms the trend and the trend is bullish, we expect that with the price climbing to the ceiling of the rectangle, the collision of five shapes and the rectangle petren is complete. But I have no idea whether there will be a defeat. For now, the first target is the rectangular roof, and in case of failure the second target could be 590.
Warning: This is a technical analysis and I will leave the fundamental analysis to you.

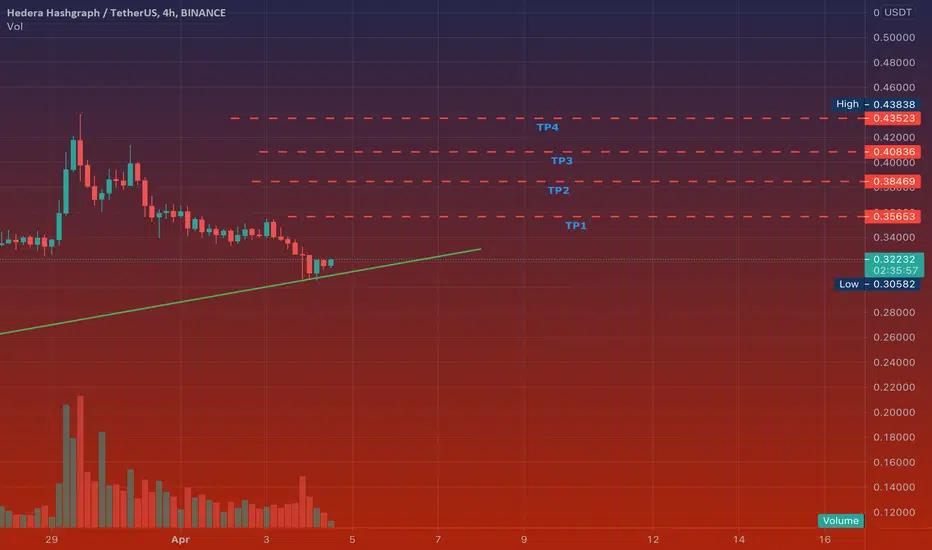
HBAR/USDT 20% up and still 50% potential from here#HBAR/USDT Profit Update:-
$HBAR currently trading at $0.345
And went down to $0.281
20% up from bottom retest level.
Without leverage.
I hope strong hand still holding.
Targets still same.
Support:- $0.280
Resistance:- $0.34/$0.44/$0.50/$0.6
Please click LIKE button and Appreciate my hard work.
Must follow me for latest crypto real time updates.
Thank you.

HBAR Bullish Price ActionHedera Hashgraph (HBAR) has been consolidating in a bull flag within a larger trend structure (parallel channel).
It is nearing the lower band of this channel and appears ready for another leg up.
The Stochastic RSI is oversold and has just crossed bullish, and the double exponential MACD is flashing a buy signal.
Given that the falg extends outside of the trend structure, I expect HBAR to break out of consolidation on its next test of the upper flag resistance.
If it repeats the same rally it did in March, we could see $1 before a significant correction occurs.


HBAR is about to breakoutLong wait but it's well worth it! minimum to 0.42 then continuations towards the 0.70

HBAR: New pattern after pullbackAfter pullback in 1W timeframe, it makes a symmetrical triangle pattern. If breaks from upside, it has good growth!
Also this crypto has a good fundamental.
Look after it to see what will be happened.

HBARUSDTHBARUSDT ready for a in support zone watch for breakout if upwords then price will reach 0.4+
Happy Trading :)

HBAR - pump loading- ABC corrective ended on 78.6%
- Buying now for 1.272 and 1.618 Extensions
- SL below lows


Buy the HBAR breakout. Hedera Hashgraph currently in a descending wedge pattern against both USDT and BTC. Once MACD crosses and there is a close above the $0.33 level, I will be longing HBARUSDT to the $0.52 target.

HBAR price prediction and guide. Guidelines for where I see hbar moving through.
Fibonacci drawn in.
Also support levels shown for safety.
Should trap within any triangle.

HBAR a project for which the world's giants stand. 🚀We have been studying this HBAR for a long time, the foundations of this coin are impressive. The world's giants are behind it - google , boieng, lg and many many more. So if this project is from top100 and it has one of the best foundations and strong support from the richest companies, what could go wrong? :)
Our subscribers are happy that they know about HBAR from many weeks and now they are on +100% profit (in btc ). 🚀
We also have huge bag of this coin and we are still strongly bullish .
🚀 This coin is on our golden long-term altcoins list. It may be very good project for long term investment.
❎ No TP for long-term investments. We can`t predict exact altcoins targets in long term, but thanks to our experience and glassnode we are able to predict exact bitcoin targets. Our long-term strategy is just to hold these altcoins until glassnode indicators will say us that we are close to end of bullrun. And then we will sell everything in 15% parts.
✅ Bullrun is easy. Just accumulate coins from our golden list (long) and play with our signals (short). Diversification is the key to success.

HBAR a project for which the world's giants stand. 🚀We have been studying this HBAR for a long time, the foundations of this coin are impressive. The world's giants are behind it - google, boieng, lg and many many more. So if this project is from top100 and it has one of the best foundations and strong support from the richest companies, what could go wrong? :)
Our subscribers are happy that they know about HBAR from many weeks and now they are on +100% profit (in btc). 🚀
We also have huge bag of this coin and we are still strongly bullish.
🚀 This coin is on our golden long-term altcoins list. It may be very good project for long term investment.
❎ No TP for long-term investments. We can`t predict exact altcoins targets in long term, but thanks to our experience and glassnode we are able to predict exact bitcoin targets. Our long-term strategy is just to hold these altcoins until glassnode indicators will say us that we are close to end of bullrun. And then we will sell everything in 15% parts.
✅ Bullrun is easy. Just accumulate coins from our golden list (long) and play with our signals (short). Diversification is the key to success.

HBAR/BTC TA update and 100% potential from here#HBAR/BTC TA Update:-
#HBAR currently trading at 566 Satoshi
And strong support at 540 Satoshi
Entry:- 540-565 Satoshi
Targets:- 721/1153 Satoshi
Stop Loss:- If 4H candle below 520 Sat
Support:- 540 Satoshi
Resistance:- 721 Satoshi
Please click LIKE button and Appreciate my hard work.
Must follow me for latest crypto real time updates.
Thank you.

HBARUSDTHello to you all. Mars Signals team wishes you high profits at all times. It has experienced a bearish price and is now facing strong support. If it can maintain its support, it is more likely to start moving upwards, but if it moves downwards, it is more likely to fall.
Warning: This is just a suggestion to you and we do not guarantee profits.
Wish you luck!
HBARUSDT (HEDERA HASHGRAPH) - POTENTIAL BREAKOUT ANALYSIS 🔎
- HBARUSDT is printing a falling wedge (FW) pattern.
- A falling wedge pattern is a reversal pattern.
- A bullish pattern to be precise.
- RSI is printing a bullish divergence signal (BDS).
- There's a breakout potential.
BUY ENTRY ⬆️
- Breakout above the falling wedge's resistance.
TARGETS 🎯
- Horizontal resistance level (R1).
- Horizontal resistance level (R2).
- Horizontal resistance level (R3).
SETUP INVALIDATION ❌
- Breakdown below the falling wedge's support.

100%+ gain breakout?Using the fibonacci breakout on the daily, spotting a big ascending triangle, this could be another big gain the coming month!
Edit: don't mind the emoticons. My way to mark my profits and losses
