HBARBTC

HBAR is about to breakoutLong wait but it's well worth it! minimum to 0.42 then continuations towards the 0.70

Buy the HBAR breakout. Hedera Hashgraph currently in a descending wedge pattern against both USDT and BTC. Once MACD crosses and there is a close above the $0.33 level, I will be longing HBARUSDT to the $0.52 target.

HBAR a project for which the world's giants stand. 🚀We have been studying this HBAR for a long time, the foundations of this coin are impressive. The world's giants are behind it - google , boieng, lg and many many more. So if this project is from top100 and it has one of the best foundations and strong support from the richest companies, what could go wrong? :)
Our subscribers are happy that they know about HBAR from many weeks and now they are on +100% profit (in btc ). 🚀
We also have huge bag of this coin and we are still strongly bullish .
🚀 This coin is on our golden long-term altcoins list. It may be very good project for long term investment.
❎ No TP for long-term investments. We can`t predict exact altcoins targets in long term, but thanks to our experience and glassnode we are able to predict exact bitcoin targets. Our long-term strategy is just to hold these altcoins until glassnode indicators will say us that we are close to end of bullrun. And then we will sell everything in 15% parts.
✅ Bullrun is easy. Just accumulate coins from our golden list (long) and play with our signals (short). Diversification is the key to success.

HBAR a project for which the world's giants stand. 🚀We have been studying this HBAR for a long time, the foundations of this coin are impressive. The world's giants are behind it - google, boieng, lg and many many more. So if this project is from top100 and it has one of the best foundations and strong support from the richest companies, what could go wrong? :)
Our subscribers are happy that they know about HBAR from many weeks and now they are on +100% profit (in btc). 🚀
We also have huge bag of this coin and we are still strongly bullish.
🚀 This coin is on our golden long-term altcoins list. It may be very good project for long term investment.
❎ No TP for long-term investments. We can`t predict exact altcoins targets in long term, but thanks to our experience and glassnode we are able to predict exact bitcoin targets. Our long-term strategy is just to hold these altcoins until glassnode indicators will say us that we are close to end of bullrun. And then we will sell everything in 15% parts.
✅ Bullrun is easy. Just accumulate coins from our golden list (long) and play with our signals (short). Diversification is the key to success.

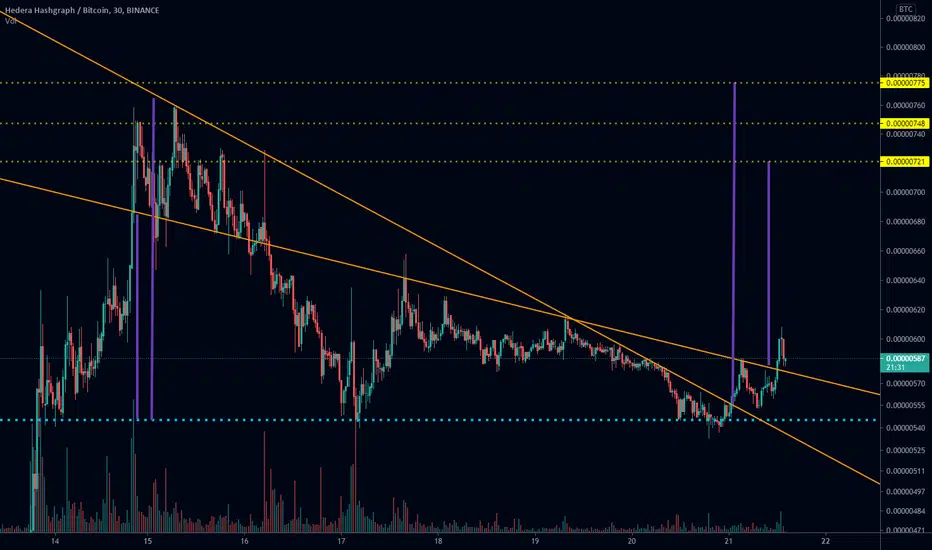
HBAR/BTC TA update and 100% potential from here#HBAR/BTC TA Update:-
#HBAR currently trading at 566 Satoshi
And strong support at 540 Satoshi
Entry:- 540-565 Satoshi
Targets:- 721/1153 Satoshi
Stop Loss:- If 4H candle below 520 Sat
Support:- 540 Satoshi
Resistance:- 721 Satoshi
Please click LIKE button and Appreciate my hard work.
Must follow me for latest crypto real time updates.
Thank you.


HBAR/USDT Technical looking good for scalping#HBAR/USDT TA Update:-
$HBAR currently trading at $0.3470
And very good strong support level.
I am buying some at here.
Entry:- $0.3380-$0.348
Targets:- $0.398/$0.436/$0.5/$0.6
Stop Loss:- if any 4H candle close below $0.33
Please click LIKE button and Appreciate my hard work.
Must follow me for latest crypto real time updates.
Thank you.


HBAR / BTC - Breakout / Re-testing - Short-term gainsQuick chart for HBAR / BTC 30min time-frame:
-- Good chance to visit 721, may see slightly higher high ~775.
Two possibilities after that:
1.) touch previous all-time high around 817-867, or
2.) a double top here and a significant pullback into the low 400s.
At the moment, double top seems possible because prior to breaking out we were forming a wedge testing 530s, although larger timeframes indicate a new ATH is coming before we see any good pullback, and then continued new highs beyond that. See LINK comparison below.
Also, USD pairing formed a W on the 30min chart, broke-out, and is currently re-testing the top:
Beginning of HBAR vs LINK (BTC pairings)HBAR and LINK are behaving very similarly during the first year and a half of their respective launches, I expect this to continue in some similar fashion with HBAR.
The ratio of movement is a bit more exaggerated with HBAR than LINK did vs BTC, but the patterns share similarities.
Here's what it might look like should this similarity continue.
Previously I had an idea that HBAR was following 2017-18 LTC (versus USD pair), that has also continued to play out rather similarly. Check out the LTC ideas below:
Updated LTC comparison:
Original LTC comparison:
Please share your thoughts, comments and ideas, and thank you so much for listening! Best of luck with your charting and trading! :)


Hedera Hashgraph quick analysisHBAR just broke out of the upper trendline and is approaching the resistance zone. Can be nice opportunity to enter at the break of current resistance, best TP levels are at 0.4$ and 0.45$, however I'd wait for the break of ATH. Most reasonable SL levels are located below current bottom trendline and below the resistance when broken. Potential bearish scenario is a dip to the support at 0.27$.
Happy trading!
(Not a financial advice)

$HBAR, Crossing over ~570 sats and hodling/trying to flip it$HBAR
Crossing over ~570 sats and hodling/trying to flip it into support on the way up
Looking good as volume is showing strong volumes on daily basis.
If manages to bounce, then looking for ~700/850 sats (ATH)
UCTS Bullish across the board (70%+ since 3D Buy signal)
#HBAR

Hedera Hashgraph long opportunity 31/01/2021as we can see the pair has spiked from the accumulation zone so we can be very much positive about its bullish wave
the easiest way to predict a TP is to use Fibonacci projection 127%

Rhymes and Rhythms. What's your strength? HBAR:BTC As a Trader it's important to know your strengths... & your weaknesses. When you're self-aware you have no more excuses. It's not the markets fault, it's yours. Own it. And work on getting better tomorrow than you were today.
My trading personality is:
A "Patient Gem Fossicking, Value Investing, Swing Trader, with a specialization in capitulation."
Identifying the following strengths and weaknesses is how I came to understand what my trading personality is. What's yours?
My strengths:
I trade better looking at 'the bigger picture' (1 day bars plus)
My best trades come during capitulation (for entry's and exits on long term swing trades)
Ability to get big in my best setups (having confidence in my analysis allows me to comfortably get in with size)
I have excellent visual 'pattern recognition' (allows me to identify patterns that others often miss)
I am extreemly patient (can sit in front of the screen, analyze the carts and not take a single trade for months)
My weaknesses:
Short time frame scalping (Too much information to process & patterns are less reliable)
Holding trades that go against me because "I really like the project" (next minute f**k it... guess I'm an investor now)
Incorrect position sizing (Incorrect risk in some shitcoin trades)
Not entering and exiting trades correctly (Often 'all in' & 'all out' in one go)
Trading setups that aren't my best
The reason for sharing some of my strengths and weaknesses is to get you thinking about what yours are. A good way to identify them is to create a 'playbook' of your setups. Record your trades in a journal as they happen. Review your winners and losers daily. Analyze yourself. What did you do well and what could you improve on? Once you know what your best & worst setups are, you can work on reducing your least profitable trades and start taking more of your most profitable trades. Journaling will also help you identify any good and bad habits you may have. When you have a good idea of where your best trades are, the next step is to learn how to get bigger in these 'best setups'. If you're interested in learning more about this process I highly recommend reading "The Playbook" by Mike Bellafiore. If you're struggling as a trader, the answers to most of your problems are in that book. Good luck!
Oh and as for this HBAR:BTC chart.. They say history never repeats, But it defiantly seems to rhyme. One of my strengths is 'pattern recognition' and it looks to me like a moonshot is incoming for HBAR... Just saying.
Can this pattern fail? Absolutely. Am I in this trade? Definitely.
Never Trust. Verify.
D.Y.O.R. Not Financial Advice Just an Observation.
Technical Analysis is not about being right, it's about increasing your odds.
Be prepared to be wrong. Risk management is key . Capital preservation above all else.

HBAR is about to breakout again and run strongYou want to be in this coin, you should already have been! Buy at 24 cents if you're able to but even buying the top here is worth it.
See the bull flag?
Here's a zoom in.
Such a bullish chart, here is the daily. Notice al that accumulation?
Notice how it burst out of the pitchfork already?


HBAR 150% rally on the verge of wipe off
Hedera Hashgraph engages reverse gears on failing to rise above the all-time high of $0.2821.
HBAR is seeking higher support, but a worsening technical picture hints at a correction to the 50 SMA.
Hede
ra Hashgraph must clear the resistance at $0.2821 to open doors to gains above $0.3.
Hedera Hashgraph has witnessed an incredible rally since the beginning and 2021 and most recently in March. The token shot up more than 150% in the first 11 days of the month, trading a new all-time high of $0.2821. However, selling pressure has started to intensify, resulting in the ongoing correction.
In the meantime, Hedera Hashgraph is exchanging hands at $0.25 following the minor correction. The downward action appears to be gaining traction, accentuated by the Moving Average Convergence Divergence (MACD). This technical indicator follows the trend of an asset and keeps track of its momentum.
The MACD has stalled significantly higher within the positive region. Besides, the indicator is sending out bearish impulses, especially with the MACD line (blue) likelihood of crossing under the signal line.
On the downside, very little support is expected at $0.25 because the price has sliced through the zone several times before. Therefore, the most significant near-term tentative anchor is highlighted at $0.22. Here, bulls can increase their position and confidently defend the support as they push for another assault on the record high.
However, if push comes to shove and the price explores the levels under $0.22, Hedera Hashgraph will risk diving to the 50 Simple Moving Average (SMA) around $0.18 on the 4-hour chart. Other critical support levels to keep in mind include the 200 SMA currently holding the ground at $0.14 and the buyer congestion zone at $0.11.
Hedera Hashgraph intraday levels
Spot rate: $0.25
Relative change: -0.017
Percentage change: -6.35%
Trend: Bearish
Volatility: Growing


HBAR / USD - Showing Good Chance to go ParabolicHBAR / USD has formed a strong parallel uptrend and it keeps making attempts to break up and out of that trend. Recall that, the more knocks at the door, the better chance at breaking through that door. This is usually said about getting past a resistance (or support), but also applies with parallel channels.
That said, its absolutely possible that we can test the bottom of our channel again before seeing a move up and out.
BTC pair looks even stronger after double-bottoming on the all-time chart and moving back up. We're not even halfway to our old highs vs BTC and may have a shot at breaking it. Should either of those two things occur, the USD price of HBAR could easily do 2-5x from here.
On the chance we move back down and revisit bottom again against BTC, that would give us a triple bottom and send us even higher than expected now. In case you haven't noticed, i'm super bullish on HBAR.
Channel drawn based on 30 min line chart, and then viewed above on daily candle:
