HBAR / BTC - All time fib retracement levelsLook at how perfectly this retraced to the .236 fib after it changed direction following the google news.
We're looking a heck of a lot like Ethereum / USD (whether you are looking at this pair or the USD pair) before it's mega-move from 40 cents to 1400 dollars.
We also look a lot like Tron / BTC chart before it's massive 2017 run.
HBARBTC


HBAR / BTC - Approaching decision timeWe moved back down into the triangle, HBAR is having a difficult time deciding where to go, though the monthly chart still looks like a giant bull flag - it could still go either way.
We are almost at the end of the triangle, expect it to make a choice very soon.

HBAR / USD - Breakout may be occuring with potential >100%We broke the triangle on HBAR / USD, if this becomes a clean break, 10.1 cents is possible
News today - AUD is testing a digital stablecoin running on HBAR / Hashgraph


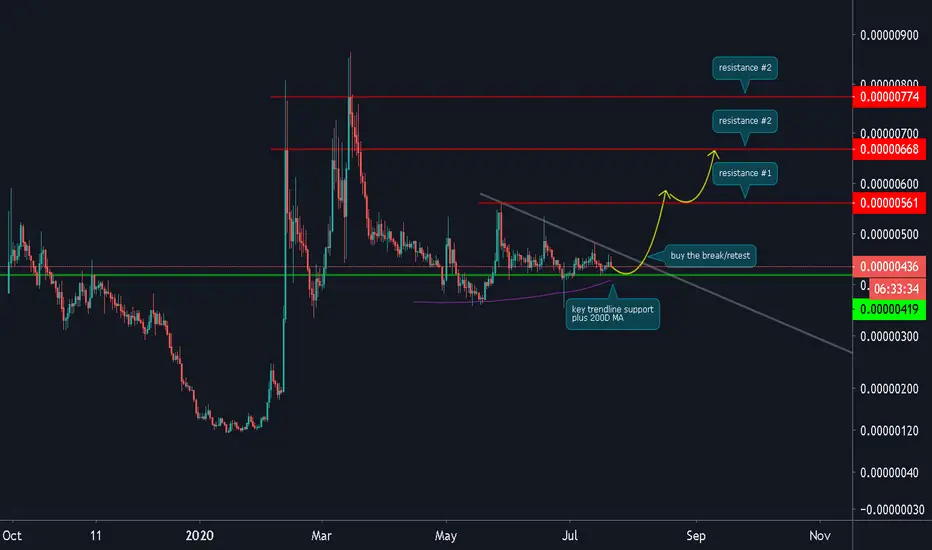
HBAR/BTC (Trading at Key Support Line)HBAR/BTC
-this coin has been in the sideways ranging market for the last 117 days
-currently holding off the key trendline of support
-this level also a confluence of the 200D MA dynamic area
-the only safe trading approach is to confirm the break direction
-if we see a breakout above the descending trendline
-that is a good buy signal or you may wait for a retest of new support
-get ready your alert and add this coin to your watch list
Lateral moves with surprise aheadHBAR have been prolonged its lateral moves. Today a community town hall might clarify further steps in the coin timeline.
The coin has been moving around its long term resistance levels but seems ripe for a bigger move depending on the outcomes of the town hall meeting.
Slowly but steadily HBAR is detaching from its downward trend
Buy current price
TP: 485 - 562 -660 - 800

HBAR/BTC in GREEN MODEStraight to the point guys,
HBAR is looking bullish in coming days, WHY?
1. Weekly resistance was broken at 445, and once that was broken it became support and it is tested and has been rejected which indicates bullish move.
2. Also the accumulation zone between two trend lines has been broken and the new candle is formed above the upper trend line. The candle also wicked the trend line with rejection, which indicates that candle is respecting the support.
3. Candles are going to test the daily level at 471 sats, till then it would be a 7 percent gain. And if it breaks the daily level the next stop would the monthly resistance at 533.
4. RSI indicates there is room for more 30 percent. Bullish.
5. MACD histogram showing upward trend.
Entry:
Optimal Spot: 440 - 452
TP 1: 471
TP 2: 497
TP 3: 533
Stoploss: Below the weekly level at 414, In worst case, the candle may retest the support at 414 and going to retrace back. whose chances are 5 percent as i mentioned all the technical points above.


HBAR / BTC - Made a similar pattern prior to the Google pumpWas just noticing this on the chart, after bottoming Hedera Hashgraph appears to have made a similar pattern on the chart as the larger pattern printing now.
Will we see a repeat of this? The last time was predicated on the announcement of Google joining Hedera's governing council.

HBAR / BTC - Bounce from support at top of long-term triangle?Let's see if we bounce here or break downwards.
A bounce from here is a very good sign for strong bullish continuation, a break back into the triangle puts us back into consolidation, a break below the triangle is a strong bearish signal.

HBAR sobe ou desce?A moeda HBAR parece boa demais para ser verdade, considerando todas as parcerias que ela tem - Google, IBM, Boeing, entre outras grandes. Mas tudo isso não parece ser suficiente para fazer o preço da moeda subir, caso o triângulo simétrico formado após a tendência de baixa que ela vinha indique o que geralmente indica: QUEDA.
Porém, temos um fundo duplo quase completo, que é um padrão de alta clássico.
E aí, bearish ou bullish na HBAR?
Bons trades!


HBAR / BTC - Break out of long-term triangle & 2nd bull flagHBAR broke out of its long-term triangle after printing a bull flag, then it bounced off of triangle support and has now broke previous resistance at 454 sats. Now we are re-testing that area while printing a second bull flag - beautiful!
Keep an eye on this to see if it breaks 500 again, I believe 100+ % gains are possible from here if we can break cleanly passed 500 and then ~539 sats area.

Wyckoff acccumulation on HBAR/BTCThis is an exercise on the Wyckoff accumulation. To be noted that price may retest the lower level of the range (at 382) before moving up.
To estimate the target, I used the counting Wyckoff method (not shown on the chart): .00000361 + (68 bars x 0.00000004 x 3) = .0000118
On the chart, I am showing a more conservative target at .00001 based on the Fibonacci extension of the range ( SC to AR).
I would note that the alts market in general looks in bullish mode against BTC and that the price of HBARBTC is above the EMA200, which would indicate a bullish trend .

HBAR / BTC - Bull Flag forming on 4HBull flag forming on 4H at resistance of symmetrical triangle on weekly. A break up could potentially see a significant move. Breakdown of this trend will also likely see a significant move downwards. Hope for the best, prepare for both scenarios.
** not financial advice, just a noob learning and having fun, please send feedback and critiques/criticism, I love it - thanks!**

HBAR / BTC - Bullish and Bearish Targets and LevelsScenarios for bullish and bearish movement with short-term minor and major targets for both, and levels shown
** Not financial advice, just a noob learning and would LOVE to hear feedback and critiques, criticism from more seasoned traders. **


HBAR / USD possible short-term trend reversal + ~20%Possible short-term trend reversal with approx 19-20% profits by 4th of July weekend
RSI and Stoch RSI is oversold and trend has already begun reversal. Always beware of BTC
** Not financial advice, just a noob learning, always open to feedback and criticism, thanks for checking this out! **

HBAR / BTC - 125% profit potentialTarget 1029 sats, stop 432, beware btc
(not advice, just a noob learning and open to criticism/feedback, thanks!)

HBAR / BTC - Reminder: monthly chart forms a massive bull flagHBAR is going to surprise a lot of people, I still believe. The volatility today seems like a bad sign, and it very well may be. So be careful, but volatility has preceded some of the largest moves in crypto. Either way be careful, and never risk more than you should.
Not financial advice, just a noob having fun learning and open to teh feedbacks :)

HBAR / USD - Possible HSi forming / breakout in ~1.5-2 daysLet's keep this simple, there's a possible inverse head and shoulders forming on HBAR / USD (also on the BTC pairing but not as clear). We are in the handle of a cup and handle formation, RSI is low. Watch for a possible breakout in 1.5-2 days or less, if the HSi plays out.
Expected targets (for HBAR / BTC pairing): 489, 583, 677, 711, 865, and up.
If we pass 489, I at expect we'll reach at least around 517 (just at, above/below 0.05 cents USD), testing around where the top of the cup was before.
Support areas: 442, then 395.
Always be careful of BTC!
Not financial advice, just a noob having fun learning and open to feedback from the learned :)
