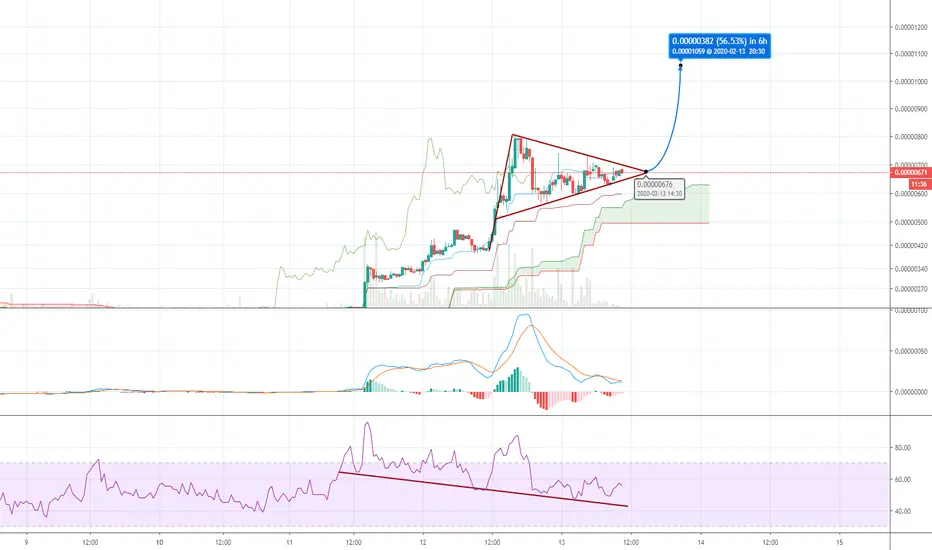
HBAR super highHBAR grown by 578% since my Premium channel signal. Sure I didn't expect such a pump and it overgrown all the targets I could possibly think of =)
When people hear words "partnership" and "Google" together, it makes them crazy )))
Now time for retracement. Or not? Google, google, google, keep up reminding myself that magic word. But not buying here for sure. My bet is on retracement, as we should sell the news, not buy them.
But even with short position, I feel very bullish about this coin. It will grow high. So it is long term hodl.
HBARBTC

Hedera Hashgraph Moves Big | The Most Common Mistake Trading CryHedera Hashgraph (HBARBTC) took off today and is active with a massive green candle after breaking EMA50 and testing it as support... We have a high volume jump of 88% so far... It can continue growing.
Now, what is the most common mistake when trading crypto?
A: Being too conservative with our targets.
Believe it or not, the cryptocurrency market is incredibly wild and there are always huge price swings... The most common mistake that we see is the potential being underestimated or not accepted when seen.
There is always lots of noise when we share big numbers, but this is normal when it comes to crypto... Cryptocurrency, altcoins always MOVE BIG!
Namaste.

HBAR - Another run?Squeez is about to get over. It should bounce from here.
Setup is quite simple, HBAR is holding trendline well and I am expecting it to bounce from here.

HBAR (4H)HBAR to return to 50MA, and to continue to new highs, as both 'daily' and 'weekly' candles strongly suggest.
(Updates to continue here)

hbar cost average pointHuge sell off pushed the prices low. This might be a great place to cost average. Hedera is "evaluating" the current economic plan and could be incentives for ICO holders.
IMVHO addressing problems is the key to success. This could be the pivotal moment in time HBAR needs to regain confidence and soon price.
hou je sterk!

HBAR/BTC Bullish Next Wave?
HBAR/BTC having a nice healthy pullback from the support between 187-162 sats, must hold this area for another
potential bull pump next potential target up to 246-293 sats. We have a strong support trend line at 169 sats a good area to buy a LONG entry at this level.

HBARBTCAlmost forgot about this cause in all honesty i thought it's a scam. Couple of months back they had a huge dilemma with regards to their token metrics which caused the price to tank.
been throwing 500 bucks at it which turned out to pay for my next mini vacation.
Let's see how long the google hype will last or until whales will dunmp on everybody. Moving stops as we go higher.

HBAR - trade still onPrice may find support above resistance.
After 100% run in 1 week HBAR needed to rest a little.
However price may not fall much further from here.

$HBAR bullish continuation! Welcome to the bullmarket. $HBAR bullish continuation! Welcome to the bull market. The whole downside has been nullified/returned in a signal day.
Does not matter if it goes another 500% ,you have to secure some profits!

HBAR just did +80% in an instant. HBAR just did +80% in an instant after printing an H&S pattern. Train your eyes and psyche to withstand these explosions, they tend to materialize more often during bull markets.

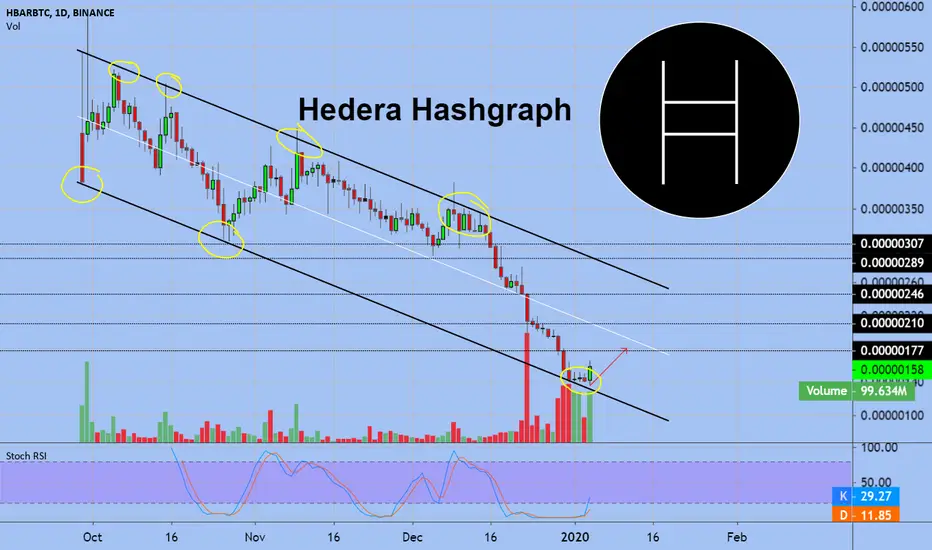
HBAR Channel Cup Ross hooks Growth potential to resistance +65%The main trend is a downtrend. Downstream channel. The secondary trend is upward. A cup. Ross hook. Buyer Volume.
The upside to the first resistance is about + 65%.
A breakthrough of resistance and consolidation above it will mean a reversal of the main trend and exit from the downward channel.
Also do not forget that the price may fall to the bottom of the downward channel. Therefore, choose the correct entry point. Never rush to enter the market.
Ross hooks are a work in a local trend.
I described in more detail about working with these formations in this training - trading idea using the example of BTC / USD.
Note the example was shown at work online , and not on the old schedule. The example worked completely. Target + 22% taken.
TRAINING
Ross hooks on the example of BTC.When confirming the trend + 22%

HBAR/BTC longThis one looks really interesting.
As you can see in the chart, the coin has been in a prolonged downtrend against btc, until buyers stepped in forming a beautiful rounding bottom which could in my opinion morph into a cup and handle pattern.
The buyers pushed the price higher from the bottom, producing a high RSI level, which needs to get lower.
That's the reason why I am expecting this to retrace a little bit more before breaking the blue upper line.
Once we break that line, we would have a perfect cup and handle reversal chart pattern. This combined with the green volume is a good sign of a reversal.
Also notice how the price pushed higher as soon as the ema 8 moved above the 21 ema, that would have been a perfect entry point, but one rarely enters at the very bottom, that's why I am expecting to correct and afterwards break that blue line to enter long positions.
Check my other ideas if you like this one. My posts are clearly for educational purpose only, not a financial advice.

Hedera HashgraphHBARUSD is the one of the worst performing tokens, with ICO Price $0.12, Low at $0.0095 is at firts serious resistance, but still with limited growth potential.
Binance Pairs, HBARBTC, HBARUSDT,HBARBNB
Disclaimer:
We are not registered or licensed in any jurisdiction whatsoever to provide investing advice or anything of an advisory or consultancy nature,
and are therefore are unqualified to give investment recommendations.
Always do your own research and consult with a licensed investment professional before investing.
This communication is never to be used as the basis of making investment decisions, and it is for entertainment purposes only.


HBAR short term look easy 50%+ potentialAfter a long decline and accumulation as you can see downtrend was broken. After pullback to indicate support zone we can open long position.
Trade in profit! Push up Like button if you like my reviews and help you understand the current market situation! Subscribe to the channel and stay tuned for trading ideas that are not trading recommendations.
And remember! You must have your head on your shoulders! Do not trust anyone - not even me :)
Thanks to your likes, I understand how many people rated my review positively. I spend my personal time monitoring the market situation and share my opinion openly with you. Please take this moment into account and treat it with understanding.

Hedera Hashgraf - this might be a buying opportunityReal relative strenght on RSI !
On balance volume looking constructive.
I am in !!

HBAR HAS MORE ROOM TO PUMPHbar has a lot more room to grow. We broke out of the black downtrend, accumulated and have now broken out. 196 is first target. Id buy dips all the way down to the top of the accumulation zone.

HBAR/BTC 1D (Binance) Broke-out of falling wedgeHedera Hashgraph is looking quite good for mid-term after this breakout and pullback.
The road to last triangle support (became resistance) is just starting, set-up:
Entry= 0.00000127 - 0.00000135
Take Profit= 0.00000163 - 0.00000195 - 0.0000259
Stop Loss= 0.00000099 or below
Risk/Reward Ratio= 1:1 - 1:2 - 1:4


HBAR/BTC | Descending Channel !!HBAR/BTC (Update)
Forming Lower Lows in DAILY Chart From Long time & Now Buying Volume is Increasing .
RSI & MACD Both Are Turing Bullish as well. Moving Below the Daily EMA10, If Broken it then Chances of Uptrend Will Increase.
Key Resistance/Breakout Zone : 237 Sats
Please like, subscribe and share your ideas and charts with the community!

Hedera HashgraphHBARBTC moving in downtrend channel.We touched support line of this channel and I see volume is coming. We can reach midle line of this channel