#HBAR/USDT Technical Analysis: Bullish Long-Term Outlook HBAR Technical Analysis: Bullish Long-Term Outlook Despite Short-Term Correction Expected:-
Based on the technical analysis, HBAR is currently trading at $0.072, representing a 100% gain from the recent bottom and a 170% increase from the previous low within the last two months. However, the chart indicates that $0.1 is a strong resistance level, and there is strong rejection from this level.
Furthermore, today marks the unlocking of 3 billion HBAR tokens, which could be perceived as negative news for current holders. There is a fear that those who have been holding these tokens for a long time may sell them in the market, resulting in a further decline in HBAR's price. Therefore, it is advisable to stay away from HBAR in the coming days.
As per the technical analysis, a 15-20% correction from the current level is expected, and HBAR may test the $0.05 level in the near future. However, in the long term, the outlook for HBAR is bullish, and it is recommended to accumulate it during significant dips.
The Fib retracement level shows that the 0.618 Fib retracement support is also at the $0.05 level, which implies that there could be a bounce from that point.
The upper side targets are considered to be the resistance levels, which are $0.1, $0.177, and $0.44. On the other hand, the support levels are $0.05 and $0.037.
If you appreciate my hard work and analysis, please like, share and comment. Kindly follow me for any latest updates. Thank you.
HBARBTC

A break of static resistance is not yet confirmedWe saw that the resistance of the $0.080 to $0.085 range was broken. Importantly, resistance has been placed above this level in the $0.10 range, temporarily blocking HBAR price from further growth.
Therefore, the strong negative reaction that has been observed in the past few days can cause the price to enter the range trend this week.
The resistance support levels drawn on the chart can be considered reactive and important ranges, which can be used for short-term trades in case of the formation of return patterns in the low times.
Also, as long as the bottom of the channel is not broken, there is a potential for the trend to remain bullish in the 4-hour timeframe. A break of static resistance is not yet confirmed and requires daily candles to stabilize above this level.

HBAR taking out ShortsA retest of Preliminary Supply may well be in order next; an ABC correction to fill whale shorts.
HBAR has also been heavily shorted, so shorts need to be cleared before the drop.

HEDERA HBAR UPDATEHedera is the most used, sustainable, enterprise-grade public network for the decentralized economy that allows individuals and businesses to create powerful decentralized applications (DApps).

HBAR How we caught the easy 60% Move 🔥💸When everyone is getting bearish most altcoins were hitting the weekly demand zone,One of the most lucrative coins for our team to look at was the HBAR coin which it hit the weekly demand zone. So we entered positions both in spot and future"s and we are currently up by 60%.
There are many more coins that have hit the weekly demand zone and have run higher from the bottom.
Message us if you have any queries and follow for more charts updates.
The old hbar idea is linked below.

Finally Breaking Another Bulish Pattern Forming Bulish Pennant In h4 Timeframe
Incase Of Breakout Expecting 25 to 30% bulish move Keep Eyes On for Breakout

$HBAR/#BTC [#Hedera]: Resistance_Breakout_ConfirmationWe've detected a Resistance Breakout and Confirmation on the $HBAR / $BTC chart. The price has broken above a key resistance level and has been confirmed by a strong candle, indicating a potential bullish trend. The next resistance key levels are at 0.00000311 | 0.0000033 | 0.00000368 and the major support zones are respectively at 0.00000273 | 0.00000254 | 0.00000216. We may consider entering a trade at the current price zone at 0.00000308 and targetting higher levels.
Technical Metrics :
Current price: 0.00000308
24H Volume: 38.5509 Ƀ
24H Price change: 5.119%
- Pivot Points - Levels :
Resistance: 0.00000311 | 0.0000033 | 0.00000368
Support: 0.00000273 | 0.00000254 | 0.00000216
Indicators recommandation :
Oscillators: NEUTRAL
Moving Averages: STRONG_BUY
Technical Indicators Summary : BUY
- In-depth HBARBTC technical analysis on > Tradingview TA page

Has not been able to cross this resistance yetHBAR had a range trend last week. Its price, which had hit the resistance of 0.070 to 0.073 dollars, has not been able to cross this resistance yet. Because the resistance of the roof of the main descending channel is also in this range. Therefore, the strong upward trend has been ranged by reducing demand and saving profits of some short-term buyers. Support in the $0.0583 range is evident on the chart, and the short-term trend is more likely to continue between these two levels.

Bullish wave can resumeHBAR continued its upward trend last week, and a sharp break into the $0.070 - $0.073 resistance range has been seen. The daily candle has not yet closed above this level, and the breaks that have been recorded are fake. In the 4-hour timeframe, the price of HBAR is inside a narrow ascending channel, the ceiling of this channel was fake broken in the past days, and due to encountering a strong resistance, this reaction has caused the price to return to the channel. So, according to this reaction, there is a possibility that the price trend will be below this range for some time. But further, because the potential for a trend change has been created in the daily timeframe, and the bullish wave can resume by correcting to the support range of $0.0605 - $0.0550, we expect the current resistance to be broken for the next week.

We expect to see the range trend of this HBARThe first support is at the price of $0.050, which was the first encounter with a positive reaction, and the second support is considered in the $0.044-0.046. With this strong reversal, we expect to see the range trend of this HBAR between the specified levels this week. After that, we can expect higher targets in the $0.070 range to be available to buyers after the upcoming resistance is broken.

HBAR CAN FALL AGAINHi, dear traders. how are you ? Today we have a viewpoint to SELL/SHORT the HBAR symbol.
For risk management, please don't forget stop loss and capital management
When we reach the first target, save some profit and then change the stop to entry
Comment if you have any questions
Thank You

#HBAR/USDT Sideways Channel Trade setup: Trading in a Sideways Channel ($0.06-$0.08), with $0.06 support having recently received big buying volumes interest. (set a price alert).
Pattern: Price is trading in a Sideways Channel , which is a neutral pattern (indication of market indecision). Trend Traders ought to wait for a breakout in either direction, although typically it breaks in the direction of the existing trend. Swing Traders can trade the range – Buy near Support and Sell near Resistance.
Trend: Downtrend across all time horizons (Short- Medium- and Long-Term).
Momentum is Mixed as MACD Line is above MACD Signal Line (Bullish) but RSI ~ 50 (Neutral).
OBV (On Balance Volume): is rising, indicating that volume on Up days is greater than volume on Down days. Hence, demand (buyers) exceeds supply (sellers).
Support and Resistance: Nearest Support Zone is $0.060. The nearest Resistance Zone is $0.080, then $0.100.

HBAR/USDT - LONG 12H TF----- Welcome, dear followers! -----
- Here is my trading methodology. I trade with a normal system and analysis of resistance and support, as well as price reversal patterns.
- For the record, I do not place a stop loss within my trades. So that I only risk 1.5% of my total capital in order to support the loss due to a price reversal against me.
- If a price reversed against my expectation and touched the drawn line r3, then I transferred targets to the entry point and waited for the price to close at it with a loss equal to almost zero.
- Today's deal is shown in the chart, and here are the entry and exit points below.
-- Support me with numbers and follow up on my account for other deals in the future. Thank you for coming to this part.
---------------------------------------------------------
⚡️⚡️ #HBAR/USDT ⚡️⚡️
Client: My-Binance Futures
Trade Type: Breakout (Long)
Leverage: Cross (2X)
Entry Targets:
1) 0.06305 - 100.0%
Take-Profit Targets:
1) 0.06644 - 20.0%
2) 0.06882 - 20.0%
3) 0.07274 - 20.0%
4) 0.07898 - 20.0%
5) 0.08381 - 20.0%
Trailing Configuration:
Entry: Percentage (0.0%)
Take-Profit: Percentage (0.75%)
Stop: Breakeven -
Trigger: Target (1)

HBAR 3 day chart looks promising.HBAR 3 day candle must break out
BULLISH of this white circle to show
strength, which is also in between the
Red and Green lines and that indicates
the BULL MARKET SUPPORT BAND. HBAR
has been listed as an ISO-20020 token which
facilitates the creation of all new services and
enhanced straight-through processing.
mainstream worldwide adoption of these type
of tokens will be huge in the near future.

HBAR (Triple bottom pattern)HBAR / USDT
Price printed triple bottom pattern
With very clear trendline resistance
A breakout will confirm it’s bullishness
Best of wishes

Hedera Hashgraph (HBAR) formed Gartley for upto 17.50% pumpHi, friends, hope you are well and welcome to the new trade setup of the Hedera Hashgraph (HBAR) coin with US Dollar pair.
Previously I shared the below long-term trade setup for HBAR, which is still in play:
Now on a daily time frame, HBAR has formed a bullish Gartley pattern.
Note: Above idea is for educational purpose only. It is advised to diversify and strictly follow the stop loss, and don't get stuck with trade

HBAR Long Idea2020 Resistance has now become support, we like this area for a long as a non leveraged trade with an SL RISK of 4 to 5%.

HBAR / BTC in a Parallel Uptrend?Quick chart here. Is HBAR / BTC in a parallel uptrend? We still need 3 touches at top and bottom to confirm this. If this is correct, we're at the bottom of the trend now and should see another trip to the top.
Should we do that and stop at the top, expect to see a third trip to the bottom as well. MACD and RSI are also pointing to a reversal here, as confluence.
An alternative possibility, if we hold channel bottom and then break channel top, this could turn into a giant inverted head/shoulders and become much more bullish sooner.
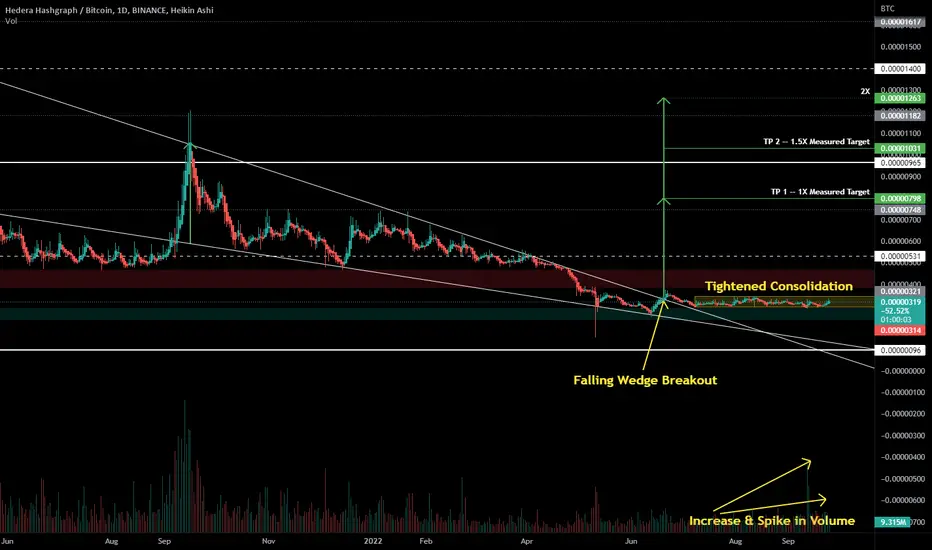
Signs of an Impending Move for Hedera vs. BitcoinAround June 19th, we broke out of a daily falling wedge (shown above), and again around end of July we broke out of a weekly falling wedge (not shown). Since then Hedera has started a pattern of consolidation within a very tight range, just above support, and below resistance. Measured wedge targets take us right at previous ATH (candle close), and a more liberal 2X target takes us above our all-time highest wick.
Each of these provide confluence that Hedera is gearing up for a move.
So, look for us to break out of the small range that we've been in for the last several weeks.
And, even if that becomes a break below the consolidation range before it breaks above, it could still act as a fulcrum for pivoting to a significant move up.
What we don't want to see is a loss of support (green box) that holds.
HBARNot financial advice. The essence of investing & trading is the intelligent and patient preying on the greed, fear, impatience, addiction and ignorance of the majority. It's definitionally Darwinian.

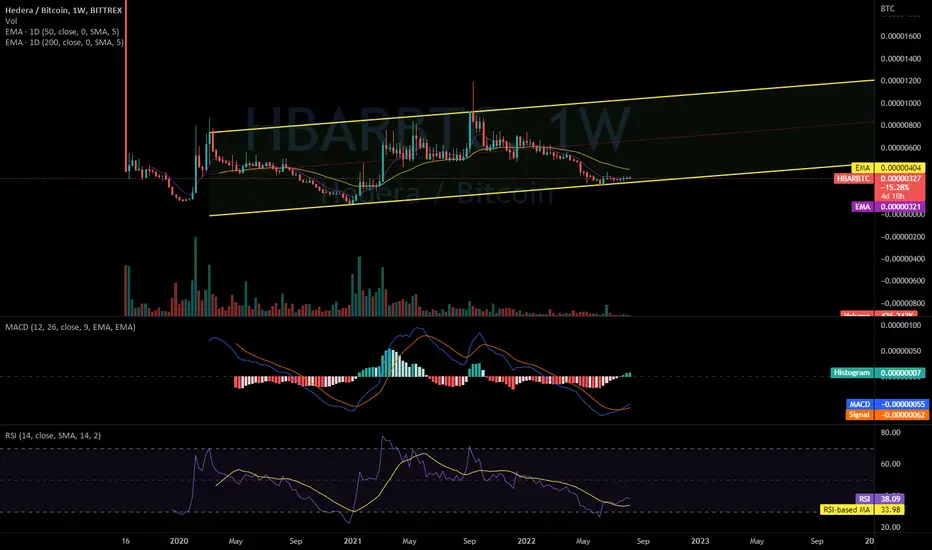
HBAR Ready to Rise for the 3rd TimeHBAR broke out of a falling wedge on its weekly chart a couple of months ago. It has since held above weekly support, and well above the wedge. If there is another dip prior to continuation, I could see it test the top of the wedge, near the bottom of support. However, if we lose support and close below the top of the wedge, this idea becomes invalidated.
Measured targets / fib levels:
-- TP 1 - 599-605 sats
-- TP 2 - 734-744 sats
Some confluence to support this idea:
-- Chart VWAP, with the full chart in view, wants average price to be near the top of the resistance area shown.
-- Zooming in to view the falling wedge moves the chart VWAP to line up with TP 1 as well (see chart snapshot below).
-- TP 1 lines up closely with our 0.618 fib (within 6 sats), where fibs are based on the previous move from trough to peak.
-- TP 2 also lines up closely with our 0.786 fib (within 10 sats)
-- RSI has bottomed out, slightly higher than our previous bottom, and it shows similar movement to the last two moves from bottom, theorizing that each in a series of 3 (assuming we've begun our 3rd move) has a consolidation period that begins closer to its initial impulse, and consolidates for a longer period each time.
-- Stoch RSI has also bottomed out and then reached top, also showing similar movement, and also theorizing that each in a series of 3 (again, assuming our 3rd move has begun) has a longer consolidation period between peak 1 and 2.
Zoomed in view of falling wedge and Chart VWAP lining up with TP 1:
Thanks for hearing my thoughts, please leave your own in the comments below. If this move does play out, I think it'll become highly likely that we see a new ATH before seeing any long-term bearish movement again. There is a linked idea for the HBAR/USD pair below under Link to Related Ideas, or here:
-dudebruh

HBARUSD 2023 The Maths lines up for HBAR. Fundamentally the project is great IMO. Ready for the next big HYPE cycle.
NFA

#HBAR, possibly on the verge of a larger move#HBAR
Like other pairs that have just closed today.
possibly on the verge of a larger move toward 10 cents
While UCTS printed a 2D Buy signal, volume was slightly rising.
$HBAR
