This could be really bullish for HBARLast time this happened, $HBAR pumped hard. Depending on what $BTC does from here, we could see a good upside for $HBAR.
HBARBTC

HBARUSDT Technical Analysis
Welcome back Traders, Investors, and Community!
HBARUSDT on H4 has broken above the resistance and the triangle. The price might go lower to retest the previous resistance but then it is expected to go higher.
⬆️Buy now or Buy at 0.23499
⭕️SL @ 0.22442
✅TP1 @ 0.25550
✅TP2 @ 0.26500
✅TP3 @ 0.27777
✅TP4 @ 0.28500
✅TP5 @ 0.29500
Check the Links in Description and If you LIKE this analysis, Please support our page and Ideas by hitting the LIKE 👍 button. ❤️ Your Support is really appreciated! ❤️
Traders, if you have your own opinion about it, please write your own in the comment box. We will be glad for this.
Feel free to request any pair/instrument analysis or ask any questions in the comment section below.
We will have more FREE forecasts in TradingView soon
Have a Profitable Day

HBAR / BTC - BTC.D in Rising Wedge, Alts in Falling WedgeAt the moment, it looks like Bitcoin wants to rise against alts, and it may do so in the short term, but mid to long-term a rising wedge coming out of a downtrend is a bearish continuation pattern for bitcoin dominance, while a falling wedge coming out of a downtrend is a reversal pattern.
Hence, I think there's a good chance alts like HBAR and others are going to see some pretty nice gains against bitcoin. Preface this with the fact that patterns like this aren't always successful, especially in crypto, but they are "reliable" most of the time. Keep an eye on both and let's see if it does what it is supposed to do.
Related ideas linked below

hbarusdt possible short opportunityif it fails to break the blue line I expect a reverse move from there.

HBAR / BTC - Alternate Idea: Triple Bottom Before new ATHRelated to the bearish scenario I spoke of in the idea below, where we head up from here to ~716 sats or so and then experience a bearish reversal, forming a head and shoulders that leads to a triple bottom (or a giant inverted head and shoulders on the all-time chart). Should that occur, it may look something along the lines of what's drawn on the chart above.
Here's a link to a more detailed post, that is bullish, but describes a bearish alternative:

HBAR - BULLISH FOR 120% PROFIT - CryptoManiac101HBAR / USD TA
Just watching this play out, but it's definitely interesting to see if this fractal which happened just few weeks ago will repeat again.

HBAR / BTC - Repeating Pattern End of July UpdateOur repeating pattern on the daily is dragging out further than originally drawn, and as we all know - the longer we drag along while moving within a range (between the red and green boxes), the larger our eventual move becomes when the chart finally decides upon a direction.
I post multiple ideas*** and latch on to the ones I feel progress best. This is one of those that has progressed really well, though dragging out further - I'm anticipating a strong decision when it does decide.
***See previous updates about this under Related Ideas by scrolling to the very bottom of this page, including the original post suggesting a repeating pattern back on May 17th.***
So, let's talk about how we got here, and where we may be going - first zooming in on the 4H chart, and then a few looks at the weekly now and in the past:
4H chart & impressions:
At the end of the current pattern, following a diamond reversal, we see a head and shoulders. As shown on the 4H chart below, we broke below the neckline forming a bearish target of approx. 368 sats, but.. we failed to stay below the neckline.
Now we've broken back above the neck and have so far managed to stay above it. If this continues, it becomes a failed head and shoulders and and we have instead a bullish target of approx 716-728 sats (or higher).
4H Chart:
Weekly chart & impressions:
Our current 4 weekly candles look a lot like the last 4 that ended in a bullish move that closed around 710 sats and wicked above 820-830 sats, our most recent and highest high. (see more on this with each screenshot below)
Weekly Chart:
That 4th weekly candle ended high, but it began low, wicking down to test the bottom of our green box prior to moving up to make our high (this is a replay of the beginning of that weekly candle, from around May 10th):
Now we are seeing similar behavior from the current weekly candle, which began looking bearish and wicked down to the exact same area at the bottom of the green box:
Conclusions:
- One difference in the current pattern that appears to be repeating vs the previous smaller one, is that the smaller one wicked down to re-test the top of the triangle it originally broke out of, see green circles on main chart from this post. We haven't yet done that, which is why (despite being extremely bullish) I believe that it's still possible we move down to 386 sats. That said, we need to cross back below the neckline of the head and shoulders to get there. However, if this does occur, I think it makes the chart all the more bullish and more likely to break our ATH of 864 and get into price discovery.
- Should the above not occur, we have an interim bullish target of ~716-728 sats. This is bullish, but also puts us in a danger zone with the potential to form a giant head and shoulders pattern on the daily & weekly charts. To avoid this, we need a weekly candle to close above 710 - preferably, break 800 sats and then 864. If we wick up to 716-728 on the weekly but fail to stay there and close closer to mid-to-low 600s, we start to see the possible head and shoulders (however, even that could fail and make us bullish again).
- long-term bull: if we eventually break our ATH of 864 and then manage to cleanly get above 1000, I really like the area of 1350-1450 sats as stopping point while in price discovery.
- long-term bear: if we break down to 368 and don't turn back up quickly as I expect, instead falling further, I see the possibility of a triple bottom forming on the weekly chart (for it to become more bearish than that, we'd need something like a market crash to occur).

HBAR / BTC - Failed Head/Shoulders Targets 728HBAR failed to complete a head and shoulders pattern (drawn from the 4H chart, this is the daily chart), and now gives us a bullish target of slightly above 728 sats. From here, we risk a larger head and shoulders pattern if we aren't able to reach 864 sats.
Previous HS idea linked below as well as a bullish take on USD pairing that is more in line with this.
4H Head and Shoulders:

HBAR / BTC - HS may lead to a re-test @ top of channelHBAR / BTC is repeating the same pattern as it did prior to moving up above 400-800+ sats area. Just like before, we've broken out of a channel (bull flag), and should be moving up but have been ranging between the red and green boxes. At the moment, however, we may be forming a head and shoulders pattern that could lead to a break down below our green box towards the lower green box at the top of our old channel.
Channel was drawn on daily chart, red diagonal line above it is to denote 4H highs of channel pointing in the same parallel direction. Chart above is 4H chart.
Last time, we did the exact same thing - we broke out of a channel (bull flag), and then began ranging, eventually dropping below the range and re-testing the top of the channel before moving back up into our range and eventually breaking out forming a new high.
I believe there's a good chance we may do this again. See chart for visual description of the above, see repeating pattern ideas linked below under Related Ideas.
NOTES about Strategy:
This post is presently listed as Short, but for short term only.
Long-term I am Long on HBAR, and if you are waiting for an HBAR long opportunity it is probably not the best idea to have a short strategy against it, because when it finally does move up, it may do so rather violently.
Daily Chart:
Original Repeating Pattern Chart:

Hedera Hashgraph (HBAR) - July 24Hello?
Welcome, traders.
By "following", you can always get new information quickly.
Please also click "Like".
Have a nice day.
-------------------------------------
(HBARUSD 1W Chart)
As the support zone is weak, we can only hope to maintain the price above the 0.16519911 point to continue the uptrend.
(1D chart)
If the price is maintained in the 0.14056436-0.20581091 range, it is expected to turn into an uptrend.
A move below the 0.16519911 point should check for support at the 0.10794109-0.14056436 range.
To accelerate the uptrend, you need to break out of the downtrend line.
Specifically, it should rise above the 0.30368073 point.
-------------------------------------
(HBARBTC 1W chart)
If the price is maintained above the 320 Satoshi-398 Satoshi range, it is expected to continue the upward trend.
(1D chart)
It remains to be seen if the 514 Satoshi-566 Satoshi section can support and rise.
If it falls from the 514 Satoshi point, Stop Loss is required to preserve profit and loss.
However, as long as it does not fall below the downtrend line, it is expected to rise, so you should be prepared for this.
------------------------------------------
We recommend that you trade with your average unit price.
This is because, if the price is below your average unit price, whether the price trend is in an upward trend or a downward trend, there is a high possibility that you will not be able to get a big profit due to the psychological burden.
The center of all trading starts with the average unit price at which you start trading.
If you ignore this, you may be trading in the wrong direction.
Therefore, it is important to find a way to lower the average unit price and adjust the proportion of investment, ultimately allowing the funds corresponding to the profits to regenerate themselves.
------------------------------------------------------------ -----------------------------------------------------
** All indicators are lagging indicators.
Therefore, it is important to be aware that the indicator moves accordingly with the movement of price and volume.
However, for the sake of convenience, we are talking in reverse for the interpretation of the indicator.
** The wRSI_SR indicator is an indicator created by adding settings and options to the existing Stochastic RSI indicator.
Therefore, the interpretation is the same as the traditional Stochastic RSI indicator. (K, D line -> R, S line)
** The OBV indicator was re-created by applying a formula to the DepthHouse Trading indicator, an indicator disclosed by oh92. (Thanks for this.)
** See support, resistance, and abbreviation points.
** Support or resistance is based on the closing price of the 1D chart.
** All descriptions are for reference only and do not guarantee a profit or loss in investment.
Explanation of abbreviations displayed in the chart
R: A point or section of resistance that requires a response to preserve profits.
S-L: Stop Loss point or section
S: A point or section where you can buy to make a profit as a support point or section.
(Short-term Stop Loss can be said to be a point where profit and loss can be preserved or additional entry can be made through split trading. It is a short-term investment perspective.)
GAP refers to the difference in prices that occurred when the stock market, CME, and BAKKT exchanges were closed because they are not traded 24 hours a day.
G1 : Closing price when closed
G2: Opening price
(Example) Gap (G1-G2)

HBAR / BTC - Repeating Pattern Update - Pattern Nearly CompleteAfter originally publishing in May, we've stuck to this pattern rather closely the entire time (see original posts linked in related ideas below). It appears it's almost time for us to choose our direction. Here's my take:
1.) Bull now - our high in the middle of the pattern made a bearish diamond reversal, and our min target is where we stopped, 2-3 times depending on which timeframe we look at, making a double (daily) or triple (4H) bottom. From here. we simply head up, break recent highs, and make a new ATH, which is looking to be the case here unless we have another strong rejection due to a BTC rise. Need to get above 645 sats to continue up.
2.) Bull later - if BTC rises and we fall hard against it - we sweep lows one last time before moving up, potentially making our lowest low prior, re-testing near the top of the triangle we broke out of (somewhere between 368 and 410 sats - 368 is a head and shoulders target if our current move up turns into a right shoulder, or even a double top), once BTC is around 50-53% (or even low 60s) in dominance, we finally go make our new ATH. Need to get below green box and red line (diamond reversal min target) to continue down this low.
Bearish alternative - we fail at making a new ATH and go back to bottom, making a triple bottom before moving up and making a new ATH. I doubt this is the case, but it is possible, for now I'm a bull on HBAR / BTC.
Original Chart from May 14:
Update on the above from around mid-June:

HBAR stuck in downtrend Hedera has been in a downtrend channel since mid march or so and we are struggling to make it out, now the channel may not be 100% accurate size wise because of the multiple tall wicks but another could argue there is a couple down channels within the larger one. We were getting fairly close to that bottom bollinger band which could of drop us to the bottom of the channel or even lower but it seems like we have found some footing, first of all we gotta break above the midline on the bollinger bands if we want to start to see a climb upwards. and also with the bands squeezing down on us we are in the coming days/weeks going to see a large scale move, no one knows exactly what direction it'll be in but the more the bands squeeze the bigger move we are going to see. on the Wave trend oscillator we have found some declining support and it looks like our current wave could be reversing on this support, getting ready for a next wave upward. we are just about at the buy zone so we have tons of room to make a big run upwards, one spot we will have to keep an eye on is this downwards resistance that could give us some struggle once we reach that point, if we do smash through this resistance we could be looking at a nice sized run that i believe would bring us up above the midline of the bb's and also even better probably to the top of the bands which could then induce another huge run upwards. remember though BTC is the market mover so that is always a big factor that could end up voiding this whole TA lol. Not financial advice just my opinion!


HBAR / BTC - Approaching Channel BottomQuick chart, daily BTC pair - HBAR is approaching bottom of proposed parallel uptrend. Shouldn't see us go much lower than 517 on the lower timeframes, daily needs to close above the bottom of the channel later today for this to remain relevant.

Hedera Hashgraph (HBAR) - July 4Hello?
Welcome, traders.
By "following", you can always get new information quickly.
Please also click "Like".
Have a good day.
-------------------------------------
(HBARUSD 1W Chart)
If the price holds above the 0.08464062 point, we expect the uptrend to continue.
(1D chart)
If it rises to the 0.20581091-0.27105746 section, it is expected to turn into an uptrend.
If it goes down, you should check to see if it finds support at the 0.16519911 point.
If it falls in the range of 0.10794109-0.14056436, there is a possibility of entering the mid- to long-term investment area, so careful trading is required.
-------------------------------------
(HBARBTC 1W chart)
If the price is maintained above the 864 Satoshi point, it is expected to create a new wave.
If the price is maintained above the 320 Satoshi-398 Satoshi range, it is expected to maintain an upward trend.
(1D chart)
If the 514 Satoshi-566 Satoshi section is supported and rises, it is expected to maintain the uptrend.
If it falls from the 514 Satoshi point, Stop Loss is required to preserve profit and loss.
However, in the 320 Satoshi-398 Satoshi section, it is supported and can rise, so countermeasures are required.
------------------------------------------
We recommend that you trade with your average unit price.
This is because, if the price is below your average unit price, whether it is in an uptrend or in a downtrend, there is a high possibility that you will not be able to get a big profit due to the psychological burden.
The center of all trading starts with the average unit price at which you start trading.
If you ignore this, you may be trading in the wrong direction.
Therefore, it is important to find a way to lower the average unit price and adjust the proportion of the investment, ultimately allowing the funds corresponding to the profits to regenerate themselves.
------------------------------------------------------------ -----------------------------------------------------
** All indicators are lagging indicators.
Therefore, it is important to be aware that the indicator moves accordingly with the movement of price and volume.
However, for the sake of convenience, we are talking in reverse for the interpretation of the indicator.
** The wRSI_SR indicator is an indicator created by adding settings and options to the existing Stochastic RSI indicator.
Therefore, the interpretation is the same as the traditional Stochastic RSI indicator. (K, D line -> R, S line)
** The OBV indicator was re-created by applying a formula to the DepthHouse Trading indicator, an indicator disclosed by oh92. (Thanks for this.)
** See support, resistance, and abbreviation points.
** Support or resistance is based on the closing price of the 1D chart.
** All descriptions are for reference only and do not guarantee a profit or loss in investment.
Explanation of abbreviations displayed in the chart
R: A point or section of resistance that requires a response to preserve profits.
S-L: Stop Loss point or section
S: A point or section where you can buy to make a profit as a support point or section.
(Short-term Stop Loss can be said to be a point where profit and loss can be preserved or additional entry can be made through split trading. It is a short-term investment perspective.)
GAP refers to the difference in prices that occurred when the stock market, CME, and BAKKT exchanges were closed because they are not traded 24 hours a day.
G1 : Closing price when closed
G2: Opening price
(Example) Gap (G1-G2)

HBAR / BTC - Repeating Pattern UpdateQuick update, the repeating pattern idea posted a while back continues to be the most accurate of my forecasts for HBAR / BTC. We bounced off of the green support area, as well as the top of the bull flag we broke out of. This was the same behavior we saw prior to our previous big move up.
The longer we drag out here, whether through June, July, or longer, the larger the potential becomes for our eventual move up against bitcoin. Alternatively, the more immediately we move, the lower the high will be as opposed to dragging out for weeks/months (see TP 1 and 2 for a more immediate move, for a dragged out move - we could see 1400 to even 3.5k sats or higher).
Expecting that we range for some time between the green support and red resistance areas for some time, potentially with a few wicks that could take us to or near 700-860s sats or as low as the bottom of our green support area (potentially touching the top of the flag again if lower). Eventually we should break our recent high and/or 864 (weekly all-time high), re-test and then take off into price exploration.
Original chart linked below and here:

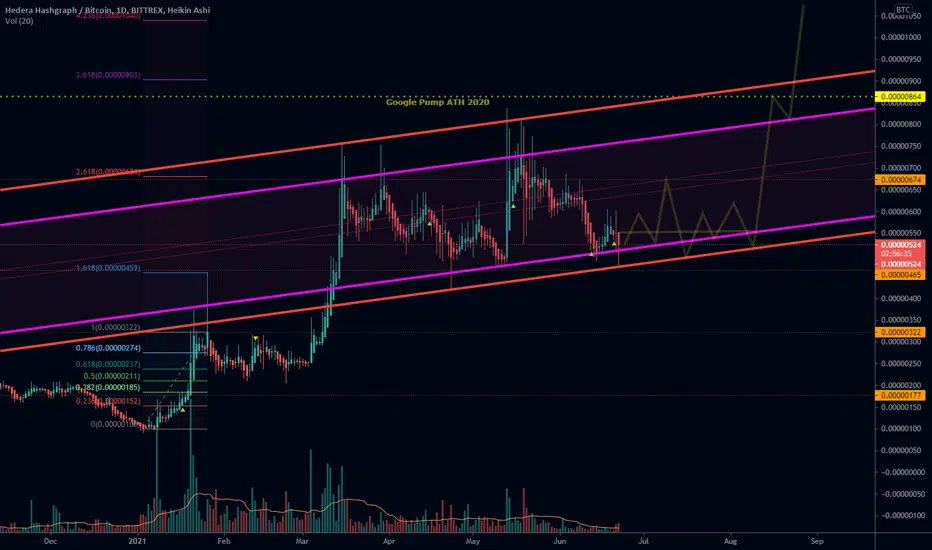
HBAR / BTC - Potential New Parallel UptrendHedera Hashgraph may be forming a new parallel uptrend on its way to test and/or break the ATH from 2020. This idea is in line with the Repeating Pattern idea, linked below.
We may follow a path something like what's shown within the inner and outer channels here. MACD for confluence that we might be at or near the bottom of the channel.
A break below the channel or below the red box from the Repeating Pattern chart (below) could invalidate both:
Hbar update 002…I am aware about my writing skills but I prioritise here information rather than oratory..
... current south movement is nothing else like correlation of the coin with rest of the market. While all the other ones are losing vs BTC for some reason Hbar is defending 500. I'm looking at correlation with ADA NANO and WAVES. All three of them are depreciate vs BTC much faster than the Hbar do which could bring the value lower. The market cap of Hedera now I am writing is 1.47 bln. I suspect for price of BTC to be slashed by another 50% and hopefully the Hbar vs BTC will drop to 250(the rectangle on the bottom of the chart possible demand area). If somehow this scenario will be fulfilled the market cap should be 4 times lower which gives a lot of space for further grow and possible solid profit. There are loads of talk about Hashgraph I think I saw somewhere that it reached 2bln transactions and it is involved in creating the digital fiat currency/ies.
...I am not sure if I mentioned it before if so, I would repeat myself. Currently cybersecurity is growing market same as AI nanotechnology and quantum computing and if by any chance, there will be some security issues (hacking etc) with BTC or other cryptos. Hbar will have its time to proof its usability. There is nothing in this world which is stable and can not be broken whatever ppl believe or the creator will say. It may sound like betting on the black swan but if U think about it BTC is a black swan on its own. The book written by Nassim Nicholas Taleb – The black swan is very good book about it.
If U will consider boom of BTC and crypto itself as The black swan U can as well expect that BTC will show some kind of security vulnerable which are not visible at current time. Information like this would most likely shake the crypto.
Any type of activity investing building farming etc is governed by the same rule. People will always move towards the most profitable most practical and safe environment they can afford. The moment when something which is stable and future proof will show some signs of weakness it will be natural for ppl to look for alternative. Also, the small thought of mine not every good idea will be applied to the market sometimes is the worst one like choice of VHS for video recording or electric cars. The moment any project is heavy funded by government it is most likely to thrive in near future.
If U believe in the project and see it as future do not have negative emotions when the price will go lower. I see it as the gift because I think if this will explode there will not be another opportunity to enter with potential of tenfold or more in profit...

Hbar possible another entry when BTC will drop to 16k
Based on my previous ideas I'm patiently wanting for another solid drop of BTC. Hbar price in USD is 16c while I am writing. HBAR/BTC is holding 500 and it can stay like this for some time I assume. I would not be surprised when it would actually go above 600 and further.
I see potential for price to drop below 10c or maybe below 5c, which would be great opportunity to go long here.
Last week USD got stronger DJI went down and didn't breach 35k number.
Stronger dollar DJI going south is good indication that BTC price will go down soon.

HBAR / BTC - Weekly needs to close above 520-30sNeed to see weekly close above the green box here, better yet the X, for us to remain bullish. We don't want to see it close below the green box or get back inside of our channel from the bull flag we previously broke out of.
Here's what I'm hoping for, regarding the bullish scenario - it looks like we were about to begin wave 5 (not just with HBAR, but with a lot of cryptos in the market, including BTC), and then corrected hard. This could be a strong attempt to get in lower before that wave 5 happens. That said, if we close much lower than where we are now, we could see more bearish or even sideways movement for months.
Let's see where today's weekly closes in approx 9 hours from now, and will update.

HBAR / BTC - Ready for the Next Move UpOur trend line has acted as a pivot for the last 3 moves, each time we found a bottom, twice, which ended near the trend line, and followed with a significant move up. Assuming this occurs again and we don't break below the trend line, we can expect a move to ~1000 sats, possibly as high as 1125.
Close below the trend line on the daily invalidates the trade. Possible outcomes of a break below the trend line are:
- repeating pattern idea:
- triple bottom vs. btc (or a giant HSi may form)
Chart from this post is Heiken Ashi daily chart, levels were drawn using multiple time-frames, main trend line is drawn from daily candlestick. Targets are chosen via double bottom projection and fibs.
2 Hour Candlestick Chart zoomed in:
Daily Candlestick Chart, also zoomed in:

Hedera finally the real blockchain for real world… few words from person which is watching this market for over 5 years and looking for long term patterns based on fundamentals and utility not the promises of the founders.
I am not going to put any technical tools as they are useless when chart is couple of months old. Technicals are using in grown and harmonic markets.
In 2016 when I got interested in blockchain related topics I found that Ethereum real feature which can be used in near future. There were many ppl teachings how to program smart contracts it really looked like future of payment, electric cars’ payments electric bills etc.
All governed by blockchain which should work perfectly.
There were many projects like ETH lottery etc.
We have mid of 2021 and nothing like this happen. There is a plenty of promises made but nothing really happened. There is no popular eth lottery as far as I am concerned. Eth in current stage is too expensive and slow. I heard rumour that Visa will be using eth blockchain.
Waiting few hours for transaction to went through the network and see like 10% charge for payment is scenario I would expect in current stage of development.
…Friend is telling me from time to time about new crypto coins and it was some time ago he mentioned Hbar. Most of the coins he mentioned never got my interests but this one is a totally different story.
The conclusion I made was that it is quite possible that are witnessing time loop or back in time scenario.
What I mean by Time loop:
Hedera with its possibilities (fast the best security possible and normal price for transaction) sounds very promising like ETH in 2016 but with difference in terms of technology and blockchain awareness.
Like most projects it is backed up by big companies/corporations. When you scroll the list of them you will notice serious companies which to me are in the top in terms of future technologies. These are IBM Google and Boeing.
For time being the coin is on the market for couple of months and it should take 2 years and half to see couple of hundreds spike in value if we will witness same scenario as ETH price surge.
In my opinion it will be 1 year to see some serious movement, also I am looking at Hbar not as the coin to make transactions but rather different form of stocks and the price of Hbar will represent the company itself.
There is no way for me to know the future and current time, but at the same time it is rare to see investing opportunity with such enormous possibility to take big market share.
Scenario here may look like Amazon in 2001 which survived dot com bubble implemented cloud computing and well 20 years later, it is on the top of the market globally.
The founder of the Hedera mentioned in one of his presentation at least once that real project will proof its value when crisis strikes.
I see it as long-term investment and with current market scenario I would slowly buy while price will be going down. It is highly probable that this coin will go up and when it will be in news and forums under the same old phrase
…If you would invest in hedera in 2021 you would be millionaire by now.

LONG HBAR/USDTWhat Is Hedera Hashgraph (HBAR) ?
Billed as the "trust layer of the internet," Hedera Hashgraph is a public network that allows individuals and businesses to create powerful decentralized applications (DApps).
It is designed to be a fairer, more efficient system that eliminates some of the limitations that older blockchain-based platforms face — such as slow performance and instability.
It was funded through an initial coin offering (ICO) in August 2018 and first launched open access to its mainnet just over a year later in September 2019. As part of the ICO, investors were able to purchase the platform’s native utility token (HBAR) at the lowest possible pricing.
The HBAR token has a dual role within the Hedera public network.
First and foremost, HBAR the fuel that powers Hedera services, such as smart contracts, file storage and regular transactions. Second, it's used to help secure the network, since HBAR users can stake their tokens to assist with maintaining the integrity of the platform.
