A long way for #Hellofuture (hbar)Hbar is the future. Its a new generation of blockchain, its a graph. This is something different and a lot of people cant understand it.. we'll have our pump, it will push higher, its about time.
HBARUSD

HBARUSDT , Are you in position for 2nd target ?Hello guys
Be in position and patient traders
According to our last analysis about HBAR the price fall down because of market condition and in our buy zone area in 4h and 1h time frame we had a signal ( we had hammer ) that show us the price is ready to go up and we can take in position and buy until the target reach , and now our 1st tp reached and we are ready for the 2nd Target .
Previous analysis :
Dont forget use stop loss and money management
Good Luck
Abtin

$HBAR, Trying to go for a break above ~.4$ $HBAR
Trying to go for a break above ~.4$ (highest level since September)
UCTS signalling the 1D Buy signal..
Looking for a flip at current breakout retest on the 12H as signal of continuation
#HBAR
Hedera HasgraphHbar breakout a symmetrical triangle. I like the big volume. It might be wise to wait for the retest support line but I don’t know if that will happen. I already jumped into a trade.

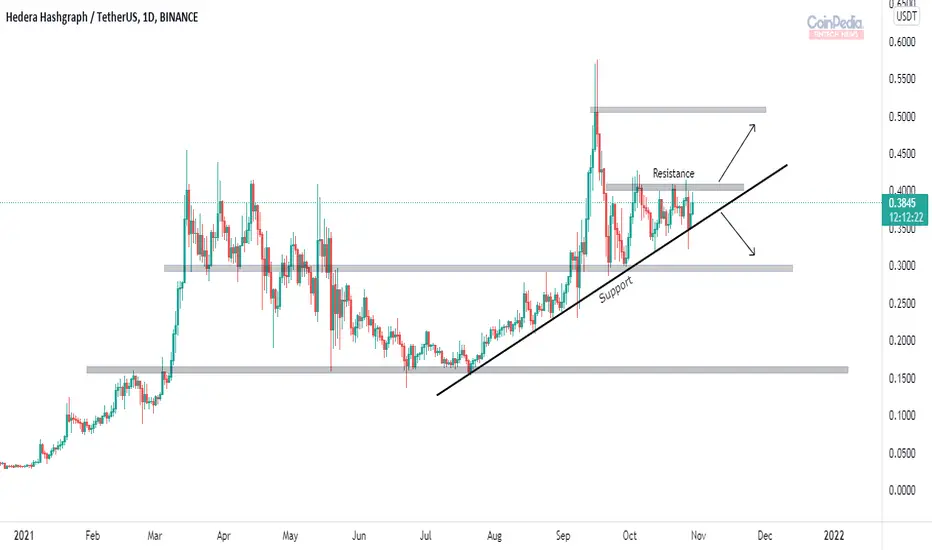
HBAR heading towards it's ATH* HBAR is in proper uptrend with respecting the below trendline as it's support.
* HBAR has a important support around $0.3 and facing resistance around $0.41, if the price breaks the trendline support we can see a drop till $0.3.
* To continue the trend HBAR needs to break above the resistance of $0.41.
HBAR/USD - Preparing the fireworks... can it breakout? 😎HBAR looks very juicy, particularly on the BTC pair. On the USD pair here, you can see that price is compressing in the blue apex.
Soon we should get some fireworks. Bias is we will pump as the whole market is bullish right now.
Bias is somewhat bullish and has good potential. First we got to break the resistance, then we will fly.
As such, keep your eyes on this as it may get spicy soon.
Like and follow if you liked my idea!

HBARUSDT , Are you ready to buy with x12 R/r ??? :D :D Abtin00Hello everyone
In this chart , at first we should say we have amazing coin with powerful fundamental and in technical view we need to wait for a little correction then we can take in position buy we can buy at these price , the first target is nice but the second one is amazing with x12 ( amaze R/r ) , dont forget use stop loss and attention to money management
Please manage your PORTFOLIO and then buy new coin , if you cant manage it send messages to us , and our team do this for you
Be with us and sleep comfortably
Good Luck
Abtin

3rd times the charm? #HBAR $HBARWe have been making higher highs and higher lows for some time now. We have broken out of the wedge but we must also break out of the ascending wedge on the 4h (must move past the 3rd flag). If we break the ascending channel and back test successfully, I will be buying in more. If we reject, I have a buy order at .36c - .37c as we land on the support at the bottom of the ascending channel. Good luck.

HBAR Short and Medium term price targetsSmall cup & handle showing good progress to near term target of 0.4135, larger symmetric triangle breaking out - forecasting a 0.50 price target within 7 days validated by 1.68 fib golden pocket.
NFA
DYOR
TA enthusiast taking a stab at it - nothing more ;)

Long#HBAR
#HBARUSDT
Spot( Midterm)🌟
Enter :0.36,0.33
Target : 0.39$
Target : 0.42$
Target : 0.45$
Stop loss : 0.32$
Daily Close In 0.32

hbar/usdTesting/tracking elliot wave theory. Please do not trade off idea without S/L. Not financial advice.

Lets seach some crypto 3!!Flag at 40% projection, high volume, safe buy trigger at 0.433, risky trigger at 0.397 in 4h time for few days.
Tec. Explanation: flags when top line breaks usualy double his size.
Strategy: Stoploss at 0.358 sell point at 0.5 and 0.55

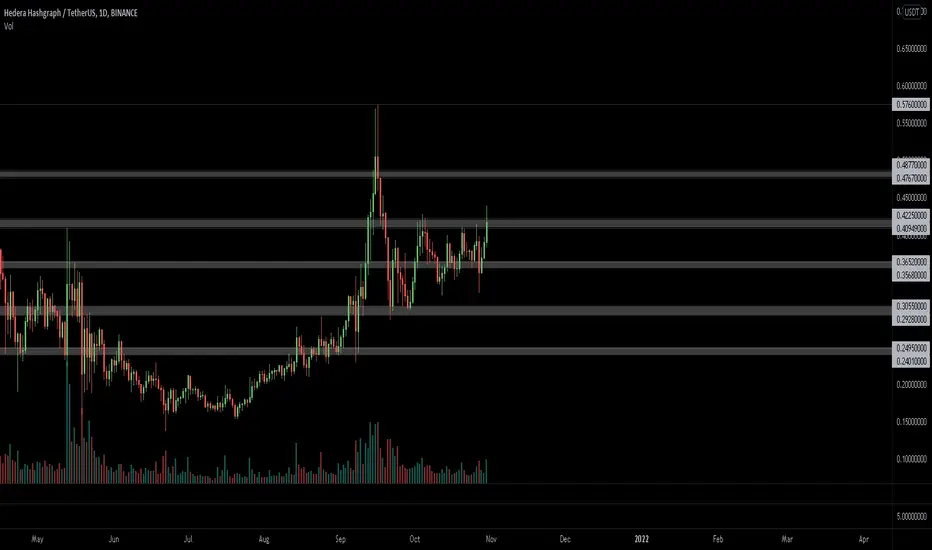
very critical level for HBAR to skyrocket If it passes 0.40 resistence level ıt will go up shortly to 0,5
it tested 3 times before. right now MACD and RSI both signal upwards
NOT FINANCIAL ADVISE

THE UNBREAKABLE 0.40$0.4 is very strong resistance we can not break it, if we do it will go up to 0.55$
Lets Wait and see

hbar can run uphbar have a long opportunitty
we broke the first trend line and we are on the way of breaking secound one
we have EMA 50 and EMA 200 in the way
if we pass the above we can have long by the entry 0.3473 to the next huge ressisstance at 1943

50%+ for HBAR if price break up in next daysYOUR LIKE OR COMMENT IS MY FUEL FOR NEXT ANALYSIS :) IF U HAVE ANY QUESTION REACH ME HERE
This is not a financial advice. Always do your own research and always put stoploss in your trade (SL) :) If you want more detailed info how to study and read charts or just need help with some coin, just write to me here a comment, i will try to answer to everybody... i can help you :) all for free, don't worry, BE HAPPY!

HBARUSDT Short Term Setup!HBARUSDT (30M Chart) Technical analysis
HBAR/USDT (30M Chart) Currently trading at $0.3484
head and Shoulder Pattern
Long Entry: above $0.3434
Stop loss : $0.3184
Target 1 : $0.358
Target 2 : $0.373
Target 3 : $0.390
Max leverage : 3x
Always keep stop loss

HBARUSDT Head and Shoulder PatternHBARUSDT (1h Chart) Technical analysis
HBAR/USDT(1h Chart) Currently trading at $0.346
Buy level : Above $0.343
Stop loss: Below $0.318
TP1: $0.364
TP2: $0.381
TP3: $0.396
TP4: $0.411
Max Leverage 3x
Always keep Stop loss
Follow Our Tradingview Account for More Technical Analysis Updates, | Like, Share and Comment Your thoughts.

HBAR - if you are bearish when you see this - you're dumb.HBAR will fly, technically, fundamentally, and because I had invested. :D

HBAR/USDT Scalping trade#HBAR/USDT Scalping Update:-
Entry 1:- $0.3327
Entry 2:- $0.314
Targets:- $0.3528/$0.3720/$0.40/$0.422
Stop Loss:- $0.286

Hedera Hashgraph (HBAR) Rejects Hard Off All Time High-HBAR has fallen nearly -50% over the last week
-Price has formed a descending channel
-15 MA continues to act as resistance
Hedera Hashgraph (HBAR) had outperformed the overall crypto market the week before last as prices have rose nearly 100% from $0.24 to $0.49. HBAR refers to itself as the “trust layer of the internet”. Hedera Hashgraph is a public network that allows individuals and businesses to create powerful decentralized applications (Dapps). HBAR has been growing in popularity & market cap rankings over the last few months as its the 45th largest cryptocurrency. HBAR was designed to be a fairer, more efficient system that eliminates the limitations that older blockchains face.
As we can see on the chart, HBAR blasted to a new all time high just about a week ago as prices hit $0.57. Right around this time was also when BTC started to lose its steam as showed bearish signs. Since then, the entire market has went through a decent size correction as most coins are down over -10%. At the time of writing, HBAR just wicked off a major support level along with a near month long support trend. If bears continue to assert their dominance & pull HBAR below these marks, expect price to land near the $0.25 level.
If bulls regain their strength quickly & pull HBAR back above its minor resistance of $0.306, we can expect a revival to occur. Ever since the high was set on HBAR, prices have been downtrending & have formed a descending channel. HBAR just bounced off the bottom trend of this channel & should now make its way to the top trend. If bulls show their strength & break and hold the major resistance of $0.333 we can then say the downtrend has been broken. Along with this resistance lies the 15 MA which has been acting as a rejection area. Price must fully break & hold this as well to have a chance at revival.
While looking at this Stochastic RSI, we can see strength just spent a lot of time within the oversold region. Since then, strength bounced towards the 50 value & attempted to break it but failed to do so. As long as the stochastic holds the 20 value, we should see a revival occur. The MACD has been downtrending for nearly a week now & the histogram looks ready to tick green. If the MA’s cross bullish, expect HBAR to break its downtrend channel.
HBAR Intraday Analysis
Spot rate: $0.30
Trend: Bearish
Volatility: Medium
Support: $0.283
Resistance: $0.306

HBARUSDT Look Bullish!HBARUSDT (Day Chart) Technical analysis
HBAR/USDT (Day Chart) Currently trading at $0.346
Buy level : Above $0.310
Stop loss: $0.270
TP1: $0.39
TP2: $0.43
TP3: $0.50
TP 4: $0.57
Max Leverage: 2x or buy it on spot market
Always Keep Stop loss

long $HBARgood place to long $HBAR. l1 with good potential. set a progressive stop under the most recent lows
