Hbar Decision time #Hbar is in higher high higher low trend. This trend will break if Hbar breaks the red trendline and price will go down to black lines.
If Hbar breake green trendline then it will pump again.
High chance for red trendline breakdown.
HBARUSD

HBAR setting up for a huge move north.HBAR has been playing the rollercoaster game lately - up, down, up, down, up, down.. ect. If the current momentum continues I fully expect HBAR to break out of the descending wedge pattern to the upside in the coming days.

HBAR is stable in support zoneHBAR hashgraph currency analysis
In this analysis, the important support areas namely 0.055, 0.051 and 0.046 were determined and we have different reactions on each of them.
In the first support zone, it is possible to return to the resistance of 0.062, but in the second zone, 0.051 Yen, this zone is probably not very valid and will break, but it is one of the important zones that has been able to turn the trend upwards three times in the past, and also in the third zone. Support means 0.046, which can be very important, so keep it in mind.
On the other hand, for the resistance areas, the first area that we mentioned is 0.0652 and the next area is at 0.068, where the price can even be at the level of a pullback (if the trend is completely upward) and we can consider correction from these areas.

HBARUSDTBINANCE:HBARUSDT SHORT IDEA
⚠️Note:
In this type of signals, only the entry point and trade direction are specified, and stop loss and target are not determined.
If you are interested in entering these signals, please provide a stop loss and a logical market-based target.
⛔"Daily crypto market analyses I provide are personal opinions & not financial advice. Trading carries risks, so do your own research & seek advisor's help.#DYOR"
Don't forget to like and comment

🪜CLIMB THE LADDER OF HEAVEN WITH HBAR 🪜HBAR is looking to move to .06329 USD for a new local high
There are some importan Fib levels in this area from the trip down
It look like some trend lines that were holding us down have also been peirced
HABR is Jacobs Ladder
The Hash is THE Ladder
Use your Hedera and Have the Heavens
🪜CLIMB THE LADDER OF HEAVEN WITH HBAR 🪜

This currency is a bird! Learn to flyAfter exiting its downward channel, HBAR currency can be said to have formed a corner pattern, so there is a possibility of growth of up to 62% for this currency.
Two support ranges have been specified for this currency, one range is for daily time and the other is for 4-hour time.
Safe entry for this currency is after breaking the green range

Whether it can rise above 0.0731 is the keyHello?
Traders, welcome.
If you "Follow", you can always get new information quickly.
Please also click "Boost".
Have a good day.
-------------------------------------
(HBARUSDT 1M Chart)
The question is whether it can rise above 0.0731.
(1W chart)
If price holds above 0.0731, it will enter a sharp volatility zone with few support and resistance zones.
Therefore, the key is whether it can receive support around 0.0613 and rise.
(1D chart)
Whatever the picture, the full-fledged rise is expected to begin when it rises above 0.1037.
Therefore, it is important to check the support around 0.0613-0.0731.
-------------------------------------------------- -------------------------------------------
** All descriptions are for reference only and do not guarantee profit or loss in investment.
** The trading volume indicator is displayed as a candle body based on 10EMA.
Display method (in order of boldest)
More than 3x 10EMA trading volume > 2.5x > 2.0x > 1.25x > trading volume below 10EMA
** Even if you know other people's know-how, it takes a considerable period of time to make it your own.
** This is a chart created with my know-how.
---------------------------------

about timewe could see a push to .074-.077
we may even push to .09 before seeing a pull back, but most will take profit at the .074-.077
preparing for a nice cup of tea with the cup and handle pattern.
lets watch and keep an eye on it.
good luck and have fun with it

HBARUSDTBINANCE:HBARUSDT SHORT
⚠️Note:
In this type of signals, only the entry point and trade direction are specified, and stop loss and target are not determined.
If you are interested in entering these signals, please provide a stop loss and a logical market-based target.
⛔"Daily crypto market analyses I provide are personal opinions & not financial advice. Trading carries risks, so do your own research & seek advisor's help.#DYOR"
Don't forget to like and comment

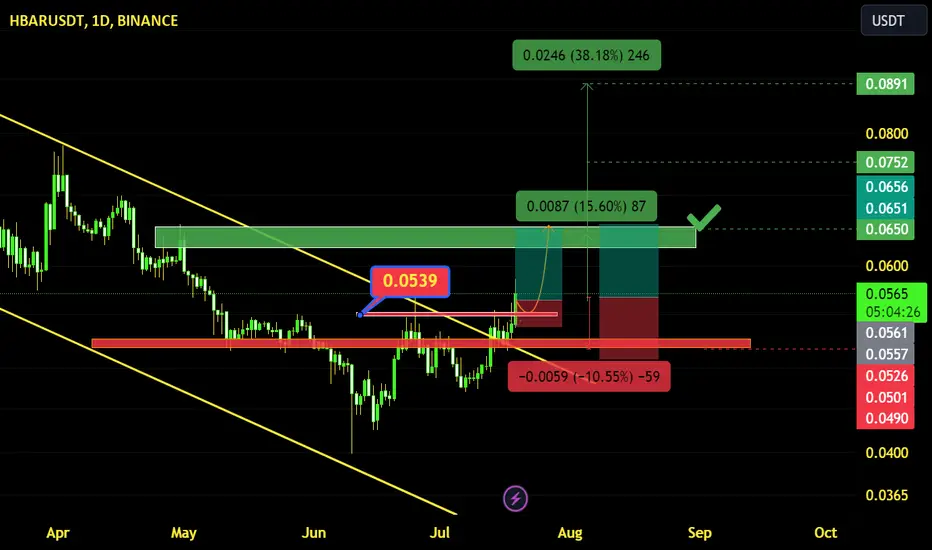
HBARUSD Textbook Channel Up pull-back. Buy above Resistance.Hedera (HBARUSD) hit today the top of its 3 month Channel Up. Such Higher Highs have called within this pattern for a pull-back to the 1D MA50 (blue trend-line) for the most optimal buy entry. If a 1D candle closes above Resistance 1 (0.07000) before such pull-back, we will have a new pattern emerging and we will buy the break-out, targeting Resistance 2 at 0.077950.
-------------------------------------------------------------------------------
** Please LIKE 👍, FOLLOW ✅, SHARE 🙌 and COMMENT ✍ if you enjoy this idea! Also share your ideas and charts in the comments section below! **
-------------------------------------------------------------------------------
💸💸💸💸💸💸
👇 👇 👇 👇 👇 👇

HEDERA HBAR price tries to change the trend to growthThe HBARUSDT price is trying to break through and gain a foothold above the strong mirror level of $0.58.
If buyers manage to do this, the next HBAR price target will likely be $0.75.
Then, a retest of $0.58. If the HEDERA token price doesn't drop lower, great.
You can buy HBAR in your investment portfolio with a clear conscience and wait for it to grow to at least $1.70
_____________________
Did you like our analysis? Leave a comment, like, and follow to get more

HBARUSD ❕ divergencePrice and RSI chart started to form a divergence (4H TF)
The asset broke down 50EMA (1H TF)
I believe that HBAR has started a correction.

Remains Bullish Above the WedgeHBAR will remain bullish as long as it remains above the wedge it broke out of. This is a re-draw of the previously posted wedge that I think makes a bit more sense.
Should it stop moving down anywhere above or within the green box, I'll expect it to continue up towards targets marked on the chart above - TP 1 and 2.

HBAR and the potential opportunity Hi Everyone;
today we have one of the best risk to reward Investment opportunity
it is almost 400 time the risk and the chart is look very promising.
I expect breaking the previous bear market key point will clear the way to the final target.
good luck everyone.

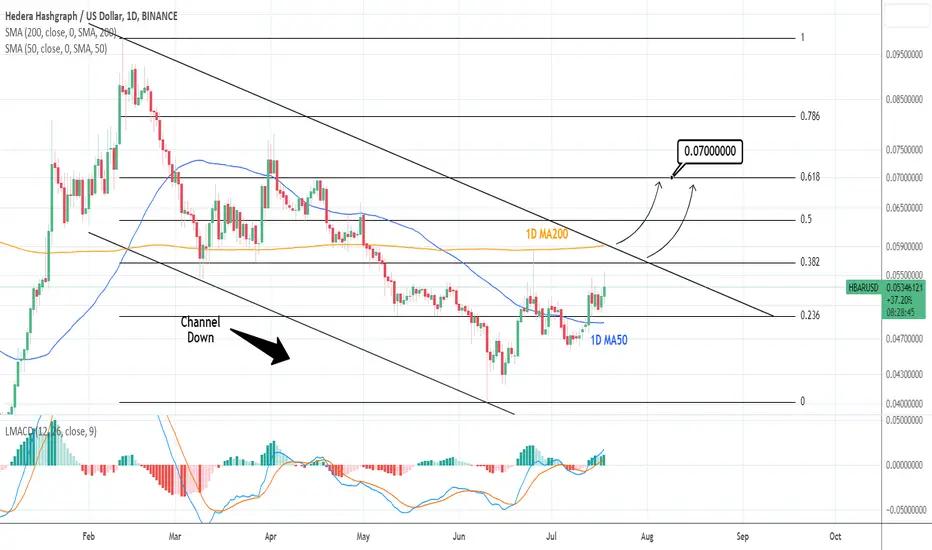
HBARUSD: Is ahead of a big long term bullish breakout.HBARUSD is above its 1D MA50 but still inside the February Channel Down, restrained under the 1D MA200 but with the 1D technicals bullish (RSI = 62.752, MACD = 0.001, ADX = 27.218). The 1D MA200 has been unbroken since May 2nd so it is our technical trigger. A cross over it, will be a buy entry, targeting the 0.618 Fibonacci level (TP = 0.0700). An early bullish indication comes from the 1D MACD, which is turning upwards in contrast with the sequence on the last bullish leg that turned downwards on April 17th.
## If you like our free content follow our profile to get more daily ideas. ##
## Comments and likes are greatly appreciated. ##
Possible Dips before a Move UpThis is a 4h view of the daily chart, which has already broken out of a falling wedge. That breakout has created a smaller falling wedge as it has re-tested the top of the daily wedge multiple times since breaking above it.
Following its initial breakout, it formed and inverted head and shoulders, and looked ready for a bullish move up. That pattern failed and we've since moved down to the failed HSi's TP1.
From here, if there are any further dips and we don't just break out of the smaller wedge, I expect we'll do something like what is shown above:
Option 1 - A symmetrical right shoulder that drops down to around 4.5 cents and then moves up
Option 2 - Continuation of the inverted HS and a move down to its TP 2, for a final re-test at the top of the daily wedge, and then a move up
Here's a zoom out to the daily chart and the larger wedge break:
See related idea in the link below.

Modified Schiff Pitchfork on Full Chart HistoryAn example of how a modified Schiff Pitchfork, with lines extended, can be used to ascertain trend and various trend levels for the full chart history of BINANCE:HBARUSD
Pitchforks can be extended to detect new bottoms and tops as well:

Trade Alert - Long Hedera HashgraphI know, I know. Very last post. The title of my video, “Now is not the time to be buying altcoins”. And I do stand by that statement for the most part. Because for the most part many of the larger cap alts (which is mainly what I trade in a bear market) do employ a variant of the PoS mechanism. And this is really what the SEC has been targeting at the moment, minus Ethereum for some unknown reason. Hedera is not a traditional blockchain and does not use either PoW or PoS. Hedera Hashgraph is a distributed ledger technology that aims to provide a secure, fast, and fair platform for decentralized applications. To accomplish this, Hedera Hashgraph employs a consensus algorithm called "hashgraph." This algorithm enables high transaction throughput by leveraging a directed acyclic graph (DAG) structure, where each transaction is represented as an event. These events are then asynchronously gossiped among network nodes, forming a shared history of all transactions. By utilizing a gossip protocol and virtual voting, hashgraph achieves consensus on the order and validity of transactions. Moreover, Hedera Hashgraph incorporates a governance model to ensure decentralization and fair decision-making. The technology offers potential benefits for applications requiring speed, security, and scalability, such as decentralized finance, supply chain management, and social networks.
Now, that I have touched a bit on the fundamentals in hopes of helping to justify my trade :-) let’s quickly look at the technicals.
Hedera has reached the end of a bullish descending wedge which also runs into some very solid support at .044. Should this break then, yes, we’ll probably drop down to that next level at .036. But odds are in our favor here that we go up instead. I’ll be shooting for that 200 day ma which, right now, sits at .058. My stop out will be right around .0415.
Let’s go!
Stew

Previous Pattern Targets vs. Possible Path Back to Top or BottomHBAR made two major wedge patterns that hit pattern targets with incredible accuracy.
First - a bullish wedge exit that led to a 3x measured move up and a final wick up that ultimately stopped approx. halfway between 3.5x and 4x.
Second - a bearish wedge exit that has so far reached a 2x measured move down from where it exited.
Let's see if it makes a 3rd wedge that, when exited in either direction, may revisit weekly top or hit all-time low on a 2x measured move in either scenario; potentially creating a double-top or a double-bottom at its completion.

HBARUSD ❕ descending trendThe rebound has already been worked off and the price has not formed any reversal patterns.
On the main timeframes, the chart is under the 50 and 200 EMAs.
The RSI indicator is also signaling a continuation of the downward movement.
I believe that the asset will continue to decline.

Bad news for HBAR (1W)Hi, dear traders. how are you ? Today we have a viewpoint to SELL/SHORT the HBAR symbol.
For risk management, please don't forget stop loss and capital management
When we reach the first target, save some profit and then change the stop to entry
Comment if you have any questions
Thank You

HBAR Hedera Hashgraph HBAR is slowly building up strengthening RSI above 50 and Impulse MACD line just about to cross the Signal line usually this means bullish and rising but it's slow moving today with Bitcoin undecided so whatever happens want come quickly :) but at least it's shaping up nicely.
