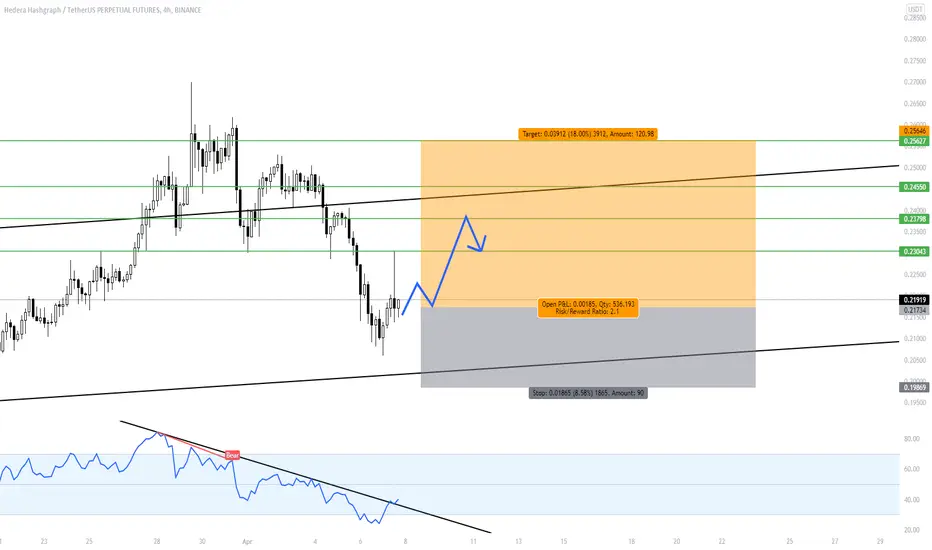
HBAR BULLISH SIGNAL!!!Hedera Hashgraph has signaled a bullish reversal.
Taking a look at the MACD in relation to price, there is a clear bullish divergence (illustrated on chart).
This is confirmed by the bullish crossing of the fast and slow EMA's (illustrated in circle).
Lastly, HBAR is under value (illustrated by white line). This means we can expect HBAR to rise to at-least the AVL which is sitting at around (0.22154).
These 3 signals serve as a good confirmation that HBAR is a good long position to take at this time.
If you like my post and find them useful, please 👍 & FOLLOW for more.
thanks 😁
HBARUSDT

HBAR trying to breakout & move up 4hrHBAR trying to breakout & move up on the 4hr.
Bullish harmonicss formed, RSI breaking out everything look perfect so far.
HBAR ON THE WAYHedera could reach to following targets in case of breaking R .
But as I always say : "Good setups can be found if you find them before others !" , so that's it , load zone is here !

EGLD - The Next Healthy Pump And Dump Using Fibonacci and harmonic patterns (and possibly some good luck) it's possible generally to predict future price action(depending on conditions-
The price action in this chart is entirely contingent on moves that BTC makes. iPhone eights closely at any Alt coin chart - BTC's signature is ever present.
In no way is this chart meant to be traded around. However it could be used as a reference to give you ideas.
* this chart will certainly be invalidated if BTC makes a significant move downward
Good luck and best regards

HBARHBAR, one of the top DEFI cryptocurrencies, which has strong fundamentals and partnerships with high-profile companies like Google. It's ready to explode at any moment. After an impulsive wave, we made a climax, leaving a graphic figure (Cup And handle). We just broke off the cup handle part. To confirm the bullish pivot, we have to break out of this resistance region of 0.43 cents. Possible targets are already entered in Fibo!

HBAR can reach 0.33$🌳HBAR was in a falling wedge pattern. This bullish pattern is already broken so this means it can increase further without any problems! The expected target is around 0.33$ which is also a resistance as well.
_ _ _ _ _ _ _ _ _ _ _ _ _ _ _ _ _ _ _ _ _ _ _ _ _ _ _ _ _ _ _ _ _
Thank you for seeing idea .
Have a nice day and Good luck

HBAR is Really good Altcoin to Buy...Hello friends...
hbar broke daily bear base and bear trend and now is bullish in Daily time frame.
there are several resistances as 3D bear base and curve trend.
i put a buy order where you see in the chart. R/R is 3.
please ask your questions in comments.

HBAR should bounceHBAR held decently its price against bear market and moved inside this rising channel. I think it will bounce on its lower channel's band. I drawn this channel days ago using the wicks of 24th January and 21st February, now price is bouncing perfectly on its band.
If you take a look at daily chart you can see a clear reversal which has been going on for multiple days, even with a better trajectory than 21st of July 2021.
From here there's a +120% potential profit until channel's upper band.
I based this TA on price action only and on HBAR trending on socials.
If you wanna enter, this is a good price.
Good luck

HBARUSDTSometimes I wonder life is just like a fibonacci sequence your past determining your future. 127 and 161 arefib numbers

HBAR 0.24 incoming, 180 day consolidation breakoutShort term cup and handle plus fib 1.68 clearly indicate a 0.24 target in the near term. Also note a breakout of the massive 6 month consolidation pennant, including a re-test on the "handle". Start of bull run for sure. Hedera hasn't announced any new GCM since Ubisoft in Feb so next joiner announcement imminent. Strong volume testing happening on testnet indicates potential STEP function may be coming soon. Within next few months target 0.80.
ĦODL. ĦODL. ĦODL.

HBAR massively weekly falling wedgeHBAR has corrected from its high forming a falling wedge reversal pattern on the weekly chart with higher volume weekly candles forming as its come into a weekly demand zone. Price respecting higher high and higher low bullish structure on HTF and in the low of the leg. Id expect to see a reversal to form in the coming weeks and believe this is a bottom forming and waiting for a breakout to the upside out of the wedge. MADC on weekly showing signs of bullish momentum coming into the market as histogram and MAs converge. Another bullish looking alt coin I believe and may go for the highs on the next move

Simple break here for HBAR/BTCSimple break here for HBAR/BTC
Within the next two days we will be through this resistance line. It doesn't have to go far at all for the price to go 10%. And guess what, bitcoin behaving, the price will go 10% as well.

Hedera falling wedge @ resistanceI always like to keep an eye on what the BTC pairings are doing. When you get a break and rally on a BTC pair it is often very well reflected in the respective USDT pair.
Im hoping to get a 10-20% day on HBAR/USDT soon

HBARUSDT Price Squeeze and BreakoutHBAR has been an asset that has been beaten down for awhile now. However, BTC and alts are looking good in general at the moment and I expect HBAR to do the same. Right now we see divergence in RSI and a price squeeze that has pushed the price up with the help of BTC (or the BTC LUNA purchased lol).
Tell me what you think?
Not financial advice. Do your own research.

Hedera (HBAR) - March 22Hello?
Traders, welcome.
If you "follow", you can always get new information quickly.
Please also click "Like".
Have a good day.
-------------------------------------
(HBARUSD 1W Chart)
(Full: )
The move is deviating from the previous trend, but if it finds support near the 0.20491984 point, I would expect it to move above the 0.29992521 point.
Resistance section: 0.36030279-0.39589452
Support section: around 0.12789479
-------------------------------------
(HBARUSDT 1D Chart)
-------------------------------------
(HBARBTC 1W chart)
0.0000 0313 - 0.0000 0398 or higher: expected to continue uptrend
If the price is maintained above the volume profile section formed in the section 0.0000 0398 - 0.0000 0523, it is expected to create a new wave.
------------------------------------------------------------ -----------------------------------------------------
** All indicators are lagging indicators.
Therefore, it is important to be aware that the indicator will move accordingly as price and volume move.
However, for the sake of convenience, we are talking in reverse for the interpretation of the indicator.
** The MRHAB-O and MRHAB-B indicators used in the chart are indicators of our channel that have not been released yet.
(Since it was not disclosed, you can use this chart without any restrictions by sharing this chart and copying and pasting the indicators.)
** The wRSI_SR indicator is an indicator created by adding settings and options to the existing Stochastic RSI indicator.
Therefore, the interpretation is the same as the traditional Stochastic RSI indicator. (K, D line -> R, S line)
** The OBV indicator was re-created by applying a formula to the DepthHouse Trading indicator, an indicator disclosed by oh92. (Thanks for this.)
** Support or resistance is based on the closing price of the 1D chart.
** All descriptions are for reference only and do not guarantee a profit or loss in investment.
(Short-term Stop Loss can be said to be a point where profit and loss can be preserved or additional entry can be made through split trading. It is a short-term investment perspective.)
---------------------------------

HBAR ( HEDERA HASHGRAPH ) LONGIf static support is not lost, the price can rise to the dynamic level
From $ 0.3 to $ 0.33
TIME : 1 days
BUY ZONE : 0.2~0.22
TAKE PROFIT : 0.31
STOP LOSS: 0.192

XRMUSDT 24HR WK #11 (ALT SECRET)XMR will continue to outperform the majority of altcoins.
#1 most altcoins are still +20% from 12/15/21
#2 XMR is still above the 50ema (thick purple)
To find out if your altcoin is worth a ish use this
total3 mkcap (minus btc and eth)
Is your alt trading lower than the total3?
Is your alt 50ema above, below, or indifferent to the total3 50ema
Is your alt moving with speed and conviction

$HBARPretty big trendline on HBAR. It'll move with BTC but we might see a break in it which I would be pretty bullish.

HBAR/BTC Bull Divergence + BUY+ HBAR/USDT Double Bottom
Stop / Loss VERY TIGHT as BTC is in a downtrend. Good buy for a few hours.

HBAR/USDThbar creating assending triangle pattern
bullish divergence
so i can expect bullish on hbar
buy at 0.2189
stoploss at 0.2108
target at 0.25
like my idea

Hedera (HBAR) - February 17Hello?
Traders, welcome.
If you "follow", you can always get new information quickly.
Please also click "Like".
Have a nice day.
-------------------------------------
(HBARUSD 1W Chart)
(Full: )
It must rise above the 0.2999 2521 point to turn into an uptrend.
Expect resistance in the range 0.3603 0279 - 0.3968 9452.
If it falls from 0.2049 1984 point, you need Stop Loss to preserve profit and loss.
-------------------------------------
(HBARBTC 1W chart)
0.0000 0398 - 0.0000 0523 or higher: Expected to create a new wave.
------------------------------------------
We recommend that you trade with your average unit price.
This is because, if the price is below your average unit price, whether the price trend is in an upward trend or a downward trend, there is a high possibility that you will not be able to get a big profit due to the psychological burden.
The center of all trading starts with the average unit price at which you start trading.
If you ignore this, you may be trading in the wrong direction.
Therefore, it is important to find a way to lower the average unit price and adjust the proportion of the investment, ultimately allowing the funds corresponding to the profits to be able to regenerate themselves.
------------------------------------------------------------ -----------------------------------------------------
** All indicators are lagging indicators.
Therefore, it is important to be aware that the indicator moves accordingly with the movement of price and volume.
However, for convenience, we are talking in reverse for the interpretation of the indicator.
** The MRHAB-O and MRHAB-B indicators used in the chart are indicators of our channel that have not been released yet.
(Since it was not disclosed, you can use this chart without any restrictions by sharing this chart and copying and pasting the indicators.)
** The wRSI_SR indicator is an indicator created by adding settings and options to the existing Stochastic RSI indicator.
Therefore, the interpretation is the same as the traditional Stochastic RSI indicator. (K, D line -> R, S line)
** The OBV indicator was re-created by applying a formula to the DepthHouse Trading indicator, an indicator disclosed by oh92. (Thanks for this.)
** Support or resistance is based on the closing price of the 1D chart.
** All descriptions are for reference only and do not guarantee a profit or loss in investment.
(Short-term Stop Loss can be said to be a point where profit and loss can be preserved or additional entry can be made through split trading. It is a short-term investment perspective.)
---------------------------------

HBAR: almost ready?Hedera is forming a falling wedge for half a year now.
The breakout is nearing and each day.
Hedera team is also working more on marketing strategies, releasing new advertising campaign around the world, starting with Denver airport.
Recently ubisoft joined hbar's governing council, this gave some boost to hbar price increasing its value.
That move took hbar out of the downtrend and it's now retesting the flipped resistance.
The falling wedge is close to the breakout and all the good news (not only for hbar but also for the crypto world) are coming togheter. This will make a "blow up" effect which will take the price to a breakout.
Thx for reading.
Here for you, as always, CryptoSoap!

HBARUSDT, It can make new LLHello everybody
One of the most popular and powerful project in crypto is hedera hashgraph, You must be asking yourself, Why ?? Because ...
If you want to learn Fundamental & Technical analysis send us messages in private ---> Our id is in profile
According to the chart and our previous serial analysis, after the price broke that trendline support zone area the price its be ready to fall down and make new LL and this scenario happend and after some pullback we were made new LL and now the kind of last cycle can be happend and what kind of root that we shown on chart can be happen and make new LL.
If you wanna entrance in position and make profit from this maybe drop price you should observe your capital and put your stop loss at the end of the higher shadow of HL a little upper and sit and only manage your position, because the trend do everything we wanna need . :D :D :D ;D
Good Luck
Abtin
Previous analysis :
