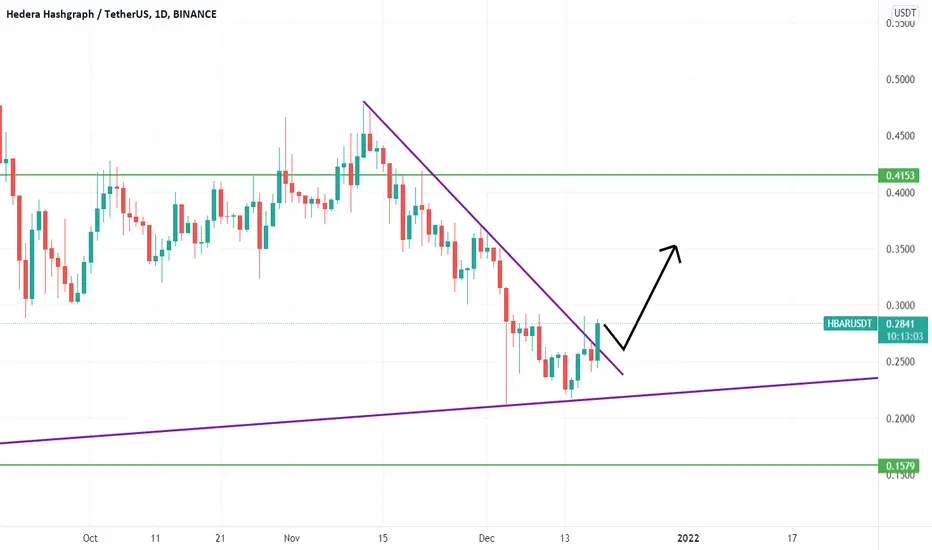
HBARUSDT: SYMMETRICAL TRIANGLE, HODL OPPORTUNITY AHEAD?Hello Enthusiast Coin Traders! Here's NEW POTENTIAL short-term outlook for HBARUSDT , Please give us the thumbs up and support the channel by Smashing the FOLLOW button :)
a) HBARUSDT is moving above the exponential moving average 200
b) Breakout of symmetrical pattern could indicate a continuation of bullish trend
c) MACD indicator has crossed above the zero level area, sign of potential stronger momentum going upward
The roadmap will be invalid after exceeding the support/target level
*DISCLAIMER:
This isn't a recommendation to buy or sell cryptocurrency, only an Outlook from technical perspective.
HBARUSDT

HBAR/USDT Chart If you follow, like and comment I would be grateful.
HBAR seems to be a really interesting investment right now. The coin just broke the 0.30$ resistance and is ready to a move towards 0.40$. The RSI on the daily and 4H chart is more bullish than bearish, considering the fact that BTC had a recent move to 51K and most alts are going up. I know that in this situations buying strenght is better than buying the coin that is going down, but coins like AVAX, LUNA, CRO and SOL already made their moves and will now suffer from a small correction before continuing their uptrend. The market looks good right now, and if I find any bearish signal on BTC that can cause a crash I will post an update . Merry Christmas and thanks!

ENJUSDT, We are in correction of our breakwaveHello everybody
According to the chart, the price was broke the trendline support and according to the trend of the price that is downward and we think the price is going up to have correction of this last movement of the breakwave and after that its ready to drop more according to the trend, the price can go above of the key point level that we shown on chart the price can move upwards and we update the chart that time, until now this analysis can be happen and we can buy in support zone area that we shown it .
Some of our previous analysis of HBAR :
Send us messages in private if you wanna buy trading package or want to be one of our VIP memebers
Good Luck
Abtin

Long HbarEverything is breaking up today, and BTC just out from his consolidation zone. As such, we will see an up from everything and that include HBAR.

HBAR LONG$hbar long bearish candle and 8hrs reject by .30 and market hold the 200ema if the rejected the market comes to .29 to .28 possible uptrend
WAIT FOR THE
MILANN SAMAROH 20EMA TO 200EMA BINANCE:HBARUSDTPERP

HBARUSDT - Trend Breakout + Head & Shoulder PatternHBARUSDT (4h Chart) Technical analysis
HBARUSDT (4h Chart) Currently trading at $0.285
Buy level :Above $0.293 (Buy after Breakout)
Stop loss: Below $0.239
TP1: $0.321
TP2: $0.362
TP3: $0.410
TP4: $0.474
Max Leverage 2x
Always keep Stop loss
Follow Our Tradingview Account for More Technical Analysis Updates, | Like, Share and Comment Your thoughts.

Hedera Hashgraph (HBAR) able to flip daily MA Ribbon?Hedera Hashgraph (HBAR) able to flip daily MA Ribbon?
The bounce of the RSI support seems quite strong - what do you think? 😎
Drop me a nice comment if you'd like me to analyze any other cryptocurrency or do another comparison.
*no financial advice
do your own research before investing

hbar / usdt daily chart long ideahbar / usdt daily chart long idea
descending trend line is broken...you can enter long position after retest or correction
HBAR/USDT looking very strong in the long runHighly likely that we have tested the bottom. Now it is time for a massive uptrend. At the very least we should test one of our resistance levels, but expecting price to go much much further up eventually.

HBARUSDT may retest the support and bounce back from here.HBARUSDT may retest the support and bounce back from here. It is a symmetrical triangle. Trying to retest the support zone again.
Thanks and happy trading

HBARHBAR looks similar to FET chart and getting ready for the breakout. I expect nothing less than ATH after this accumulation..
Enjoy!

HBAR updateHBAR DON'T BUY hbar in this time at this price
wait for few days then we can buy hbar at this price 0.17$
then we make good profit
because this time bitcoin not looking bullish .
so that's why i m telling don't buy this time
and don't trade in future because market not going with technically
This time market move accounting news I m also in lose this time


Hbar/btc looks strong! The hbar/btc pairing looks so good right now. Its holding the most important support.
If btc has stopped his bleeding we are probably ready to have some altseason gains.
Also the btc’s dominance is looking extremely bearish and ready to break the april/may ATL.
Come on hbar!!
Here for you, as always, CryptoSoaP!

HBAR LOOKING GOOD TO GO. GREAT PROJECT AND FUNDAMENTALSGreat project and fundamentals. Don't sleep on HBAR, price action is putting off retail investors but this is the trap. HBAR will move very fast.

HBARUSDTBreak down the main trend, wheater it should jump over white trendline or come back to support otherwise too risky to buy.
Looks like it needs more time to accumulate and recover to come back to the game. But if it will come over the white trendlines we can think about it again :)

Now is the time to buy back on HBARCheck this pullback price movement after it dropped. Inverted HNS pullback confirm. Position with managed risk. Not a financial advice.
#HBAR #Hedera #helloFuture

HBAR / USDRSI breakout in 3D, he break the falling wedge too.
next step ath or back to the previous support ?
I will wait until he retest the previous support or we miss the opportunity.

HBARUSDT- Broke out this resistance line currentlyBYBIT:HBARUSDT
4H trend chart
-
HBAR broke through the downtrend line so far on 4H chart.
If price can keep around here, trading strategy as below.
-
Profit Targets:
a) 0.3891----Fib(0.5)
b) 0.41----Fib(0.618)
c) 0.478----Fib(1)
Stop losses:
a) 0.3412-----Red horizontal ray
-
If you like this analysis, smash the "like button" and leave a comment below to share your thoughts
or let me know what crypto you want to see!
Trading is a reflection of yourself. Learn more daily and be ready for every opportunity.
Have a nice trading!

MY HBAR SHORT POSITION!!! Once price hits the 61.80% level i would opening my short position take profits target would be at the -61.80%. Lets get this profits Dawgs!

Analysis HBarDepending on the conditions, it is more likely to fall.
But the shape of the candlesticks should be checked every week. There is a possibility of regrowth. Although I do not think this is likely to happen.

HBAR usdt - Hedera to rise back into the 40's On the day chart we see hbar form a nice cup.
Expect to see the formation morph into an upturn into the .40c region again.
Good buying here!

#hbar Buy Setup Hbar / usdt
Type 👉 spot / future both
Direction long
0.32$
0.31$
Target
0.33$
0.34$
0.35$
0.36$
0.37$
Midterm
0.38$
0.40$
0.45$
Stop loss
0.29$🚫
