Smart Liquidity in TradingIntroduction: What Is Smart Liquidity in Trading?
Liquidity is the backbone of financial markets—it refers to how easily assets can be bought or sold without causing drastic price changes. But as markets have evolved with the rise of algorithmic trading, decentralized finance (DeFi), and AI, a more sophisticated concept has emerged: Smart Liquidity.
Smart Liquidity isn’t just about having buyers and sellers in a market. It’s about efficient, dynamic, and intelligent liquidity—where technology, data, and algorithms converge to improve how trades are executed, how markets function, and how risks are managed. Whether in traditional stock markets, forex, or blockchain-based platforms, smart liquidity is now central to modern trading strategies.
Chapter 1: Understanding Traditional Liquidity
Before diving into smart liquidity, let's revisit the basics of traditional liquidity:
Bid-Ask Spread: A narrow spread indicates high liquidity; a wide one shows low liquidity.
Market Depth: The volume of orders at different price levels.
Turnover Volume: How frequently assets are traded.
Price Impact: How much a large order moves the price.
In traditional finance, liquidity providers (LPs) include:
Market makers
Banks and financial institutions
High-frequency trading firms
Exchanges
Liquidity ensures:
Stable pricing
Smooth trade execution
Lower transaction costs
Chapter 2: The Evolution Toward Smart Liquidity
What Changed?
Algorithmic Trading: Algorithms can detect, provide, or withdraw liquidity in milliseconds.
Decentralized Finance (DeFi): Smart contracts offer on-chain liquidity pools without intermediaries.
AI & Machine Learning: Predictive models can identify where liquidity is needed or likely to shift.
Smart Order Routing (SOR): Optimizes trade execution by splitting orders across multiple venues.
These technologies gave rise to “smart liquidity,” where liquidity is not static but adaptive, context-aware, and real-time optimized.
Chapter 3: Components of Smart Liquidity
1. Liquidity Intelligence
Advanced analytics track:
Market depth across exchanges
Order flow trends
Latency and slippage statistics
Arbitrage opportunities
This helps institutions dynamically manage their liquidity strategies.
2. Smart Order Routing (SOR)
SOR systems:
Automatically split large orders across venues
Route based on fees, liquidity, latency, and execution quality
Reduce market impact and slippage
SOR is key in both equity and crypto markets.
3. Algorithmic Liquidity Providers
Market-making bots adjust quotes in real-time based on:
Volatility
News sentiment
Volume spikes
Risk exposure
They enhance liquidity without manual intervention.
4. Automated Market Makers (AMMs)
Used in DeFi:
No traditional order book
Prices determined algorithmically via a liquidity pool
Traders interact with pools, not people
Popular AMMs: Uniswap, Curve, Balancer.
Chapter 4: Use Cases of Smart Liquidity
1. HFT Firms and Institutions
Use predictive liquidity models
Deploy SOR to reduce costs and slippage
Balance exposure across markets
2. Retail Traders
Benefit from tighter spreads and faster execution
Use platforms with AI-driven order matching
3. Decentralized Finance (DeFi)
Anyone can provide liquidity and earn fees
Smart liquidity enables 24/7 trading with no intermediaries
New protocols optimize capital allocation via auto-rebalancing
4. Stablecoin & Forex Markets
Smart liquidity ensures 1:1 peg stability
Algorithms prevent arbitrage imbalances
Chapter 5: Key Metrics to Measure Smart Liquidity
Metric Description
Slippage Difference between expected and actual execution price
Spread Efficiency How close bid-ask spreads are to theoretical minimum
Fill Rate How much of an order is filled without delay or rerouting
Market Impact Price movement caused by a trade
Liquidity Utilization How efficiently capital is allocated across pairs/assets
Latency Time taken from order input to execution
These metrics help evaluate the quality of liquidity provided.
Chapter 6: Risks and Challenges of Smart Liquidity
Despite its benefits, smart liquidity isn’t perfect.
1. Flash Crashes
Caused by sudden withdrawal of liquidity bots
Example: 2010 Flash Crash in U.S. equities
2. Manipulation Risks
Predatory algorithms can spoof or bait other traders
"Liquidity mirages" trick algorithms
3. Smart Contract Failures (DeFi)
Vulnerabilities in AMMs can drain entire liquidity pools
Hacks like those on Curve and Poly Network show smart liquidity can be fragile
4. Impermanent Loss (DeFi)
LPs may lose value if asset prices diverge significantly
Complex math and simulations needed to manage it
5. Regulatory Uncertainty
Especially in crypto, regulators still debating on decentralized liquidity protocols
Conclusion
Smart liquidity represents the next evolution of market infrastructure. It's not just about having capital in the market—it's about how that capital moves, adapts, and executes.
From hedge funds deploying intelligent routing systems to DeFi users earning yields through AMMs, smart liquidity touches every corner of modern finance. As technology continues to mature, expect liquidity to become even more predictive, responsive, and intelligent—unlocking a new level of speed, precision, and access for traders around the world.
HDFCBANK
Risk Management in Options TradingTrading options can be exciting and rewarding—but it's also full of risks. Without proper risk management, even the best strategies can lead to heavy losses. In this comprehensive guide, we'll dive deep into how to manage risk in options trading, covering everything from the basics to advanced techniques.
1. Understanding Risk in Options Trading
Before we dive into managing risk, it’s crucial to understand where risk comes from in options trading. Options are complex instruments that behave differently than stocks. The key sources of risk include:
A. Price Movement (Delta Risk)
When the price of the underlying stock moves up or down, the value of the option changes. This is known as Delta risk. A call option gains value when the stock goes up, and a put gains value when it goes down.
B. Time Decay (Theta Risk)
Options lose value over time. Even if the stock price doesn’t move, the option could still lose value as the expiration date approaches. This is known as Theta decay or time decay.
C. Volatility (Vega Risk)
Volatility reflects how much a stock moves. High volatility increases an option's premium. But if implied volatility falls, the value of your option might drop—even if your price prediction is correct.
D. Interest Rates and Dividends (Rho and Dividend Risk)
Although less impactful, interest rates and dividend changes can also influence option prices. These are more important for longer-dated options.
2. Why Is Risk Management Critical in Options?
Options give traders leverage—a small investment can control a large position. While this magnifies profits, it also increases losses. Many beginners fall into the trap of chasing big gains, only to blow up their accounts when trades go wrong.
Good risk management doesn’t eliminate risk—it helps you survive bad trades and stay in the game long enough for your edge to work.
3. Core Principles of Options Risk Management
Here are the foundational principles every options trader should follow:
A. Never Risk More Than You Can Afford to Lose
It sounds obvious, but many traders ignore this. Only use disposable capital, not money meant for rent, bills, or emergencies.
B. Position Sizing
This is one of the most powerful tools in risk management. Don’t bet your entire capital on a single trade. A common rule is to risk 1-2% of your capital on any trade. That way, even a string of losing trades won’t wipe you out.
C. Diversify Your Trades
Avoid putting all your trades on the same stock or sector. Diversification can reduce risk from unexpected news events or market shocks.
D. Know Your Maximum Loss
Before entering any trade, calculate your maximum potential loss. With long calls and puts, your loss is limited to the premium paid. But with short options or complex strategies like spreads, losses can be higher or even unlimited.
4. Practical Risk Management Techniques
A. Use Stop-Loss Orders (Where Applicable)
While options don’t always behave like stocks, you can still set a mental or physical stop-loss based on:
Percentage loss (e.g., exit if the option loses 50%)
Underlying price level (e.g., exit if stock breaks below a key level)
Time decay (e.g., exit 5 days before expiration to avoid Theta crush)
❗ Note: Stop-losses can be tricky with options because of wide bid-ask spreads. It’s important to use limit orders or mental stops to avoid slippage.
B. Avoid Naked Options (Especially Selling)
Selling naked calls or puts can expose you to unlimited risk. Unless you have a large account and full understanding, stick to defined-risk strategies like:
Spreads (credit/debit)
Iron condors
Butterflies
Covered calls
Protective puts
C. Hedge Your Positions
Hedging is like buying insurance. You can reduce risk by combining options in a way that limits losses.
Example:
If you sell a naked put, you can turn it into a bull put spread by buying a lower strike put. This limits your downside if the stock crashes.
D. Use Probability and Greeks
Understanding the "Greeks" can help you analyze risk exposure:
Greek What it Measures Risk Managed
Delta Price sensitivity Directional risk
Theta Time decay Time-related loss
Vega Volatility impact Volatility exposure
Gamma Delta’s change rate Acceleration of price impact
Rho Interest rate impact (minor risk)
Knowing your Greeks allows you to adjust trades when risks become too high.
5. Options Strategies for Risk Management
Some strategies are naturally more “risky,” while others are designed to limit downside. Let’s look at popular risk-managed strategies:
A. Covered Call
You own 100 shares of a stock and sell a call option. This gives you income (premium) and limits upside risk.
Risk: Stock falls
Reward: Premium + upside to strike price
B. Protective Put
You buy a put while holding the stock. It protects you from downside losses, like insurance.
Risk: Cost of put (premium)
Reward: Unlimited upside; limited downside
C. Vertical Spreads (Credit and Debit)
These involve buying and selling options at different strikes.
Bull Call Spread: Buy call + sell higher call
Bear Put Spread: Buy put + sell lower put
Both strategies have limited risk and reward, making them ideal for risk-conscious traders.
D. Iron Condor
You sell a call spread and a put spread on the same stock. Profitable when the stock stays in a defined range.
Risk: Limited to width of spread minus premium
Reward: Net credit received
This is a great strategy for sideways markets and offers good risk/reward if managed well.
6. Managing Risk Over Time
A. Adjusting Trades
If a trade moves against you, you don’t always have to take the loss. You can:
Roll the option to a later expiration
Adjust strikes to collect more credit or redefine risk
Convert to a spread or different strategy
However, be careful not to over-manage trades, which can lead to complex and risky positions.
B. Avoid Trading Around Events
Earnings announcements, Fed meetings, and budget declarations can cause huge volatility spikes. Option premiums are often inflated before such events. If you trade them, keep position size small and use defined-risk trades only.
Options Trading Strategies: From Simple to AdvancedPart 1: The Basics of Options
Before diving into strategies, let’s review the two core types of options:
1. Call Option (CE)
Gives the buyer the right (but not the obligation) to buy an underlying asset at a predetermined price (strike price) within a specific time period.
Bullish in nature.
2. Put Option (PE)
Gives the buyer the right (but not the obligation) to sell an underlying asset at a predetermined price within a specific time period.
Bearish in nature.
Each option has a premium (price you pay to buy the option), and that’s the maximum loss a buyer can face. Sellers (or writers), on the other hand, receive the premium but take on higher risk.
Part 2: Simple Options Strategies
These are basic strategies suitable for new traders.
1. Buying a Call Option (Long Call)
When to Use: If you expect the stock/index to rise significantly.
Risk: Limited to the premium paid.
Reward: Unlimited potential profit.
Example:
Stock XYZ is trading at ₹100. You buy a 105 Call Option at ₹2 premium.
If stock moves to ₹115:
Intrinsic Value = ₹10
Profit = ₹10 - ₹2 = ₹8 per share
Why It’s Good: Cheap entry, high upside.
2. Buying a Put Option (Long Put)
When to Use: If you expect the stock/index to fall.
Risk: Limited to the premium paid.
Reward: High if stock crashes.
Example:
You buy a 95 PE when stock is at ₹100, and premium is ₹3.
If stock falls to ₹85:
Intrinsic Value = ₹10
Profit = ₹10 - ₹3 = ₹7 per share
Why It’s Good: Good for bearish bets or portfolio hedging.
3. Covered Call
When to Use: You own the stock and expect neutral to moderately bullish movement.
Risk: Limited upside potential.
Reward: Premium + stock movement (if not called away).
Example:
You own 100 shares of XYZ @ ₹100.
You sell 110 CE for ₹5.
If stock rises to ₹110, you sell at that level and keep ₹5 premium.
If it stays below ₹110, you keep the shares + premium.
Why It’s Good: Generates income from stocks you hold.
4. Protective Put
When to Use: You own a stock and want downside protection.
Risk: Limited downside.
Reward: Unlimited upside.
Example:
Own 100 shares of XYZ @ ₹100.
Buy a 95 PE at ₹3.
If stock drops to ₹85, your put becomes worth ₹10, offsetting losses.
Why It’s Good: Acts like insurance on your holdings.
Part 3: Intermediate Strategies
Once you’re comfortable with buying/selling calls and puts, it’s time to explore neutral and range-bound strategies.
5. Bull Call Spread
When to Use: You expect a moderate rise in the stock/index.
Risk: Limited.
Reward: Limited.
Structure:
Buy 100 CE at ₹5
Sell 110 CE at ₹2
Net Cost: ₹3
Max Profit: ₹10 - ₹3 = ₹7
Max Loss: ₹3
Why It’s Good: Lower cost than buying a call outright.
Part 4: Risk Management Tips
Never deploy a strategy you don’t understand.
Use stop-loss and position sizing to avoid blowing up capital.
Be aware of Greeks (Delta, Theta, Vega) — they drive profits/losses.
Avoid naked options selling unless you have enough margin and experience.
Always review IV (Implied Volatility) before placing straddles or condors.
Understand expiry effects — options lose value faster as expiry nears.
Part 5: Real-Life Example
Let’s say Nifty is trading at 22,000. You expect no major movement till expiry. You execute an Iron Condor:
Sell 22100 CE at ₹100
Buy 22300 CE at ₹40
Sell 21900 PE at ₹90
Buy 21700 PE at ₹30
Net Credit = ₹100 - ₹40 + ₹90 - ₹30 = ₹120
Max Loss = Spread width (200) - Net Credit = ₹80
If Nifty stays between 21900 and 22100 — all options expire worthless and you earn full ₹120.
Conclusion
Options trading is like a chess game — it's not only about direction, but also timing, volatility, and strategy structure. Simple strategies like buying calls and puts are perfect for starters, but intermediate and advanced strategies allow you to profit in any kind of market — bullish, bearish, or neutral.
The key lies in choosing the right strategy for the right market condition, managing risks, and being patient.
Whether you're hedging your portfolio, generating income, or speculating on big market moves, options provide the tools — but it’s your responsibility to use them wisely.
If you’d like charts, payoff diagrams, or examples using live data (like Bank Nifty or stocks), let me know and I can include those too!
Basics of Options: Calls and PutsWhat are Options?
An option is a financial contract that gives the buyer the right, but not the obligation, to buy or sell an underlying asset (like a stock or index) at a specific price, on or before a specific date.
Think of it like booking a movie ticket. You reserve the right to watch a movie at a particular time and seat. But if you don’t go, it’s your choice. You lose the ticket price (premium), but you're not forced to go. Options work similarly.
Options are of two basic types:
Call Option
Put Option
Let’s break both down in detail.
1. What is a Call Option?
A Call Option gives the buyer the right (but not the obligation) to buy the underlying asset at a pre-decided price (called the strike price) on or before a certain date (called the expiry date).
When do traders buy a Call Option?
When they believe the price of the underlying stock or index will go up in the future.
Example of Call Option (Simple Case)
Let’s say you are bullish on Reliance Industries stock, which is currently trading at ₹2,500.
You buy a Call Option with:
Strike Price: ₹2,550
Premium Paid: ₹30 per share
Lot Size: 250 shares
Expiry: Monthly expiry (say end of the month)
You believe Reliance will go up beyond ₹2,550 soon. If it goes to ₹2,600 before expiry:
Your profit per share = ₹2,600 (market price) - ₹2,550 (strike price) = ₹50
Net Profit = ₹50 - ₹30 (premium) = ₹20 per share
Total Profit = ₹20 x 250 = ₹5,000
But if Reliance stays below ₹2,550, say at ₹2,500 on expiry, you won’t exercise the option. You lose only the premium (₹30 x 250 = ₹7,500).
Key Terminologies in Call Options
In the Money (ITM): When the stock price is above the strike price.
At the Money (ATM): When the stock price is equal to the strike price.
Out of the Money (OTM): When the stock price is below the strike price.
2. What is a Put Option?
A Put Option gives the buyer the right (but not the obligation) to sell the underlying asset at a pre-decided price (strike price) on or before the expiry.
When do traders buy a Put Option?
When they believe the price of the underlying stock or index will fall in the future.
Example of Put Option (Simple Case)
Assume HDFC Bank is trading at ₹1,600. You are bearish and expect it to fall.
You buy a Put Option with:
Strike Price: ₹1,580
Premium: ₹20 per share
Lot Size: 500 shares
Expiry: Monthly
If HDFC Bank falls to ₹1,520:
You can sell at ₹1,580 even though market price is ₹1,520
Gross profit per share = ₹60
Net profit = ₹60 - ₹20 = ₹40 per share
Total profit = ₹40 x 500 = ₹20,000
If HDFC stays above ₹1,580, your put expires worthless. You lose only the premium (₹10,000).
Key Terminologies in Put Options
In the Money (ITM): Stock price below strike price.
At the Money (ATM): Stock price = strike price.
Out of the Money (OTM): Stock price above strike price.
Who are the Two Parties in an Option Contract?
1. Option Buyer (Holder)
Pays the premium
Has rights, but not obligations
Can exercise the option if profitable
Loss is limited to the premium paid
2. Option Seller (Writer)
Receives the premium
Has obligation to fulfill the contract if the buyer exercises
Risk is unlimited for call writers and limited for put writers (if stock price becomes zero)
Profit is limited to the premium received
Difference between Call and Put Options (Summary Table)
Feature Call Option Put Option
Buyer’s Expectation Bullish (price will go up) Bearish (price will go down)
Right Buy at strike price Sell at strike price
Profit Potential Unlimited Limited (until price reaches zero)
Risk (for buyer) Limited to premium Limited to premium
Seller’s Role Sells call & hopes price won’t rise Sells put & hopes price won’t fall
Premium and What Influences It?
The premium is the price you pay to buy an option. This is influenced by:
Intrinsic Value: Difference between market price and strike price
Time Value: More days to expiry = higher premium
Volatility: Higher the volatility = higher the premium
Interest Rates and Dividends
What is Strike Price and Expiry?
Strike Price: The price at which you can buy (call) or sell (put) the underlying stock
Expiry: The last date till which the option is valid. In India:
Weekly expiry for Nifty, Bank Nifty, and FINNIFTY
Monthly expiry for stocks
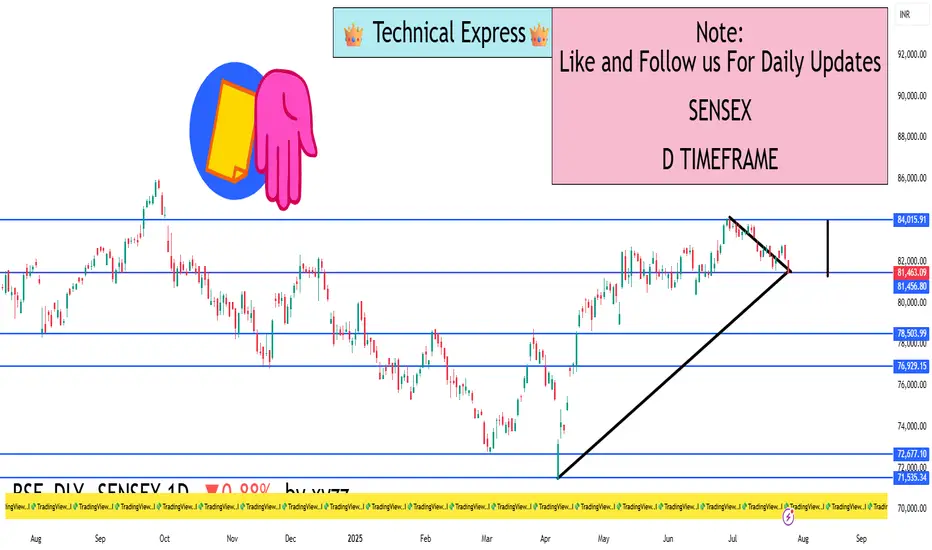
SENSEX 1D Timeframe📉 SENSEX Daily Overview (as of July 25, 2025)
Current Price: Around 81,460
Daily Change: Down by approximately 720 points (–0.9%)
Day’s High: About 82,070
Day’s Low: About 81,400
Previous Close: Around 82,184
📊 1-Day Candlestick Analysis
The candle for today is bearish, indicating strong selling pressure.
The price opened near previous levels but faced resistance at around 82,000.
Sellers dominated most of the day, pushing the index toward the 81,400 support zone.
🔍 Key Support and Resistance Levels
Level Type Price Range
Resistance 82,000 – 82,200
Support 81,400 – 81,000
If Sensex breaks below 81,400, the next target could be around 80,500 or 79,900.
If it holds above support and bounces, it could retest 82,200.
🧠 Technical Trend Analysis
Short-Term Trend: Bearish
Medium-Term Trend: Neutral to mildly bullish (as long as above 80,000)
Market Structure: Lower highs forming, suggesting pressure building on bulls
Indicators (assumed):
RSI may be approaching oversold
MACD likely showing bearish crossover
Volume increasing on red candles—indicating strong sell interest
📌 Sentiment & Market Context
Financial stocks (like banking, NBFCs) are under pressure.
Global cues (such as interest rate uncertainty and geopolitical concerns) are impacting investor confidence.
FII outflows and weak earnings in key sectors are adding to bearish momentum.
The broader trend remains range-bound, but with short-term downside bias.
✅ Strategy Suggestions (For Traders & Investors)
Swing Traders: Wait for a reversal candle (like a bullish engulfing or hammer) before considering long positions.
Breakout Traders: Watch for breakdown below 81,000 for continuation of the fall.
Positional Traders: Can wait to enter near 80,000–79,500 if the market holds that key level.
🔄 Summary
SENSEX is under pressure with a drop of 720+ points.
Technical structure suggests caution, especially if 81,000 breaks.
Support: 81,000 – 80,500
Resistance: 82,000 – 82,200
Institutional Trading Process 1. Investment Idea Generation
This is where it all begins.
Institutions generate trading ideas based on:
Fundamental research (company earnings, macroeconomic data)
Quantitative models (statistical or algorithmic strategies)
Technical analysis (price action, trends, volume)
Sentiment analysis (news flow, social media, market psychology)
Often, the research team, quant team, or portfolio managers work together to develop high-conviction trade ideas backed by data and analysis.
2. Pre-Trade Analysis and Risk Assessment
Before placing a trade, institutions perform:
Risk/reward analysis
Scenario testing (How does the trade perform in different market conditions?)
Volatility analysis
Position sizing based on portfolio risk budget

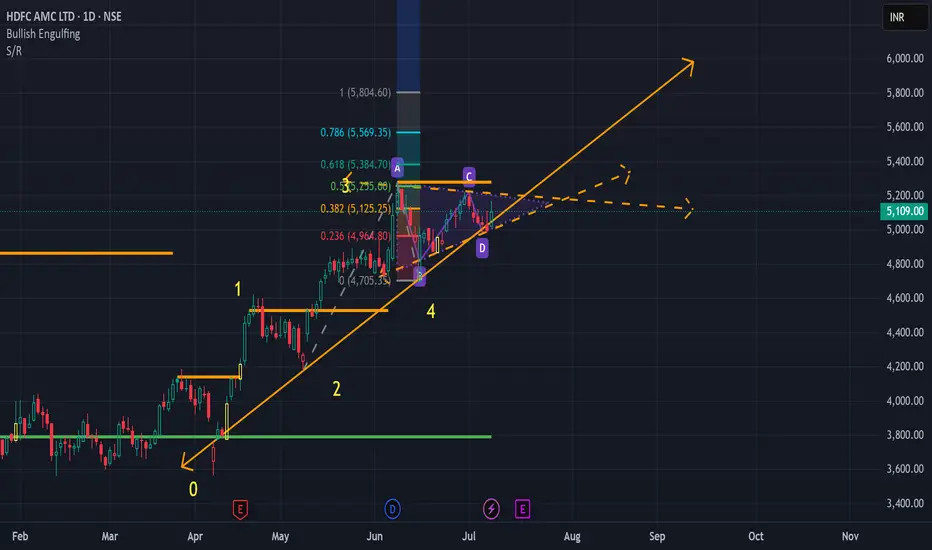
HDFCAMC in Pennant Trend PatternNSE:HDFCAMC shows a breakout of a Pennant Trend Pattern. Please Buy once there is a Bullish breakout. Target would be 5750
HDFC Bank BuyHDFC Bank bounced back from its trend line. also break above a consolidating range. Buy @CMP (2015) with SL of 1960 and a target of 2500.

HDFC BANK - Will Go up?So my indian friends yet again has asked for this discretion, I feel the gap will be filled today or slow chop, the move is due to the ceasefire, since the last time i posted, it went very high

HDFC Accumulation Breakdown Setup?HDFC seems to be building an accumulation range with:
Range High: ₹1955
Range Low: ₹1908
Currently, price is consolidating within this zone. I'm biased to the sell side for now, expecting a potential breakdown below the ₹1908 level.
⚠️ No confirmation yet — it's a “wait and watch” scenario. A strong close below the range low could trigger momentum selling.
💬 What's your view on this setup?

BANKNIFTY - 1 Day Time Frame Analysis📈 NSE:BANKNIFTY - 1 Day Time Frame Analysis
This chart shows a classic Inverse Head and Shoulders pattern forming on the daily timeframe of BankNifty. This is a bullish reversal pattern, generally indicating a potential shift from a downtrend to an uptrend.
Left Shoulder: Formed around April 23rd–25th, marked by a short-term low.
Head: The lowest point in the pattern, formed around May 8th.
Right Shoulder: Formed around May 28th, indicating buyers are stepping in earlier, showing strength.
The neckline resistance lies near 55,913, which the price is currently testing. A decisive breakout above this level, with good volume, could signal a further upward move towards the higher resistance zones like 56,526, 56,907, and possibly 57,292.
Key Support Zones:
55,167
54,791
54,479
Traders may look for a daily candle close above 55,913 for confirmation. Risk management is crucial as a failed breakout may lead to a retest of support levels.
TRADE PLAN:
🔹 Entry:
On a daily candle close above 55,913 (neckline resistance).
Preferably with strong volume confirmation.
🔹 Targets (Upside Levels):
Target 1: 56,526
Target 2: 56,907
Target 3: 57,292
🔹 Stop Loss:
Below 55,167 (recent support and right shoulder low)
Conservative traders can use a tighter stop below 55,400 (previous candle low).
🔹 Risk Management:
Use appropriate position sizing (risk only 1-2% of capital).
Wait for candle close above breakout level, not just intraday movement.
🔹 Invalidation:
If price fails to hold above neckline and breaks below 55,167, pattern becomes invalid.
This setup favors bulls as long as price sustains above the neckline.
Disclaimer: This analysis is for educational and informational purposes only. Please consult your financial advisor before making any trading or investment decisions.

HDFC BANK ANALYSIS – 1H TIMEFRAMENSE:HDFCBANK
Symmetrical Triangle Pattern Forming
A breakout or breakdown is likely soon. Price is consolidating within the triangle range.
HDFC BANK ANALYSIS ON 1 HOUR TIME FRAME
IMPORTANT LEVELS TO WATCH:
Resistance: 1941 – 1958 – 1970
Support: 1913 – 1898 – 1885
📌 Chart Pattern: Price is forming a symmetrical triangle which indicates a potential breakout or breakdown.
A breakout above 1941.75 (purple line) can trigger a bullish move.
A breakdown below 1913.25 (purple line) can attract sellers.
📌 Wait for a breakout confirmation before entering a trade.
👉🏻 @thetradeforecast

HDFC Life Insurance – Bullish Breakout on Monthly ChartHDFCLIFE is forming a strong ascending triangle on the monthly chart, signaling long-term bullish potential. A breakout above ₹750 with volume can trigger a fresh rally toward ₹880–₹920 in the coming months. RSI is trending up with strong momentum, which confirms buying interest. In the short term, ₹715 acts as support. Long-term investors can accumulate on dips.
Short-Term View: Buy on dips above ₹715 | Target ₹780
Long-Term View: Breakout above ₹750 | Target ₹900+
For educational purposes only

Review and plan for 22nd April 2025 Nifty future and banknifty future analysis and intraday plan in kannada.
This video is for information/education purpose only. you are 100% responsible for any actions you take by reading/viewing this post.
please consult your financial advisor before taking any action.
----Vinaykumar hiremath, CMT

HDFC BANK: Consolidation Breakout of 48 months - is wait over?With Nifty reaching to 26k without the participation of HDFC bank made many investors un-comfortable.
However now, Looks like the wait is about to over as Monthly Consolidation for almost 48 Months - 4 years is visibly broken but yet to give confirmation on candle close.
If the April 2025 candle closes above consolidate area then it will further increase the possibility of 30% up move.
DISC: Only for education purposes. Please consult your financial advisor before making any decision.

Review and plan for 21st April 2025Nifty future and banknifty future analysis and intraday plan in kannada.
Quarterly results.
This video is for information/education purpose only. you are 100% responsible for any actions you take by reading/viewing this post.
please consult your financial advisor before taking any action.
----Vinaykumar hiremath, CMT

HDFC BANK - For Indian Users!!Got a lot of request for it! You wish to see how it works, let my doodle do the magic for you!

Low risk Zone near 1550Multiple long term support cross near 1550 (Trendline Support with 200 week SMA ). So we consider 1550 as a low risk zone for HDFC BANK .

HDFC Bank Range Breakout: A Good Buying Opportunity...?After a period of strong consolidation, HDFC Bank has successfully cleared the resistance level at 1660. This breakthrough indicates potential upward momentum in the stock's price. Currently, the stock is retesting this 1660 level, which could serve as a crucial support zone before it continues its upward journey.
Considering the current market conditions and the recent price action, this presents an opportunity to enter a long position. We should aim for a first target around 1719, the next resistance level to watch. If momentum remains strong and the stock continues to rise, a second target can be set at 1808.
As always, it's essential to manage risk, especially in a volatile market environment. Therefore, implementing stop-loss orders is recommended to protect against any unexpected price movements. This strategic approach can help secure profits while mitigating potential losses as we navigate this trade.

HDFC Bank Rangebound Ahead of Quarterly ResultsHDFC Bank is currently navigating a range-bound market, maintaining stability with the upper range set at 1660 rupees and the lower range at 1629 rupees. This price action occurs in the lead-up to the eagerly anticipated earnings report, which is scheduled for January 22nd.
Investors should consider positioning themselves for potential movements based on the earnings results. If the bank exceeds market expectations with strong financial performance, it may break through the upper resistance level of 1660 rupees. A successful breakout could lead the stock to test the next significant resistance level at 1717 rupees, potentially offering a lucrative opportunity for long traders.
On the other hand, if the earnings report fails to meet expectations and the stock breaks below the lower support level of 1629 rupees, this could trigger selling pressure. Should this scenario unfold, we might see the stock decline further, possibly approaching the critical support level at 1595 rupees. Thus, traders should remain vigilant and prepared to adjust their strategies based on the upcoming results, whether considering long or short positions accordingly.

Swing Trading Strategy: HDFC Bank (HDFCBANK)Stock Outlook:
I maintain a bullish outlook on HDFC Bank (HDFCBANK) with a swing trade target of ₹1913.15 by February 27, 2025. This target aligns with the current technical and market trends indicating upward momentum.
Stop Loss Strategy:
To manage downside risk, ₹1600 has been identified as a crucial support level. Any daily settlement below this level will signal a potential breakdown, and positions should be exited accordingly.
Key Notes:
Risk Management: Ensure position sizing aligns with your overall risk tolerance.
Timeframe: This strategy is based on a swing trading approach and is meant to capitalize on short- to medium-term market movements.
Disclaimer:
This trading strategy is for informational purposes only and does not constitute financial advice. Market conditions are subject to change, and all trades carry risks. Please consult a financial advisor or conduct your own research before making any investment decisions. Past performance does not guarantee future results.

HDFCBANK Defies Market Panic Amid Election Volatility?HDFCBANK Stock Analysis – June 2024
Overview:
On May 30, 2024, the HDFCBANK spot closed at 1514.85 with an ATM IV of 25.69. According to my algorithm, the VVIX (VolatilityVision Index) was at 25.5614, indicating that bullish investors in this stock were not panicking over the impending Lok Sabha election results on June 4, 2024.
Key Levels:
- Probable Resistance: 1600.10
- Ultimate Breakdown Level (Black Swan Event): 1239.65
- Crucial Midpoint: 1419.20 (derived from the average of the resistance and breakdown levels)
Price Action Analysis:
Post-May 30, 2024, these levels showed significant correlation with market movements:
- June 3, 2024: Following stellar exit polls, HDFCBANK spot opened at 1599, which was also the day's high, demonstrating respect for the resistance at 1600.10. The stock closed at 1572.20.
- June 4, 2024 (Election Results Day): The stock opened at 1557.00, peaked at 1559.00, and then collapsed to a low of 1454.00. This action again showed respect for the midpoint price of 1419.20, implying that traders bought the dip with a stop-loss at this level.
Outlook:
If HDFCBANK spot does not test the midpoint of 1419.20, I expect the stock to retest the resistance at 1600.10. This is my personal view, and I am not suggesting anyone follow this analysis without their own due diligence.
Stay updated with more insights and analyses on our channel.

BUY HDFC BANK ABOVE 1906HDFC Banks is bullish and will give a fresh breakout above 1906.
Buy HDFC Bank if closes above 1906 on daily time frame for the Targets of 1974 and 2047 until 1824 is intact on downside.
To motivate us, Please like the idea If you agree with the analysis.
Happy Trading!
InvestPro India
