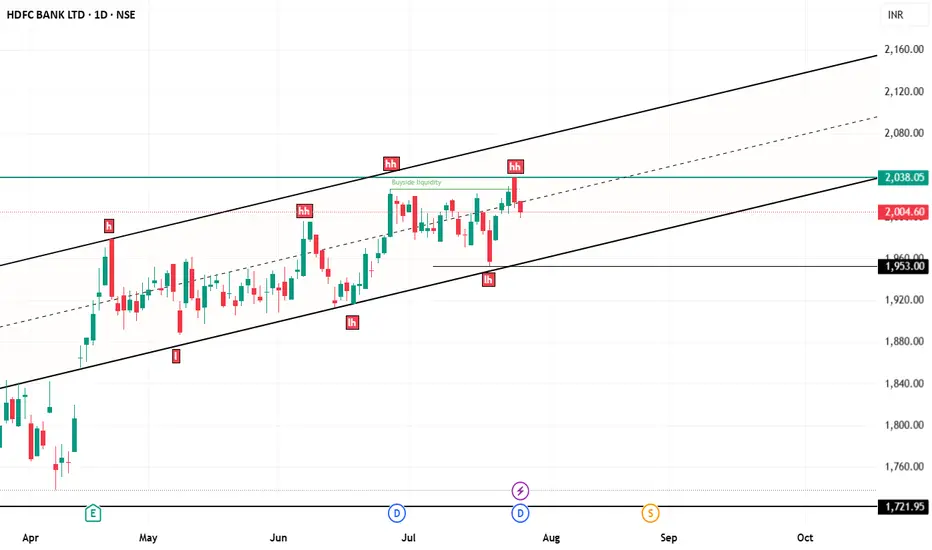
hdfc bank chart analysishdfc bank chart here in your screen
price working in parallel channel and 2038 is most important level for upside rise...
if 2038 break out with powerful vollume and candle then again we can see rally.
but a pattern here that is higer high and lower low...
Hdfcbankanalysis
HDFC Accumulation Breakdown Setup?HDFC seems to be building an accumulation range with:
Range High: ₹1955
Range Low: ₹1908
Currently, price is consolidating within this zone. I'm biased to the sell side for now, expecting a potential breakdown below the ₹1908 level.
⚠️ No confirmation yet — it's a “wait and watch” scenario. A strong close below the range low could trigger momentum selling.
💬 What's your view on this setup?

HDFC BANK ANALYSIS – 1H TIMEFRAMENSE:HDFCBANK
Symmetrical Triangle Pattern Forming
A breakout or breakdown is likely soon. Price is consolidating within the triangle range.
HDFC BANK ANALYSIS ON 1 HOUR TIME FRAME
IMPORTANT LEVELS TO WATCH:
Resistance: 1941 – 1958 – 1970
Support: 1913 – 1898 – 1885
📌 Chart Pattern: Price is forming a symmetrical triangle which indicates a potential breakout or breakdown.
A breakout above 1941.75 (purple line) can trigger a bullish move.
A breakdown below 1913.25 (purple line) can attract sellers.
📌 Wait for a breakout confirmation before entering a trade.
👉🏻 @thetradeforecast

HDFC BANK: Consolidation Breakout of 48 months - is wait over?With Nifty reaching to 26k without the participation of HDFC bank made many investors un-comfortable.
However now, Looks like the wait is about to over as Monthly Consolidation for almost 48 Months - 4 years is visibly broken but yet to give confirmation on candle close.
If the April 2025 candle closes above consolidate area then it will further increase the possibility of 30% up move.
DISC: Only for education purposes. Please consult your financial advisor before making any decision.

Low risk Zone near 1550Multiple long term support cross near 1550 (Trendline Support with 200 week SMA ). So we consider 1550 as a low risk zone for HDFC BANK .

HDFC Bank Range Breakout: A Good Buying Opportunity...?After a period of strong consolidation, HDFC Bank has successfully cleared the resistance level at 1660. This breakthrough indicates potential upward momentum in the stock's price. Currently, the stock is retesting this 1660 level, which could serve as a crucial support zone before it continues its upward journey.
Considering the current market conditions and the recent price action, this presents an opportunity to enter a long position. We should aim for a first target around 1719, the next resistance level to watch. If momentum remains strong and the stock continues to rise, a second target can be set at 1808.
As always, it's essential to manage risk, especially in a volatile market environment. Therefore, implementing stop-loss orders is recommended to protect against any unexpected price movements. This strategic approach can help secure profits while mitigating potential losses as we navigate this trade.

HDFC Bank Rangebound Ahead of Quarterly ResultsHDFC Bank is currently navigating a range-bound market, maintaining stability with the upper range set at 1660 rupees and the lower range at 1629 rupees. This price action occurs in the lead-up to the eagerly anticipated earnings report, which is scheduled for January 22nd.
Investors should consider positioning themselves for potential movements based on the earnings results. If the bank exceeds market expectations with strong financial performance, it may break through the upper resistance level of 1660 rupees. A successful breakout could lead the stock to test the next significant resistance level at 1717 rupees, potentially offering a lucrative opportunity for long traders.
On the other hand, if the earnings report fails to meet expectations and the stock breaks below the lower support level of 1629 rupees, this could trigger selling pressure. Should this scenario unfold, we might see the stock decline further, possibly approaching the critical support level at 1595 rupees. Thus, traders should remain vigilant and prepared to adjust their strategies based on the upcoming results, whether considering long or short positions accordingly.

HDFCLIFE Trading Above Fresh Demand ZoneHDFCLIFE is currently trading at ₹623, above its fresh demand zone between ₹608 and ₹600, established on 8th July 2024. This zone has not yet been tested, indicating potential buying interest if the price revisits this range. Investors may watch for a pullback to this level for possible entry opportunities.
Disclaimer: This analysis is for informational purposes only and should not be considered as financial advice. Please conduct your own research or consult a financial advisor before making any investment or trading decisions.

Swing Trading Strategy: HDFC Bank (HDFCBANK)Stock Outlook:
I maintain a bullish outlook on HDFC Bank (HDFCBANK) with a swing trade target of ₹1913.15 by February 27, 2025. This target aligns with the current technical and market trends indicating upward momentum.
Stop Loss Strategy:
To manage downside risk, ₹1600 has been identified as a crucial support level. Any daily settlement below this level will signal a potential breakdown, and positions should be exited accordingly.
Key Notes:
Risk Management: Ensure position sizing aligns with your overall risk tolerance.
Timeframe: This strategy is based on a swing trading approach and is meant to capitalize on short- to medium-term market movements.
Disclaimer:
This trading strategy is for informational purposes only and does not constitute financial advice. Market conditions are subject to change, and all trades carry risks. Please consult a financial advisor or conduct your own research before making any investment decisions. Past performance does not guarantee future results.

BUY HDFC BANK ABOVE 1906HDFC Banks is bullish and will give a fresh breakout above 1906.
Buy HDFC Bank if closes above 1906 on daily time frame for the Targets of 1974 and 2047 until 1824 is intact on downside.
To motivate us, Please like the idea If you agree with the analysis.
Happy Trading!
InvestPro India

HDFCBANK : Approaching Key Breakout ZoneOverview: HDFC Bank Ltd. is showing a series of breakout attempts, suggesting a build-up of buying pressure. The stock has repeatedly tested a resistance zone, indicating a potential for a breakout if this level is breached with strong momentum.
Key Levels and Zones:
Resistance Zone (Multiple Breakout Attempts):
The stock has faced resistance around the ₹1,750 - ₹1,760 level on multiple occasions, marking this area as a critical breakout point.
A sustained breakout above this level, particularly on a weekly basis, would signal bullish strength and could lead to a strong upward move.
First Resistance for Retest (₹1,881):
Once the breakout is confirmed, the stock may face initial resistance around ₹1,881, where some consolidation or a retest of the breakout could occur.
Second Resistance for Consolidation (₹1,992):
If the stock sustains above ₹1,881, the next significant resistance level is around ₹1,992. Consolidation at this level could provide additional momentum for further upside.
Target Zone (₹2,231):
Upon clearing the earlier resistance levels, the stock has potential to reach the target zone at ₹2,231, representing a new high and a possible long-term target for investors.
Technical Indicators:
The stock is trading near its 200-week moving average, suggesting it is above a strong long-term support level.
The formation of higher lows indicates an uptrend, adding to the bullish sentiment.

Hdfc bank technical analysis for tomorrow (09/Dec/2024)Hdfc bank moments for option and future trading 09/Dec/2024
follow us for more updates information.
message us for any stocks related information

Hdfcbank moments for intraday, option future trading 02/Dec/2024Hdfcbank moments for intraday, option future trading 02/Dec/2024
follow us for more updates information.
message us for any stocks related information
WELCOME TO ARROWINDEX
We're dedicated to providing you the best of Finance stock market , with a focus on dependability and Investment. We're working to turn our passion for Finance stock market into a booming online.We analyze Live Market and try to Provide learning information Content. All the Live Market views and charts .We hope you enjoy our Finance stock market as much as we enjoy offering them to you.Support and offering
Effective online education modules for all segments of traders
Customized portfolio tracker Online research & trading guidance
Entry and Exit support for:-
Intraday trading,Swing trading,Scalping,Position trading
Future & Delivery trading
Technical analysis
Fundamentals analysis
Fii & Dii data and reports

HDFCBANK // Go Longwww.tradingview.com
HDFCBANK: Without describing so much, lets jump into levels.
Here are the levels for HDFCBANK.
Support : 1690 / 1625 / 1570
Target :
Short term : 1900 / 2000 / 2120
Long term: 1950 / 2550

Hdfcbank moments for intraday and option trading 26/Nov/2024Hdfcbank moments for intraday and option trading 26/Nov/2024
HDFC Bank share price climbed above Rs 1,800 to hit a fresh all-time high on 25 November, as trading volumes saw an extraordinary surge with the MSCI November rebalancing coming into effect. More than 21.5 crore HDFC Bank shares were traded across NSE and BSE — nearly 8.6 times its 20-day moving average volume of 2.5 crore shares. The bulk of the trading activity occurred in the final half-hour of the session, with 19 crore shares sold after 3:00 pm.
The share price of HDFC Bank climbed above Rs 1,800 during the trading session, hitting an all-time high of Rs 1,803.55. It settled at Rs 1,785.6, up 2.3 percent from the previous close.

Hdfcbank moments for intraday and option trading 25/Nov/2024Hdfcbank moments for intraday and option trading 25/Nov/2024
follow us for more updates and information.

HDFC BANK LONGTERM
HDFC Bank can be a good long-term investment for a number of reasons, including its quality, stability, and returns:
Quality
HDFC Bank has higher scores for quality than other blue-chip lenders, and its stability ratios are superior.
Returns
HDFC Bank has given returns of +18.93% in the last year, and +82.31% in the last 3 years.
Analyst ratings
18 analysts have given HDFC Bank a strong buy rating, and 14 analysts have given it a buy rating.
However, stock investment depends on several factors, and investors should consider their own investment goals and horizon before investing.

HDFC Bank breaks all time highHDFC Bank has moved to break ATH since the last update on April 19, 2024. This adds confidence to the idea that the bulls have control.
Have adjusted the count a bit as it seems to nesting in a 1-2 1-2 pattern.
This one was a very low risk to reward trade, and has been playing out beautifully if you followed the plan as laid out in 18th January post.
Shall update as price further develops.
Thanks for reading!

HDFC BankADR +4%
Trend Supper bullish from 1550
I think some profit booking possible @near 1850
Short term traders will start booking profits below 1850
Lets C
Like.. Share... Follow

HDFC BANK _ Reached Pole TargetHDFC BANK _ Falling Wedge Pattern formed and Breakout yesterday. Today Reached Falling wedge Pole Target and Channel Top.

HDFC BANK _ Next Target is 1994 rupees (0.6 Fibonacci Extension)HDFC Bank is approaching its all-time high. If it Breakout above the resistance level, HDFC Bank could reach a New All-Time High, with the first target at 1994 rupees (0.6 Fibonacci extension level). The second target is 2385 rupees (100% Fibonacci extension). This is a Long-Term projection, so it is important to follow trend continuation techniques.
I want to help people to Make Profit all over the "World".

HDFCBANK 1700 CE 25th July 2024HDFCBANK 1700 CE 25th July 2024
1. Spot Analysis:
- HDFCBANK is currently near its one-year high and is trading with good volume.
- The latest tick shows a price rise supported by strong volume.
- The MACD (Moving Average Convergence Divergence) is trending up nicely, both in relation to the signal line and the zero line.
- A new high has been created, indicating the possibility of a breakout.
- The weekly candlestick pattern is Three White Soldiers, formed at a pretty high level, suggesting continued momentum.
2. Option Chain Data:
- The HDFCBANK 1700 CE has a strike price of ₹1700.
- The call option price is ₹53.7.
- The open interest (OI) is 4,012,800 contracts.
- The implied volatility (IV) is 21.87%.
- The spot price is ₹1711.35.
- The delta is 0.58, gamma is 0.76, rho is -1.01, theta is 1.91, and vega is -3.54.
- There is a long build-up in this call option.
3. Conclusion:
Based on the technical analysis and option chain data:
- The bullish momentum, strong volume, and positive MACD suggest a favorable outlook for HDFCBANK.
- The Three White Soldiers pattern adds to the bullish sentiment.
- Considering the long build-up in the 1700 CE, one can consider going long on this option.
Remember to perform your own due diligence and consider risk factors. 🚀

HDFC Bank Intraday (24-06-2024)24th Jun Intraday: HDFC Bank (15 Min)
Buy Above 1660: Target 1665/1670+
Sell Below 1642: Target 1635/1630
No Trade Zone: 1644.25 - 1653.65
#Trading #StockMarket #HDFCBank
