macro week bounce zonedepending on how we play out for the next couple days. Watch for that 21k i was speaking of
HEAD

she gonna skew ngl i did not forsee us sticking this tightly to an advancing reverse H&S however, here we are, way above prior ATH. Next up we begin trading that final shoulder. I belive this will kick off a consolidation phase which may trade down to 21k range.
area of interest is marked in the elliptical.
apologies for the line puke of a chart. hide drawings to view coherently.
Trade safe and be smart


BTC possible head and shoulders possible head and shoulders pattern on the 30M and 1H. we will reach 25k on the 25th

audjpy head and shoulder pattern long Time Trade #TradeWithMky
AuDJpy if pass this channel would be bullish for long time
there are some good signals for head and shoulder pattern in AUDJPY right now
so its good time to Go Long
actually head and shoulder would be more confirmed if these things happen
1 : at the end of a Movement
2 : confirmed channel for neck line
3 : pull back after passing neck line
goodluck !

Bitcoin set for a drop before riseWe should see inverted head & shoulders coming into Bitcoin in the coming 3 years. The last good chance to buy Bitcoin at a decent price will be provided after it retraces 78-88% of the last 2 years rise. There is no point of selling bitcoin. Buy and hold on every dip indicated is the best strategy for me.


Watch out! Possible H&S on XRP chart .. Possible next leg down..To everybody hoping XRP will pump any minute/hour/day (like myself), please be aware of a possible Head & Shoulders that recently developed on the charts.... I'm not sure that it will play out, at all, I'm just saying: be aware of a possible next (and hopefully final) leg down to retest our local bottom of around .4400 to .4500. Whether or not we'll see this H&S play out primarily depends on Bitcoin's behaviour, as always...
This is by no means any sort of trading advise, as I am usually wrong!! :-)

Inverted Head and should One more example of Inverted head and shoulders pattern which is change in the trend . Neckline is already broken and one can pick this stock and keep stop loss below neckline

NZD/CHF Swing H&S Forming?Possible Head and Shoulders on NZD/CHF!
Lets keep watching this pair and see what happens!
DovyFX

USDJPY Potenitial bearish setup.on the 4hr timeframe i saw an ascending channel which which broke to the downside which was below the daily resistance i had drawn .

US 30 30 Min Head and Shoulders Bearish Continuation after retest and close below previous zone for push to next zone!

USDCADTF: 1 Hr
Looking for a retrace and a buy. Pattern seems to be potentially unfolding an inverse H and S.
Potential Head and Shoulder - Target 15kA potential head and shoulders is forming on the 4Hourly time frame. If neckline is broken , the target is 15K
Also, a brearish divergence on all larger time frames


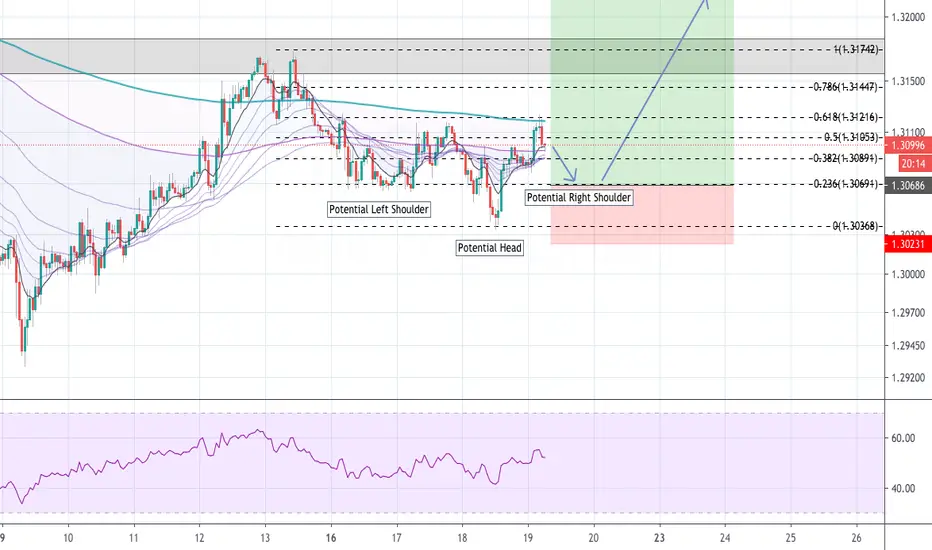
GBP AUD showing bullish reverse head and shoulders patternDo the analysis for yourselves and learn to become a better trader. If it passes the first resistance, it will target the second resistance. It is trying to head in the upwards direction. Follow me for more tips and ideas. Also, check out my website Traderhero.tk to become a skilled trader. Stop losing money, start gaining!

GBPJPY [SHORT] H&S on the 30mLooks like this is worth the trade, closure below this point where the 30m trend line meets the neckline.
TP 1 = 135.236
TP 2 = 134.885
Short Term Trade

FCPO TRADING : 207) possible formation of Double-topthis is haidojo and the number is 207 ...
a possible double-top formation ...fcpo-jan has gone into the selling region of 3070-3130...
another thing to watch out is...a possible formation of rounding top...this is supported by earlier price movement such as
when one of the critical supports 2980 was already broken...let's see if price could fall back to 2900...
if the price moves higher than 3130, then is it confirmed that uptrend persists...
higher resistance : 3200
strong resistance : 3070-3130 (abv this level is fastlane; crazy bull)
immediate support : 3020
lower support : 2900
WARNING!
RISK DISCLAIMER : this is juz a trading idea...trading stocks, futures or forex might incur a huge risk to your account/funds… DON’T LOSE MONEY THAT YOU CANNOT AFFORD …any idea(s) of trading in this episode SHALL NOT be regarded as a hint of BUYING or SELLING . It is MERELY a trading journal and it has been used for educational purpose only… trade at your own risk!
**your "LIKE" and "FOLLOW" are my main source of motivation to continue posting more valuable contents...TQ

FCPO TRADING : 205) 3030 -3130 stubborn resistance? Head? this is haidojo and the number is 205 ...
fcpo-jan still in uptrend...no confirmation of reversal of trend until important support is broken...
price might retrace back to 2980 and even the critical 2900...
and we need to watch if the support holds...uptrend persists if 3130 stubborn resistance is finally broken...
higher resistance : 3200
strong resistance : 3100-3130 (abv this level is fastlane; crazy bull)
immediate support : 3020
lower support : 2900
WARNING!
RISK DISCLAIMER : this is juz a trading idea...trading stocks, futures or forex might incur a huge risk to your account/funds… DON’T LOSE MONEY THAT YOU CANNOT AFFORD …any idea(s) of trading in this episode SHALL NOT be regarded as a hint of BUYING or SELLING . It is MERELY a trading journal and it has been used for educational purpose only… trade at your own risk!
**your "LIKE" and "FOLLOW" are my main source of motivation to continue posting more valuable contents...TQ

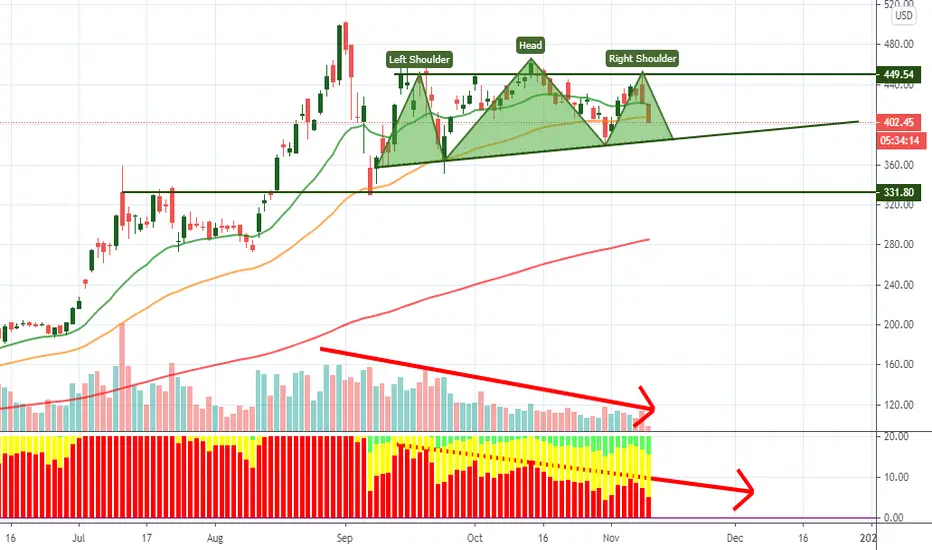
Bearish Head & Shoulders Pattern (1H)There are many interpretations of the Head & Shoulders Pattern.
After much research and back testing I have created a simple process using bespoke levels to objectively identify and trade the pattern.
Through extensive research into Harmonic patterns (in particular the Butterfly ) I have discovered how to accurately predict where the H&S pattern will occur.
The Butterfly Pattern Forms the structure of most H&S patterns.

ETH inverse H&SSo obviously ETH is going up along with the rest of the market, but this offers good targets to take some profits.
Whether you measure the shoulder depth, or the entire H&S depth, it matches up really well with the $440 and $480-490 resistance levels.
I expect a pullback at both of these levels, but of course ETH will go much higher in the long term.
