Small H&S TopWhat do you think about this possibility?
Small H&S being formed on BTCUSD with a
target of 6200?
HEAD

BTC New Rocket? Sub Daily I am neutral. Daily I am definitely leaning bullish.
Analysis:
In most of these downtrends with BTC you see several triangle consolidations, and they become more visible with the Heikin Ashi. Right now we are breaking up out of one.
Moving Averages:
On my 8HR Heikin Ashi I have translated 50+200 Daily SMAs as well as 50+200 4HR EMAs.
All MAs are consolidating. The 50 EMA could create a nice rejection off the 200 EMA indicating bullish movement.
The Daily 50 SMA was pressed, possibly indicating a reversal.
Pivots/Fibs/Support/Resistance:
Monthly Pivot was breached but only recently. Weekly S2 was tested and held well.
Previous resistance zone 6850 and local Fib might be turned support now.
TD Sequential:
Daily had a fairly gentle decline, and 8 HR Heikin Ashi put out several bullish indicators recently.

DJIA Dow Jones Industials - Beware the Head and Shoulders DJIA Dow Jones Industial Average Futures: DJIA1!
This was a great short overnight on the break below 25257 line for a fall to the next line at 25094.
It fell to this level exactly.
Perfect, technically speaking.
It should now make a rally attempt back as high as 25245-25257 range at best before it falls away again.
This price action would also form a head and shoulders on this index with a 451 point downside target at 24643. Interestingly there is already fixed support waiting for it at the 24641 line.
Look to short the counter rally and if this fails from lower than we ideally want it to will have to short on a break lower than 25080 with stops at least 30 above.
*For fastest Updates on major markets in real-time through the Summer holidays please check link at top-left of main page. Be lucky !

SandP 500 Index Head and Shoulders Formation
SandP 500 SPX500USD
The head and shoulders formation mentioned in earlier posts has duly formed its right shoulder over the last 24 hours or so - it's higher than it should be for a perfect H&S but nevertheless it still looks quite powerful.
It carries with it a minimum downside target at 7242 which is close to the fixed support line at 2740.
It was a sell once the neck-line broke at 2797 back to the 2790 line for a quick scalp - sorry, was too busy with Bitcoin update to get an S&P update out quickly enough.
Right now it's holding up from a low at 2789 but the counter-rally cannot be trusted.
The mood is still febrile, animal spirits to the fore.
Earning season makes for jumpiness, not helped by Trump's level playing-field mantra playing out across the airwaves.
It's time to look for the next best opportunity from here...
Ideally the S&P will rally further back towards the neck line at 2797-2800 range around the US open before falling away again to the downside target.
And if we don't see the counter rally as above we need to be ready to short once the 2787 level is broken with stops above here by 4 points or so.
We should get some action today.
Get ready!
*For updates to major markets in real time over the Summer hiatus please see link to Global Markets at top-left of main page.
31st July Update
We also have Apple numbers after the close which should give some succour to the bulls today.
It can therefore counter rally to 2809 and above to the parallel immediately above it at likely best before it comes off again.
Eventually it should break the little dynamic underpinning the current counter rally and fall away to 2796 at least and more likely to the 2790 line where it should bounce again. A quick scalp at likely best.
If so it will start to form a potential head and shoulders - perhaps waiting for Apple numbers - which may then go on to create the right shoulder.
Still too sketchy right now to know that though.
At any rate cannot trust the rally yet - at least until we see a restest and double bottom form at 2796.
So far this looks like a dead cat bounce.
Was hoping for better clarity here, looking for a better/bigger short from higher up.
But Apple's figures may just upset that apple cart and muddy the waters even further.
Looks like scalps at best again so far today : (


Chain-Link forming a head n shoulder with a 9 forming Chain link forming a head n shoulder with a 9 forming on the support line via Thomas DeMarks sequential indicator....easy 12 - 15 percent gain before it tanks?

mini 1hr h&s pattern triggers reaches target forms higher lowI wouldn't be worried about more downside unless we achieve a lower low...we will have to get below 7800 to do so. until then I will ladder in moderate dip buys. *not financial advice*
possible inverted head and shoulders inside the flagif the inv h&s is legit we have tested the neckline a few times a break of the necklien hsould help get us up out of the flag for good. Left shoulder is iffy but the rest looks legit.

Head and ShouldersLooks like the Head and shoulders is forming quite nicely, and target around 7.7k to the last support, we will still have to wait for the follow through with volume. might be in for some bear flags after that.

Look like pumpy pumpers at it again. Potential payout for bulls.This crazy breakout lead into a head and shoulders, then faked me out and i realized it was an inverse head and shoulders! The MFI, CCI, MF, TTM SQUEEZE, and STOCASTIC RSI all came together to potentially make this push happen! I am trying to publish fast as I think its coming soon
: )
This is not financial advice. I would highly advise taking any of my trades ; )

The correction for the massive bull pump begins.It had to break down sooner or later a retracement was long overdue. I was able to exit at around 7670 or so which was more than close enough for me to our projected inverted head and shoulder breakout of 7.7k and basically sold the top. It's hard to say just how far we will dip on this next downturn but I'm confident we will only form a higher low in doing so and continue upward...however, in the meantime a short correction is due so hence why I marked this idea short. I see 2 outcomes for this downtrend. a straight drop. or potentially a head and shoulder pattern...If it ends up being a head and shoulder pattern I have drawn a trendline where the head should meet the neckline and projected a rough estimate of how the second shoulder might look. I may put a limit buy in right when the head completes at the neckline with a tight stop loss under it should it break the trendline and keep falling. Ultimately I think once we complete the next breakdown we will likely turn back towards the uptrend from there.

DGB potentially on verge of an inverted head & shoulder breakoutCould be an impending breakout...could also be a fakeout...watch for bullish volume to confirm. Probability favors a breakout with btc being so bullish lately, however there's not much room to climb up on the 4hr stochrsi...so it could still go either way.

Possible inverse H&S ETH/BTCNeckline sits at about 0.055 and at the moment, it looks like the right shoulder probably won't start to form until late August. Target-wise I think we'll see 0.1 again before the end of the year.

BTCUSD Massive Inverted H&S Just HappenedIts important to study what happened so we know what to look for in the future and we know where we are at now. You can see a near textbook Inverted H&S pattern with some slightly off characteristics but nothing is ever perfect. This at least tells us that we are at the beginning of a new cycle and we should be looking at coming price movements that have followed Inverted H&S movements in the past of BTC.
Linked below you can see some of the patterns that formed while this was taking place so we know what to look for when this happens again.

Marico BUYBuy Marico at CMP 332 SL 320 Target 350.
STock almost forming a rounding bottom at 325 ....and inverse head and sholuder pattern

H&S LOOM/BTC, potential pump until next resistanceWe can find a shoulder-head-shoulder shape, if validated by breaking the 4000, sell targets could be reached.

inverted head and shoulders breakout confirmed target 7.7kguess we wont be waiting for futures to expire afterall...not sure if someone got news that an etf was gonna be approved or what. However this breakout should get us to at least 7.7k Maybe there will be a plummet after this before the futures expire..who knows. I hope for btcs sake it moons though.

BTC may be forming a cup and handle.Just my opinion, but with both the 4hr charts rsi and stochrsi well exhausted and well into the overbought zone and the 1 day chart's indicators now just reaching overbought conditions, I don't think we will be able to sustain an immediate breakout of the inverted head and shoulder pattern and a small correction is due to reset these indicator levels before a breakout can be sustained. at the same time we would like to see the price reach $6850 or so before any type of correction or retracement to establish a higher high on the 1 day chart and keep the ball in the bulls court. We can also see a very cup like price pattern has formed on this right shoulder. Also keep in mind that cme futures are set to expire on July 27th. All things considered my guess is that one of the 4hr candles that occur today will hit the $6850 region to complete the rimline of this cup pattern and then for the next 10 days or so we will see it form a handle until those futures expire at which point we will break above the cups rimline, the neckline of the inverse head and shoulder and the symmetrical triangle pattern we are in. Perhaps it will be Q3 which is the bullish one this year.

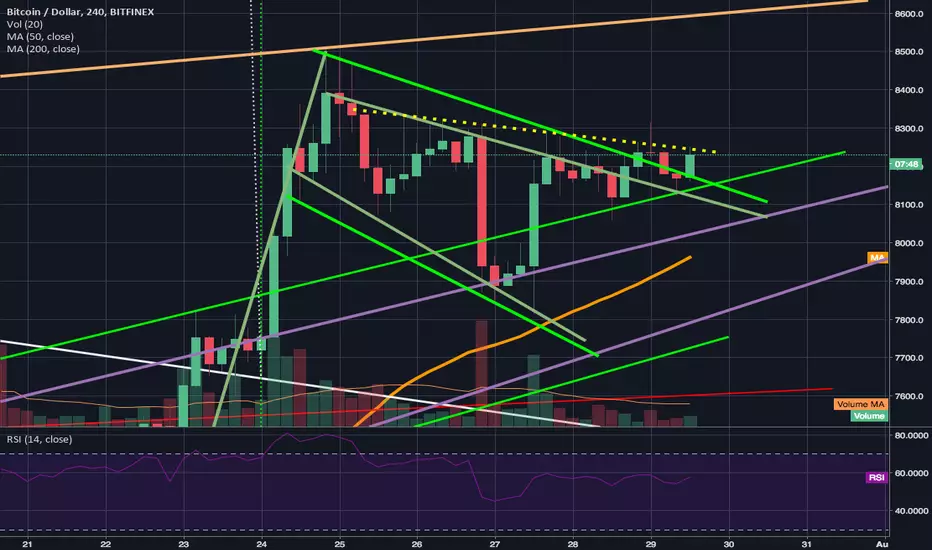
Sending bullwicks above the inverted head and shoulders necklineLooking at the 1 day chart we see a very promising sign here that the higher low/higher high bull pattern might continue. We need the price action to climb to 6850 or so to form a new higher high on the 1 day chart before the next significant breakdown happens. If so odds are food the following down trend will only form a higher low on the 1 day chart which will continue to allow the bulls to control the momentum. I already exited my position at 6690 and will be setting a stop buy up around 6894 to be safe. I think once we achieve the higher high on the 1 day chart a correction will be overdue and we will likely dip. I'm thinking we won't dip under 6.1k though before the next uptrend and will confirm a higher low at that point. All just my opinion though I could easily be wrong. As always not financial advice. Thanks for reading and best of luck!

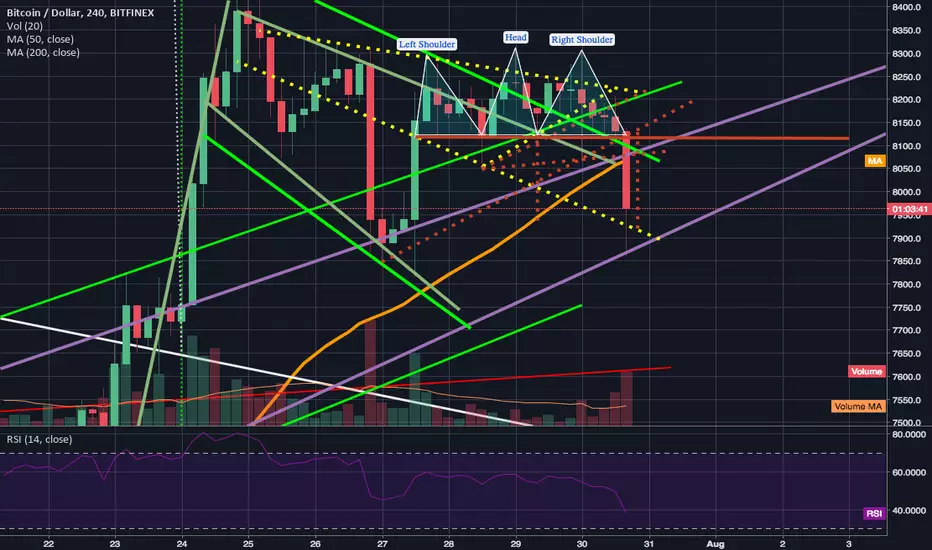
Big Surge in Bull Volume Takes Us Back Up Towards the NecklineA much needed bullish volume surge breaks price action back up above the 4hr 200 and 50MAs and sends us back up towards the neckline of the inverted head and shoulder pattern. People are attributing it to the rumor that Blackrock is considering getting into crypto ETFs. Botht he 4hr stochrsi and rsi are super extended in the overbought zones..so I think our most likely scenarios here now are either consolidate through a bull flag pattern for a bit to bring those indicator levels back down or potentially form a bart and dip back down a little bit to cool off the indicator levels. I still feel confident we will break above the inverted head and shoulder neckline eventually but probably not until after the futures expire on the 27th. This bullish break came at a crucial time too as the 4hr 50 and 200mas were wanting to create a death cross and this break should hopefully keep any death cross brief and send it right back into a golden cross. Although I am long term bullish, all factors considered here leaves this idea in the neutral zone.

Inverse head and shoulders pattern possibility.Possible inverse head and shoulders reversal pattern will most likely not play out....market is still bearish.

