Head and shoulders in Bitcoin chart
Unfortunately, a few days ago, when I saw this pattern on the Ethereum and Bitcoin charts, I forgot to record the Bitcoin chart in the ideas section and only recorded Ethereum.
There is no problem, there is a proverb that says, a fish is fresh whenever you take it out of the water.
HEAD

Op/USDT In Falling Wedge and Range [not so OP right now] Opusdt is in a Falling Wedge and in a range
Opusdt broke the support now we can see resistance from the previous support and support from the previous resistance and all these in a range inside of the Falling Wedge Pattern
After breakout we can see significant movement in opusdt
If we breakout upside than we have Falling Wedge Pattern confirmation but
If we breakout downside than we have Head&Shoulder Pattern Confirmation
P.S.THIS IS NOT A FINANCIAL ADVICE

BNB - H&S pattern and key levelsToday whole crypto market is likely open in red. Btc failed to break it's level of 25k again. With this trend bnb is also back to its 330 to 315 range.
Now here we can see that it's standing on 200ema in daily time frame also it forms head and shoulder pattern. Which technically indicates that price may come down with trend so we have to be prepared for some negative move on short time.
If head and shoulder pattern breaks it also break it's consolidate zone of 330 to 315 we can directly see target of 300 . we will not try to enter blindly after seeing big red candle. Mostly retest is done for good pull back so be prepared for that also.
If you are a risk taker and if market follow our idea than should try to achieve Target of 200 Ema in 4hour ti.e frame.
Here I give chart pic include target and sl with suitable risk reward ratio.

EURGBP BEARISH (?)Head and Shoulders in 1H TF it's already crossed, such as the BB what means a big chance of bearish and tomorrow we'll have the UK Employment change and the Unemployment rate

Prime time for soybean meal?Similar to our previous idea , we think grains are primed for a move. With soybean meal futures jumping over 10% from last week, some technical set-ups have come into play.
Firstly, the September soybean meal contract shows a 7-month head-and-shoulder pattern which failed. A broken right shoulder suggests bullish strength.
Secondly, the December soybean meal contract is showing a bull flag that is breaking out, which is also a bullish signal.
Combined, we believe soybean meal futures are primed for an upward move with both technical set-ups proving bullish.
Entry at 435, stops at 420. Targets at 468 & 490.


BTCUSDT Prints Another IH&S PatternHey everyone I want to make this short and sweet because I want you to see this but I do not have time today to put out the companion video with it, but I will either tonight or tomorrow. I wanted you to see how this pattern is almost the same inverse head and shoulders print as before, however the last time, the pattern failed and fell into a choppy consolidation. My local target for BTC is around 23000. I will talk more about this and show you some juicy charts in the video I am making. Thanks again, and I apologize for having to be short. This has been a crazy week of de-risking all across the board.


Trading opportunity for BNBUSDTBased on technical factors ( Head and Shoulders ) there is a long position in :
📊 BNBUSDT
🔵 Long Now 223.0
🧯 Stop loss 211.0
🏹 Target 1 239.0
🏹 Target 2 252.0
🏹 Target 3 278.5
💸Capital : 1%
We hope it is profitable for you ❤️
Please support our activity with your likes👍 and comments📝

Reverse Head and Shoulders - Beautiful ThingThe funny thing about this trade to me was how I traded this so wrong and absolutely got, well I traded this wrong. To read the very next day from a book so close to me about trading. Doh, reverse head and shoulders! And what's even more fun, is the failed reverse head and shoulders (not depicted here). Got me twice. :) Wont get me again. This was the UK100 15 minute.

Great HnS pattern !One of the greatest patterns have been formed , Set stop loss above moving average !
Not financial advise!

Head and shoulder pattern - Gail ind As we see financial result of Gail india was not good.
In 1day time frame of Gail india chart we see head & shoulder pattern with heavy selling in it as obvious due to results. According to it if it down from 142 level and sustain than our target for deep is 135 127 122 ( thz was exceptional one) bcz 127 was measured support for Gail india

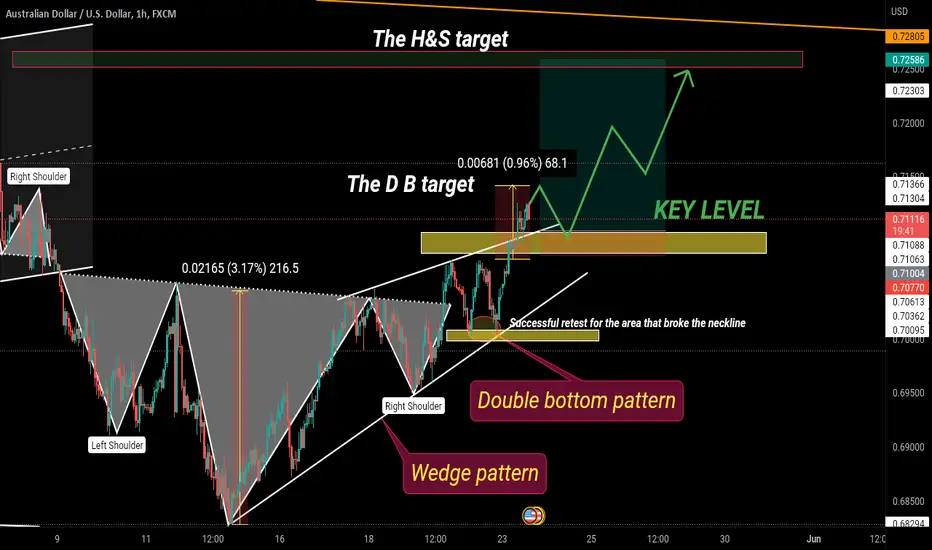
Too many patterns but one result Hi everyone,, this is how i see the audusd this week ,
We got 3 patterns all of them bullish ,
Everything is explained on the chart , along with a simple forecast,
If you like the idea give it a thumbs up ,,,
Trade safely,,,
BITF Entry target $4.30Price has always fallen after earnings. Estimate for next earnings is lower than past 2 quarters.
Entry target at $4.30 with a confirmation stochastic target of 64, and RSI entry of 53.
Require a breakthrough of $4.30 price.
Warning: Head-and-shoulders pattern in RSI along with constant overbought signal in Stochastics could signal bearish sentiment.
Lookahead: Consistent oversold signal in Stochastics and RSI breakout at 53 level is a good entry even if $4.30 price target not hit.
MACD is relatively flat, need a cross over zero line for a good break.

Dixon making head and shoulderDixon has made head and shoulder pattern on daily charts. It's a bearish head and shoulder and stock can correct upto 8 to 10%. Refer the chart for downside target.

INVERSE HEAD AND SHOULDER PATTERNThe Head and Shoulder Pattern has been formed on the 4HT. This could lead to gold heading up for this week.

NEARUSDT created a head and shoulders.The price created a head and shoulders on 4h and had a breakout from its neckline.
We could see a pullback on the daily resistance on 14.1$.
Big news on NEAR with USN and Liquidity mining, so we could see a false breakout from this area.
How to approach?
We will wait for a clear pullback until the neckline, if the price is going to have a rejection from that area we could wait for a new short position, otherwise, if the price is going to have a breakout from the 16$, we could see a new bullish impulse until the previous ATH
––––
Keep in mind.
🟣 Purple structure -> Monthly structure.
🔴 Red structure -> Weekly structure.
🔵 Blue structure -> Daily structure.
🟡 Yellow structure -> 4h structure.

VET can be hugeVET already broke 20 days resistance and we can seee outbreak also there is inverted head and shoulders pattern on 15m chart and the reversal candlestick on 1 day chart

Head and Sholders on Ethereum 4 hour
Head and Shoulders on Ethereum 4-hour chart breakout to go long.
Neckline at $3160.00
I mean me may self and I.
Not a financial advice!

Nifty going for a head and shoulders formation Nifty is forming a descent Head and Shoulders pattern and on a verge of breakdown.
From the current levels, if it breaks down, 17300-17350 is quite achievable.
Kindly note that this is not a trade idea and only an observation for study purposes only. Do you own diligence before investing.

ROSEUSDT is testing the weekly resistance!the price is testing the weekly resistance on 0.316$, where the price created the neckline of the head and shoulders, and where the market has a supply zone.
Nice volume is incoming right now.
on the 4h timeframe the price had a breakout from the 4h resistance on 0.24$ and a great breakout from the daily dynamic resistance.
How to approach?
The price needs to have a new breakout from the confluence area and retest it as new support. a Breakout is not enough, the price needs to satisfy our rules for a new long position. The next valid resistance is 0.35.
According to Plancton's strategy , we can set a nice order
–––––
Keep in mind.
🟣 Purple structure -> Monthly structure.
🔴 Red structure -> Weekly structure.
🔵 Blue structure -> Daily structure.
🟡 Yellow structure -> 4h structure.
–––––
Follow the Shrimp 🦐

Ethereum: Head and sholders forming on the 4 hour
Head and shoulder is forming on Ethereum 4-hour chart bearish divergence on RSI:
if the pattern confirms we have a high chance of falling to $3,140.
As we have bullish momentum, the market may ignore it but it's good to be aware!

BTC 38.5k within 36 hours? Head and shoulders..Which is exactly on top of the descending wedge support. I dont think we will see 40k again after this for a long period of time
