2 year prediction of total2, by Dia. big dump incoming.Seems like in a week or so we get the big answer. Market looks extremely bearish , I personally dont believe we can break the resistance
Pattern looks incredibly bearish.
We always dump before halving
the cup is drawn too big, it should not break the previous support of 462b
btc 19k bottom, maybe scam wick to 13k
expect 2020 highs of every altcoins, and some altcoins to completely be destroyed
HEAD

BTC retesting neckline of inverse h&s BTC retesting neckline of inverse head and shoulders. This is a crucial point for Bitcoin and with the tight consolidation happening, are you going Long?

btc head and shoulders?it is possible that bitcoin will create a head and shoulder patron, but it is also possible that bitcoin will set up a new all time high, so that retail traders will buy bitcoin so that they can sell their bitcoin for a higher price

NEARUSDT is creating an inverse head and shouldersThe price bounced on the monthly support on 8$ after a false breakout from the weekly dynamic support.
On the daily timeframe, the price had a breakout from the dynamic resistance and from the weekly resistance, and now the price is testing the 0.618 Fibonacci level as resistance
On 5h timeframe, the price is creating an inverse head and shoulders above the weekly resistance
How to approach?
If the price is going to have a breakout from its neckline and retest as new support, we can apply our rules for a new long position.
Be aware of the weekly structure on 13$
According to Plancton's strategy , we can set a nice order
–––––
Keep in mind.
🟣 Purple structure -> Monthly structure.
🔴 Red structure -> Weekly structure.
🔵 Blue structure -> Daily structure.
🟡 Yellow structure -> 4h structure.
–––––
Follow the Shrimp 🦐

BTCUSDT is creating an inverse head and shouldersBTCUSDT: The price got a rejection from the weekly resistance on the 46k as I said on the previous analysis. On the daily timeframe (the upper one) the price is creating an inverse head and shoulders and its neckline is the 46k key level.
On the 4h timeframe (the lower one) we can see a Pennant pattern, and the price is testing the static support on 0.5 - 0.618 Fibonacci level.
Usually, when the price is in the accumulation phase below an important structure we will see a new breakout.
How to approach?
We are monitoring the market and will wait for a reaction on the 0.618 Fibonacci level (43k). we could see a deep retracement until the lower trendline. If the price is going to lose the dynamic support the next valid support is 40k.
IF the price is going to have a breakout from the pennant and a CLEAR breakout from 46k, According to Plancton's strategy , we can set a nice order
–––––
Keep in mind.
🟣 Purple structure -> Monthly structure.
🔴 Red structure -> Weekly structure.
🔵 Blue structure -> Daily structure.
🟡 Yellow structure -> 4h structure.
–––––
Follow the Shrimp 🦐


BITCOIN 4H Inverse Head and Shoulder Bullish PatternBitcoin is forming an H&S pattern which is a bullish pattern. Currently, the market is at a standstill and is waiting for US Markets to react to the Russia-Ukraine Situation. A fundamentally strong event is happening internationally which can shape the markets for months to come if a war happens, the best strategy for me right now will be to wait for the market reaction to the to-be or not-to-be war.
From a technical analysis point of view Bitcoin has taken a healthy correction and a point of $40,200 is still not a stretched out possibility as it will liquidate a lot of long positions and that is always a good signal for a good Pump, accumulate alts at sale and stay out of leverage

GBP/USD BUY idea Reverse H&S forming, waiting for the neckline to be broken and a retest before going long on this position up to potentially $1.40. Waiting for confirmation before making any entry. Let me know what you think all criticism is an opportunity to learn :)

Head and Shoulders daily TF- Bullishbullish and shoulders pattern appears to be forming on this pair keeping n eye on it for further confirmation


Eth might be forming a weak HNS on the daily...Just hypothesizing.....eth either just tanks from here or does a wave up to complete a weak HNS/inverse cup and handle pattern, similar to what BTC has on its daily chart.

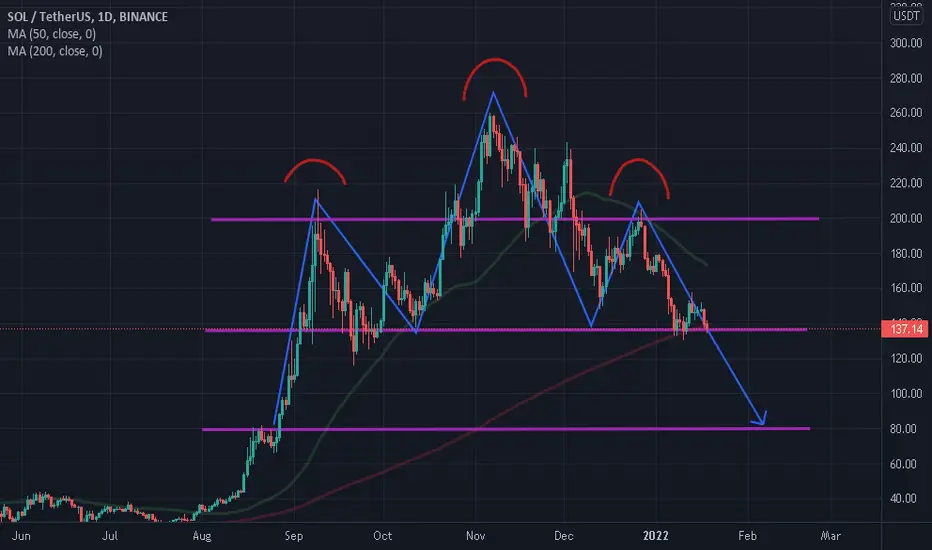
Solana ShortSolana Create head and Shoulder chart and its near to death cross 50 Moving Average is so close to 200 Moving average so its sure SHORT

btc - head and shoulders completion in courseBitcoin is doing what in my opinion is head and shoulders chop pot. It is completing the second shoulder heading to retest already previous tested support.

Head and ShouldersPerfect head and shoulder pattern ready to drop. Still in bearish market with sentiment only continuing. Going back to the monthly there is a double drop forming to its fullest. Is this the beginning of the end for bitcoin???


BITCOIN TO 30K $ Be Aware Hello Traders
btc upcoming 30K
be aware of bear in market again they fool you and you bought at all timr high
and now they are still waiting for more dip you can take 50 % entry now and wait for more dump as possible
if you like our idea
don't forget to press like button


BTC head & ShouldersBTC head & Shoulders
I think there is a strong possibility of a horrible crash before we moon

Head & Shoulder pattern in NIFTYHead & shoulder pattern formed in nifty in daily timeframe. OI is also deviating at lower end. Hence we can a good fall of 6-7%

BTC HL Structure plus parabol, ichimoku , Weekly confirmationBTC HL Structure plus parabol confirmation approaching. Head and Shoulders

Head And ShoulderDOTUSDT is possibly making a head and shoulder pattern , this trade requires Patience, don't hurry trade only after confirmed pattern,
Please share your thoughts in the comments

BROSBearish Head & Shoulders Pattern set up on BROS Notes on chart what to look for and how to possibly play the pattern .Sometimes these patterns will fail to break down if that happens i would look to get long above that green line as described on the chart
