Potential Head and Shoulders Pattern on XAUUSD (Gold)Chart: XAUUSD (Gold) on the 15-minute timeframe (based on "XAUUSD-15-OANDA" in the image).
Pattern: Possible Inverted Head and Shoulders. The image highlights what appears to be a developing head and shoulders pattern.
Key Observations:
Head and Shoulders Formation: The image indicates a possible left shoulder, a head, and what could become a right shoulder.
Fibonacci Retracement: There's a Fibonacci retracement level of 0.618 marked from the head to the potential right shoulder.
Trendline: A downward-sloping trendline connects the highs of the pattern.
Support/Resistance Levels: Horizontal yellow lines suggest potential support or resistance areas.
Head_and_shoulder

Algorand Inverse H&S
Algorand EURONEXT:ALGO inverse H&S developing, target .48, need to close .26 daily.

Potential Inverse H&S120660 should be Crossed & Sustained
for further Upside (with Good Volumes)
Inverse H&S Potential Target is around 138000-140000

Walmart Head & Shoulders on Daily and Weekly chartWalmart (WMT) may be forming, or already has formed, a bearish Head & Shoulders pattern.
#WMT #Walmart #bearish #short #headandshoulders #retail #discountstore

TATA Tech Breakout: Inverted Head & Shoulder Targets ₹856+A bullish reversal pattern forming in Tata Technologies Ltd (TATATECH) on the daily timeframe.
Pattern Identified:
📌 Inverse Head and Shoulders Pattern
Left Shoulder: Price dips and recovers
Head: A deeper dip followed by recovery
Right Shoulder: A higher low and bounce
Neckline: Resistance around ₹755 is tested multiple times
Key Technical Insights:
Breakout Above Neckline: Today's close above ₹755 confirms breakout
Target Projection:
Target = Neckline + Height (from Head to Neckline)
Projected Target = ₹856+
Volume Confirmation (optional): Typically, volume should rise during breakout for stronger confirmation
Sentiment:
Reversal from downtrend to possible uptrend
Bullish momentum expected to continue toward the ₹856+ zone

Stellar (XLM/USDT) – Daily Chart Technical Analysis
The chart illustrates a potential bullish setup forming on the daily timeframe of the Stellar/USDT perpetual contract on Binance.
After a prolonged downtrend, the price action has formed a clear double bottom pattern (W-shape), signaling a potential reversal. The neckline of the pattern has been broken and successfully retested, confirming the validity of the formation. Following this retest, XLM has continued to respect the ascending trendline, indicating sustained bullish momentum.
Currently, the price is consolidating just above the trendline, providing a potential long entry opportunity. The designated support area around $0.29725 acts as the key invalidation level. Should the price break and close below the $0.25211 zone, the bullish structure would likely be compromised, potentially leading to a trend reversal.
The target for this setup lies within the resistance zone between $0.38 and $0.40, an area that historically acted as strong supply. This zone is marked as both resistance and a take-profit area. Given the significance of this level, a partial profit-taking strategy is advised once price approaches this zone.
Volume analysis shows moderate participation during the recent leg up, which could suggest the need for higher volume confirmation on any breakout attempts.
The RSI indicator remains in neutral-bullish territory (around 56–58), suggesting that there is still room for upward movement before entering overbought conditions.
Conclusion:
As long as the ascending trendline holds, the structure remains bullish. A break above recent highs with increased volume could pave the way for further upside toward the $0.38–$0.40 region. However, a breakdown below the support zone would invalidate the long thesis and may warrant reassessment or potential short setups.
Risk management and dynamic stop-loss tracking are essential in this volatile range.

SEI/USDT Daily Chart Analysis – Potential Reversal ConfirmedThe SEI/USDT chart on the daily timeframe presents a notable Inverse Head and Shoulders (IH&S) pattern, which appears to have completed successfully. The neckline breakout occurred with a strong bullish impulse, suggesting a potential trend reversal from the prior downtrend.
Following the breakout, price encountered a significant resistance zone between $0.275 - $0.295, which acted as a supply area and triggered a short-term pullback. This level aligns with a previous structural breakdown point, adding to its validity as a resistance.
A key demand zone (highlighted in green), located between $0.195 - $0.229, has been marked as the “Long Idea” zone. This area previously served as resistance and now has the potential to flip into strong support upon retest, offering a favorable long entry if price revisits the zone. The current price action suggests that this retest may occur, offering an opportunity to enter with a better risk/reward ratio.
The measured move target from the IH&S pattern points towards the $0.35 region, which also coincides with a major horizontal resistance zone and serves as the primary take profit (TP) target.

PENDLE Bearish Head and Shoulders – Potential Pullback at the Ne CRYPTOCAP:PENDLE Bearish Head and Shoulders – Potential Pullback at the Neckline 📉
CRYPTOCAP:PENDLE has formed a bearish head and shoulders pattern. We could see a potential pullback at the neckline before the price moves down to the green line level as the next target. 📊

Chart is speaking itself...For months, I've been saying Bitcoin is bullish, and few believed it. I hope you made good profits. Get ready, Bitcoin will hit $300K soon.
PREVIOUS ANALYSIS
Stay Awesome , CobraVanguard

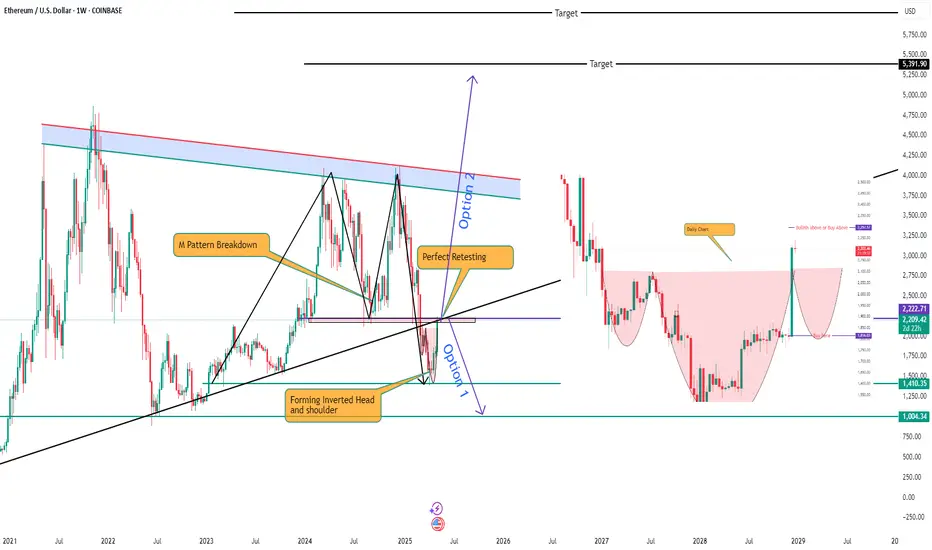
Ethereum - Perfect exactly how I thoughtEthereum
Stage 1 - Triangle Pattern - Gave perfect breakdown of triangle pattern
Stage 2 - Form M Pattern - Have almost completed the selling target
Stage 3 - Retesting completed *Current)
Stage 4 - Forming inverse cup and handle and inverted head and shoulder pattern
Stage 5- in either of the scenario it may come down but if it goes above 2297 expect it to reach 4000/500/7000 in coming days
Stage 5.2 - if the retesting is completed and bearish patter is continued expect it to reach to 900 USD
For more details ping me
GK Trade manthan
Inverted H&S Pattern in place.
Inverted H&S Pattern in place.
Breakout done.
May take a Risk with a SL of 81 on Closing basis.
Targets can be around 92 - 95 then 100-102

Hidden Bullish Divergence will play?as mentioned during market
timings, 36.50 was important to
sustain. It could not and hit the
Lower Lock at 36.03
Next Support is around 34.50 - 34.62
Now it is Important to Sustain 36.50 - 36.70
on Weekly basis.
Monthly Support is around 35.
One +ve sign: Hidden bullish divergence has
also appeared.

EURAUD - Bearish Head and ShouldersHello Traders !
The EURAUD failed to create a new higher high!
The price formed a head and shoulders pattern.
At the moment, The neckline is broken !
So, I expect a bearish move📉
_______________
TARGET: 1.71900🎯

Gold Setup: Range or Rip? Here's the PlaybookGold’s been on a tear lately — driven by safe haven demand as real yields soften and global uncertainty lingers.
But here’s where things get interesting...
We’re now watching what could be a textbook head and shoulders pattern start to take shape.
📊 Current Range:
Right now, price is stuck between 3380 and 3280 — and it’s acting like it knows it.
⚡ Possible Scenarios:
🔁 Scenario 1: Range Play
Short near 3380
Long near 3280
Let it ping-pong and catch the edges.
📈 Scenario 2: Breakout Long
Confirmation above 3380
Look for momentum follow-through into 3420+
📉 Scenario 3: Breakdown Short
Break below 3280
Eyes on the 3220s for a potential flush
🧠 The key? Drop to the lower time frames near these zones and wait for clean setups during active sessions — especially NY open or post-data volatility.
💬 How are you playing this? Breakout or bounce? Drop your take 👇
#gold #tradingview #futures #technicalanalysis #metals #xauusd #tradingstrategy #macro

H&S Pattern
Though H&S Pattern has formed but
Currently at an Important Support around
200 - 202.
Next Support lies around 193 - 196.
Though there is Bullish Divergence on
shorter time frame but its resistance is
around 226 - 231

Golden Pattern Alert! Inverse Head & Shoulders Spotted on GBP/JPHi traders! Analyzing GBP/JPY on the 1H timeframe, price is showing signs of a potential bullish reversal with the formation of an Inverse Head and Shoulders pattern:
🔹 Entry: 189.25
🔹 Take Profit (TP): 190.85
🔹 Stop Loss (SL): 188.25
After a strong downtrend, price formed an inverse H&S pattern with the right shoulder completing near the ascending trendline support. A breakout above the neckline around the 189.20 level confirms bullish intent, with momentum supported by a close above both the neckline and the 200 EMA.
RSI is also turning up, showing strengthening bullish momentum. The breakout candle is clean, with volume picking up slightly adding confidence to the setup.
If the pattern plays out fully, the projected target aligns with the upper boundary of the ascending channel around 190.85, which also acts as a confluence zone from previous structure.
⚠️ DISCLAIMER: This is not financial advice. Every trader is responsible for managing their own risk and strategy.

$COST Getting TiiightCostco has been bouncing between these trendlines the past couple of days. I'm expecting a big move in either direction soon, but right now its 50/50. My lean on the longer time frame is to complete the H&S on the daily chart to the downside after potentially trying to fill the gap at 1020.

H&S pattern Breakout.
H&S pattern Breakout.
67 - 68 can be an important Support.
71.50 - 72 is the initial Monthly Resistance.
Crossing & Sustaining this level may
take the price towards 82 - 85.
However, breaking 61 may result in
further selling pressure.

Nokia:Inverted Head and Shoulders Structure + Retest of BreakoutOn the weekly chart of Nokia, a classic Inverted Head and Shoulders reversal pattern has formed. The breakout above the neckline occurred with increased volume, confirming the strength of the move. Currently, the price is undergoing a standard technical retest of the neckline from above — a typical phase before a potential continuation higher.
The structure remains active: the projected height (H) points to an initial target at $5.48, based on the distance from the neckline to the head. If momentum continues, Fibonacci extension targets are located at $6.18 (1.272), $6.55 (1.414), and $7.08 (1.618).
Technical view: the retest of the neckline is happening on declining volume, strengthening the probability of a bullish reversal. EMA 50/100/200 are beginning to align in a bullish crossover. The ascending channel structure also supports the upward movement.
Fundamentals: Nokia is progressing with its strategic programs in 5G and upcoming 6G network technologies, reinforcing its long-term growth prospects. Improved financial performance and the recovery in demand for telecommunications infrastructure amid global digitalization trends continue to support investor interest in the stock.
The Inverted Head and Shoulders pattern is confirmed by the breakout and current retest. As long as the price holds above the neckline, the bullish scenario toward $5.48 and beyond remains intact. This is a medium-term trend reversal structure — strong setups like this form the foundation for major moves. Don’t miss them.

Should I hold my short at $3,305.69, or exit now What do you think, fam? Should I hold my short at $3,305.69, or exit now with gold so close to my stop-loss at $3,306.57? Drop your thoughts below—I’m curious to hear how you’d play this XAU/USD setup! If you’re one of the two ready to join me at Academia for Forex Trading, let’s talk—we’ll hunt these markets together. And while you’re at it, check out Icon Collections Store—does RiverSide, Desire, or Icoca vibe with your trading energy? Let me know!

Will Head & Shoulder Pattern play or not?Monthly Closing above 42 would be a
positive sign.
Weekly closing above 41.80 may lead
it towards 45.
H&S pattern is somewhat worrying. So,
unless 45-45.50 is crossed & Sustained, we
cannot expect further upside.

EURUSD Bearish Price is likely to return to a strong rejection area, which is significant due to the presence of both an Order Block (OB) and a Breaker Block. This confluence makes it a key supply zone. Additionally, this area may potentially form the right shoulder of a developing Head and Shoulders pattern, suggesting a possible bearish reversal from that zone."

NATGAS - Bearish Head and ShouldersHello Traders !
The Natural Gas price formed a head and shoulders pattern.
Currently, The neckline is broken !
So, I expect a bearish move📉
_______________
TARGET: 3.2350🎯
