Long on TVS MotorsRisk Disclaimer - Only for Educational Purpose.....
1) Big Picture trend is good UP
2) I Dropped to Lower Time Frame where Trend was Down And was Looking for Reversals
3) Found Reverse Head & Shoulders Patter.
Head_and_shoulder

Head and Shoulder PatternWith a confirmation, we will be entering our long entry following the basis of inverse head and shoulder where liquidity is high and the price has unfairly distributed (FVG) and simply because the market is on a bullish trend

Ethereum Head and Shoulders Still. PossibilityMost are bullish on cryptos again. Therefore we must be cautious as the HnS pattern could still be in play.
Add extremely low volume and there is strong suspicion that this is an HnS pattern at play, which
I mentioned way back in December.

XAUUSDXAUUSD has formed reversal pattern, inverted Head and shoulder, and retesting the neckline of HnS. The commodity also respecting the inclining trendline which is also a bullish sign.
Will Gold continue its bullish trajectory?

EURUSD SHORT or possible short LONG to SHORT in near futureI've been really studying the movement of the pair and this is what I've come up with. I am fairly new to this and this is my first time ever posting on here so any comments on how i can better explain my ideas would be greatly appreciated.

🔥 HBAR Multi Year Head & Shoulders: Waiting For The BearsHBAR seems to have formed a bearish Head & Shoulders pattern over the last couple of years. There's no confirmation of the pattern yet, so wait for that before drawing any conclusions.
HBAR is arguably one of the weaker alts at the moment, so wouldn't be surprised if it breaks bearish at some point in the future; patience is key.
In case of a bearish break out, I'd be looking at the yellow areas for potential targets. Will come back to this trade once we see more bearish price action.

BNBUSDT Impulse downward scenarioImpulse downward scenario up-to-date. As expected by the last bearish analysis, CZ coin is heading down to fall @ demand zones after a Head and Shoulders breakdown. Pullback to neckline accomplished.

JSWSTEEL Swing Long sidewe can go long on JSWSTEEL
Buy at at breakout
Traget= 1000
SL=734
As Nifty is at all time high, there is high probability stocks will see a buying trend. jswsteel is at breakout level.
on charts of jswsteel we can :-
1] Head and Shoulder pattern.
2] Tested the resistance 4 to 5 times now resistance is weak and can breakout.
3] High volume activity
4] Engulfing candle
Buyer are looking strong and we can see the targets in coming weeks.🚀🚀🚀🚀

DXY strength ahead?Fundamentals:
The US #10year #yield is aiming for 4% whilst the US 2 year yield is aiming its previous hight.
This is most probably on the back of higher sticky inflation which will require higher rates from the FED. This development is positive for the relative strenth of the #dollar in the #dxy
Technicals:
On a weekly graph, the DXY (inspite of a short spike) has traded inside a falling wedge. We are now trading at the top of the falling wedge.
Within the falling wedge, we currently have a right shoulder as part of an inverse head & shoulders pattern.
Potential Upside:
If we see both the falling wedge and inverse head & shoulders breaking to the top, the wedge's projected move is marked in yellow and the inverse head & shoulders projected moves are marked in white.

DXY Dollar strenght ahead?Fundamentals:
The US #10year #yield is aiming for 4% whilst the US 2 year yield is aiming its previous hight.
This is most probably on the back of higher sticky inflation which will require higher rates from the FED. This development is positive for the relative strenth of the #dollar in the #dxy
Technicals:
On a weekly graph, the DXY (inspite of a short spike) has traded inside a falling wedge. We are now trading at the top of the falling wedge.
Within the falling wedge, we currently have a right shoulder as part of an inverse head & shoulders pattern.
Potential Upside:
If we see both the falling wedge and inverse head & shoulders breaking to the top, the wedge's projected move is marked in yellow and the inverse head & shoulders projected moves are marked in white.

THE KING OF THE HEAD AND SHOULDERS | How to find this pattern
⚡Zer0_Trader
The essence of the strategy is to search for the direct and inverted "Head & Shoulders" pattern
Shoulders" pattern with the simultaneous confirmation of its potential workout on
Zer0 Trader Indicator" indicator, which makes it possible to trade regularly,
minimizing the closing of trades by stops.
❌TRADING WITHOUT AN INDICATOR
We see the "Head & Shoulders" formation, enter the trade 🔜 the trade is closed by a Stop Loss⛔
✅Trading with the "Zer0 Trader Indicator" indicator
We see the formation "GIP", we see the confirmation of the result on the indicator, we go into
trade 🔜 trade is closed at Take Profit
As you can see from the examples above, it is absolutely not enough to find
only a formation because:
- Perfect formations are quite rare in the market, and full-fledged
it is necessary to trade regularly to make a full-fledged profit;
- Every trader tends to see or "complete" a formation where it is not
any trader has a tendency to see or "draw" a formation where it doesn't exist and this leads to an increase in loss-making trades;
- without additional confirmation of a potential working out of a formation your deals
form, your trades will be closed by stops more often and take unnecessary losses which
you could have avoided using the indicator.
📈 INDICATOR "Zer0 Trader Indicator"
In order to enter non-obvious but potentially profitable situations and
I created the "Zer0 Trader Indicator" indicator to minimize errors. Thanks to
which increased the percentage of profitable trades by 90%, and the percentage of trades closed
of trades closed by stop was reduced to 10%.
The signal to enter the trade, along with the formation of Head & Shoulders/reverse Head & Shoulders, are the reduction of
strength on the indicator, namely, descending peaks (divergence/convergence), as in the
examples below.
🔎EXAMPLES OF WORKOUTS
In the framework of the trading strategy with the use of the indicator all situations can be
can be divided into 2 types:
- Head & Shoulders/ reverse Head & Shoulders with a flat base
- Head & Shoulders/ reverse Head & Shoulders with diagonal base
🟢Head & Shoulders/ reverse Head & Shoulders with flat base
*ideal, but rather rare situation
🟢Head & Shoulders/ reverse Head & Shoulders with a diagonal base
*The situation you will deal with most often
✍️ STEP BY STEP INSTRUCTIONS FOR WORK
Setting up a chart in TradingView
- Line" chart view
- logarithmic scale
Searching for the Head & Shoulders/ reverse Head & Shoulders pattern
- it is important that similar patterns draw several coins simultaneously
- on a downtrend, the chart and the indicator should be reversed (the scale should be inverted)
- you can look for a pattern by the indicator (divergence)
- the more ideal-looking is the pattern, the higher is the probability of its execution
- it is important that the pattern is drawn correctly not only on the line, but also on a candlestick chart
chart
Comparison of the chart and the indicator
The indicator must show a decrease in strength (three
divergence).
Searching for the entry point
TVX - entry point when the neckline is broken and the
of the candle behind it. It's important to have an identical pattern
on other coins as well.
Risk evaluation
Potential of the trade is measured from the top of the head to
the level of the neck line. We draw a line from the peak of the head to the
the neck line and re-position it to the potential breakout point.
We take the "Short/Long Position" tool and put
it in the TVX. Then we stretch out the targets by the level of potential,
and stop 3-4% above the head (on the candlestick chart).
Setting targets
Objective 1 (45%) - from the entry point to the middle of the breakout
Target 2 (45%) - till the end of analysis
Target 3 (10%) - to the moon, based on the previous extremums
*At achievement of the first target we move the stop to the Buy
☢️ THE MOST COMMON MISTAKE
Entering a trade in the absence of a pronounced divergence on the indicator
Such an error leads, at a minimum, to unjustified and useless losses, and, at a maximum, to
at most, liquidation, if there were no stops at all!
🔴THE MOST IMPORTANT SECTION
WHERE TO START TRADING?
You have read this tutorial, you understand everything and you are ready to fix the profit. BUT!
The first thing you need to start with is training on history and developing
observation of not just the chart, but the chart through the prism of this strategy. For
I strongly recommend each of you to do your homework.
Despite the fact that I've been trading for several years now, I myself regularly
myself on a regular basis.
HOW TO DO MY HOMEWORK?
1. You pick any coin and any year that has already completely passed.
2. Rewind the chart to January 1 and press "Market Simulator", which
will hide the chart movement from you after that date.
3. Choose a simulation speed of x10 and press the "Forward" button until you see the potential formation of the right shoulder,
until you see the potential formation of the right shoulder and head.
4. Next, you draw a potential neck line, a working pattern, and wait for
for confirmation of the formation. Additionally, see if a similar situation is drawn on other charts.
situation on other charts.
5. The deal worked out.
6. Make 2 screenshots (line + candlestick) and enter the results in the table
"Home" in your worksheet.
7. You save the screenshots in the folder with the name of the coin and drop them into the chat room, where I will
give comments.

The Bullish Case for Bitcoin! A Comprehensive Analysis!!!Chart is speaking it self!!!
🌟The Bitcoin is in a Bullish phase by ⤵️⤵️
➡️the BTCUSD has finished It's first five waves of Elliot wave principle movement (12345 Impulse wave) and also (ABC) wave. The possibility of starting a impulse 5th waves!!!
➡️falling wedge pattern it means that the price would increase and the price has already broken the pattern!
➡️the price now is making a pullback to the bottom of the descending triangle (which is shown in the picture) if the price breaks that important level we shall see a lot of increase in the price!
➡️A inverse head and shoulders pattern means a great bullish trend on the horizon (AB=CD).
➡️also Broadening Wedge it is another bullish sign.
🌟 Bullish signals are:
-Head&Shoulder.
-Broadening Wedge.
- falling Wegde.
-This is Longterm Analysis!!!
✅Thank you, and for more ideas, hit ❤️Like❤️ and 🌟Follow🌟!
⏮️Previous Analysis:

BTC - ShortH4 - The head and shoulder pattern is formed
But you have to wait until the breakout happens

sunpharma make reverse head and solder sunpharma breakout reverse head and solder pattern NSE:SUNPHARMA
level 1020
wait for confarmation then take trade on pullback
for good RR

XAGUSD Spot Silver Long XAGUSD on the 2H chart over the past month has ascended into a head and shoulders pattern
and then descended into a pivot on June 22nd. As it is now ascending, silver is a long trade
candidate. I see the stop loss as pivot low on 5/25 . Based on the volume profile and its
POC line, as well as the H & S pattern, the first target is the POC line at $ 23.3, the second
target at $23.45 which is the neckline of the pattern while the runner is $23.9 the horizontal
line of the top of the shoulders. I will take off 1/3 of the position at each target. Additionally,
I will raise the stop loss to break even upon getting halfway to the first target and to the first
target upon getting halfway to the second target. While leveraged on forex I expect
a high profit compared with the risk in the trade which will be risk off upon moving the
stop loss.

FrogAlgo: Head and Shoulder PatternThe head and shoulders pattern is a well-known chart pattern utilized in technical analysis to anticipate potential reversals in price trends. It derives its name from its visual resemblance to a head and two shoulders. Typically forming after an uptrend, this pattern is considered bearish and indicates a potential reversal in the market.
Here are the main characteristics of a head and shoulders pattern:
- Formation: The pattern consists of three peaks or highs, with the middle peak (the head) being the highest and the two outer peaks (the shoulders) slightly lower in height. The lows between the peaks form the neckline valleys.
- Neckline: The neckline acts as a support level, connecting the lows between the peaks. It serves as a crucial level for confirming the pattern. The neckline can slope upward, downward, or be horizontal.
- Volume: Volume plays a significant role in confirming the pattern. Typically, volume is higher during the formation of the left shoulder and the head, and lower during the formation of the right shoulder. A notable increase in volume can occur when the price breaks below the neckline, confirming the pattern.
- Breakout: The pattern is considered complete when the price breaks below the neckline. This breakout serves as confirmation for the bearish reversal, signaling a potential shift from an uptrend to a downtrend.
- Price Target: To estimate the potential downside target, measure the vertical distance from the neckline to the top of the head, and subtract that distance from the breakout point. This projected target represents a potential price level that the asset could reach after the pattern is confirmed.
- It is important to note that the accuracy of the head and shoulders pattern, like any other chart pattern, is subjective and can vary depending on several factors. Factors such as the timeframe, market conditions, and the quality of the pattern itself can influence its accuracy.
- Traders and analysts often use additional confirmation signals and indicators, such as volume analysis, momentum oscillators, and trendlines, to increase the reliability of their predictions when identifying head and shoulders patterns.
While the head and shoulders pattern is widely recognized and utilized by technical analysts, it is important to incorporate it into a comprehensive trading strategy that considers other factors such as fundamental analysis, market sentiment, and risk management.

GBPCHF Head and Shoulders PatternThere is a head and shoulders pattern on the 4H timeframe on GBPCHF that has formed at a resistance level and now starting to show weakness as the uptrend runs out of steam.However I strongly recommend waiting for the neck line to be broken first and then enter a short trade.Also another confluence for this trade is the RSI divergence suggesting a downtrend.The trade setup for this would be to enter at the break of the neckline(wait for candle close) which is also a flip zone( resistance turned to support) and set stop loss at 1.14444 and take profit at the second support level at about 1.11679
Trade Setup:
Entry - at the break and close of neckline
Stop Loss - 1.14444
Take Profit - 1.11679

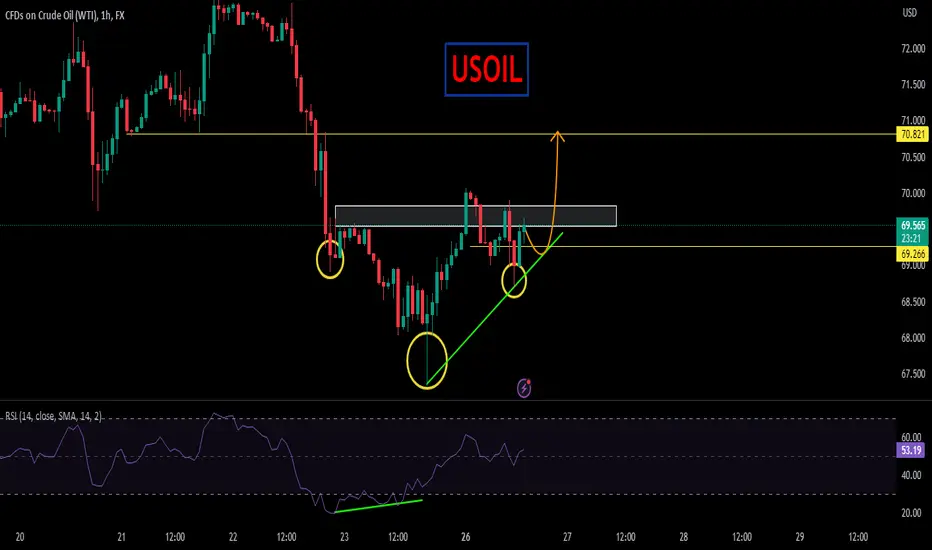
USOILUSOIL has created a reversal pattern ,Head and Shoulder, with bullish divergence. Currently the price is supporting a short inclining trendline and seems like the commodity is all set for bullish attempt.
BTCUSDT Short TargetWaiting for Neckline to be broken. Short target is shown on the chart with your own risk management.

Why do Patterns fail so often?To answer this question, let's try to take a classic Pattern as an example: the "Head and Shoulders" .
Typically Traders take short position (in this example) on neckline breakout and place stop loss above right shoulder or head.
If we only take these elements into consideration, it often happens that pattern fails.
Why does this happen? Because these elements are not enough and we need to use some "filter".
One of these filters, and perhaps the most important, is the "placement".
For example, the Head and Shoulders is considered a Reversal Pattern that should only appear at the end of a Trend, and this is where the "Elliott Waves" come into play. In fact Elliott claims that a Trend is formed of 5 waves (3 + 2) and often the first signal of the end of the trend is the first bearish leg after wave 5 (Wave A).
Another important filter could be RSI indicator because often some divergence also appears in wave (5).
In conclusion, the Patterns work very well on the market but you also need to learn how to use them correctly, trying to use some filters to get some more confirmation and limit losses as much as possible.
Naturally these considerations are personal and come only from my experience, but they are absolutely subjective and therefore open to criticism.
...I hope I was helpful.

DJI - Bullish H & S pattern #stocksMarket sentiment has changed with the fed pausing interest rate's.
possible we see this bullish move, but this doesn't mean Bull market.
zooming out you can see, this will break ATH and possible to complete an old wycoff accumulation extension.
My thoughts.. we may get the break out from all time high with the fed easing, but this is likely to be a bull trap!
Im still expected the Dow to take out the lows, later on in the year possibly when we see further rate hikes!
Suspected a recovery based off a W pattern I see forming on the US30, link attached below.
Originally I was very bearish once the price rejected 0.702 fibonacci retracement levels twice.
now its very possible to see a bullish recovery, will do great for market sentiment! but I would be very weary once this H & S completes this pattern.

BTC monthly Head and ShoulderHello Birdies,
I know many people not gonna like this. But I cant resist to post this idea.
No matter what you say the head and shoulder is bright as sun. If this got validated GOD!!
The demand zones are marked by monthly and weekly.
The strongest demand zone is at 9k-10k. If it fails I dont think weekly zone gonna hold.
It will fall to next Monthly Zone.
I dont know fundamental and by design I am only telling what chart is saying.

TOTAL wants to test MA200A Head and Shoulders in 1D Time Frame broke down, target is MA200. We should be ready to open Long positions if there is a bounce of MA200 after candle daily candle close. If you have long positions set Stop Lost, manage your risk.
