XRP/USDT I Reverse Short Squeeze Alert! Resistance at 2 USDTHey Traders after the success of my Previous trade this month on NASDAQ:HOOD hitting Target 1 & 2 in 2 days more than 16%+
With a Similar Trade setup But Crypto I bring you today
BINANCE:XRPUSDT
Short opportunity
- Market structure
- Head and shoulder pattern
- Currently will be trading at supply zone which was a recent support and now an ideal place for a reversal which is taking place as we speak- 4 Hour TF.
- Breakdown and retest
- Risk Aversion Dynamics in Cryptocurrency Markets
PROTIP/-
Entry on Bearish candle stick pattern on Current Levels
Stop Loss : 2.2292
Target 1 : 1.4707
Target 2 : 1.0507
Technical View
The orange circle marks a double top within the supply zone, acting as the shoulders of a larger head and shoulders pattern, suggesting strong resistance.
Bearish Trendline
breakdown + Retest
Risk Aversion Dynamics in Cryptocurrency Markets
Fundamental View - How Current Affairs can effect this pair!
The proposed imposition of significant tariffs, such as the 60% levy on Chinese imports suggested by former U.S. President Donald Trump, could trigger a chain reaction across global markets. This scenario would likely amplify risk aversion among investors, potentially catalyzing a sell-off in risk-sensitive assets like XRP (Ripple) in favor of perceived safe havens such as the U.S. dollar (and by extension, Tether/USDT). Below, we analyze the mechanics of this relationship and its implications for the XRP/USDT trading pair.
1. Tariff Escalation and Its Macroeconomic Consequences
1.1 Direct Impact on China’s Economy
A 60% tariff on Chinese exports to the U.S. would directly reduce China’s export competitiveness, potentially lowering its GDP growth by 1.5–2.5 percentage points annually, according to UBS economists. This slowdown would exacerbate existing vulnerabilities in China’s economy, including a property market crisis, weak domestic demand, and deflationary pressures (June 2024 CPI: 0.2% YoY). Reduced economic activity in China—the world’s second-largest economy—could dampen global trade volumes and commodity prices, indirectly affecting risk sentiment in financial markets.
1.2 Global Spillover Effects
The UBS analysis highlights that retaliatory measures by China or other nations could amplify trade fragmentation, further destabilizing supply chains and corporate earnings. For example, the April 2025 announcement of 25% U.S. tariffs on automotive imports triggered a 2.9% drop in the S&P 500 and a 5–7% decline in major Asian equity indices. Such volatility often precedes broader risk aversion, as investors reassess exposure to growth-dependent assets.
2. Risk Aversion Dynamics in Cryptocurrency Markets
2.1 Flight to Safety and USD Appreciation
During periods of economic uncertainty, capital typically flows into safe-haven assets like U.S. Treasuries and the dollar. Tether (USDT), a stable coin pegged 1:1 to the USD, often benefits from this dynamic as crypto traders seek stability. For instance, Bitcoin’s role as a “weak safe haven” for the USD in acute crises suggests that stable coins like USDT could see increased demand during tariff-induced turmoil, while altcoins like XRP face selling pressure.
2.2 XRP’s Sensitivity to Risk Sentiment
XRP, unlike Bitcoin, lacks established safe-haven credentials. Its price action in Q2 2025 exemplifies this vulnerability: a 7.5% decline over 30 days (peaking at 2.57 USDT on March 19 and bottoming at 1.64 USDT on April 7). This volatility aligns with broader patterns where altcoins underperform during risk-off periods. A global slowdown would likely intensify this trend, as retail and institutional investors reduce exposure to speculative crypto assets.
3. Mechanism: From Tariffs to XRP/USDT Price Decline
3.1 Investor Behavior in Risk-Off Environments
Tariff Announcements → Equity Market Sell-Off: The April 2025 auto tariffs caused a 6–7% drop in Asian equities, signaling growing risk aversion.
Liquidity Reallocation: Investors exit equities and crypto (including XRP) to hold cash or cash equivalents like USDT.
USD/USDT Demand Surge: Increased demand for USD lifts USDT’s relative value, pressuring XRP/USDT downward.
3.2 Technical and Fundamental Pressure on XRP
Supply-Demand Imbalance: As sellers dominate XRP markets, the token’s price in USDT terms declines. The 14.56% 90-day volatility in XRP/USDT suggests heightened sensitivity to macroeconomic shocks.
Liquidity Crunch: A broader crypto market downturn could reduce trading volumes, exacerbating price swings.
4. Historical Precedents and Limitations
4.1 Bitcoin’s Mixed Performance as a Hedge
While Bitcoin has shown limited safe-haven properties for the USD in short-term crises, its decoupling from altcoins like XRP during stress periods is well-documented. For example, Bitcoin’s 40% rebound post-COVID crash contrasted with XRP’s prolonged slump in 2020–2021.
4.2 Mitigating Factors
Stimulus Measures: If China implements aggressive fiscal stimulus, as UBS posits, a partial recovery in risk appetite could cushion XRP’s decline.
Crypto-Specific Catalysts: Regulatory clarity or Ripple-related developments (e.g., SEC case resolutions) could counteract macro-driven selling.
5. Conclusion: Bearish Outlook for XRP/USDT in Tariff Scenario
In a tariff-driven slowdown, the XRP/USDT pair faces downward pressure due to:
Risk Aversion: Capital rotation from crypto to stable coins.
USD Strength: USDT demand surges as a proxy for dollar safety.
Altcoin Underperformance: Historical precedent of XRP lagging during macro stress.
People interested should monitor China’s policy response and U.S. tariff implementation timelines, as these factors will determine the severity of XRP/USDT’s downside. A breach below the April 7 low of 1.64 USDT could signal prolonged bearish momentum.
This analysis synthesizes macroeconomic triggers, market psychology, and cryptocurrency-specific dynamics to outline a plausible pathway for XRP/USDT depreciation amid escalating trade tensions.
Not An Investment Advise
Head_and_shoulder

Dow jones - Head & Shoulder formation - Towards 36,500Dow Jones has Head & Shoulder breakdown,
With this it will have following targets possible,
37700 - 37200 - 36500

EURJPY on the Edge of Collapse: Ready for the Drop? Hi Traders ! The price has formed a Head and Shoulders (H&S) pattern on the daily (1D) chart and is approaching the neckline. If it breaks this level with strong momentum, we could see a significant decline, targeting the 135.000 - 140.000 zone.
Key Levels:
✅ Confirmation: Clear break of the trendline.
❌ Stop-loss: Above the right shoulder 165.000.
🎯 Bearish target: 135.000 - 140.000.
We’ll wait for confirmation before taking action. Stay tuned!
Disclaimer: This is not financial advice. Do your own research before making any trading decisions.

$NQ_F -- Short Head and Shoulders on WeeklyCME_MINI:NQ1! -- clear as day head and shoulders pattern forming on the Nasdaq Futures Weekly Chart -- getting very close the price range in which it should begin to rebound for a bit and then ultimately continue down.

Play On LevelsRetested the Breakout Level around 180 - 185 &
Closed just above a Very Important fib level around
188.
But, 188 - 195 is Very Important Resistance as of now.
If 195 is Crossed with Good Volumes, 212 - 215 can be
touched initially.
Couple of Positive Weekly Candles with comparatively good
volumes may confirm HL on Monthly basis.
On the flip side, 175 - 184 is a Support Zone & also Double
Bottom around 175 - 176, so Short Term Traders may
expect a bounce from this level.

Who knows ?SUZB3 is in an uptrend channel on the monthly chart, specifically at the lower edge of this channel, in a region that would indicate a buy, however, at this position on the 2-hour chart it presents a head and shoulders pattern at the end of a downtrend line. Meanwhile, the RSI shows divergence indicating a reversal to an uptrend.

Patel Engineering - Head & Shoulder formationWith H&S formation Patel Engineering will have following targets
T1: 32
T2: 27
T3: 22

TON Forms Inverse Head & Shoulders – Breakout Imminent?CRYPTOCAP:TON is forming a textbook Inverse Head & Shoulders pattern, a strong bullish reversal signal. The price is currently testing the neckline around the $3.90–$4.00 zone. A successful breakout and daily close above this level could confirm the pattern and trigger a move toward the $4.80–$5.20 resistance area.
Bullish Confirmation: Neckline breakout with volume.
Invalidation : close below 3.5
DYOR, NFA

Bullish on All Time Frames.Bullish on All Time Frames.
Breakout above 46.50.
Already re-tested the Previous Breakout
around 38.
Immediate Support is around 42.50 - 44
Immediate Targets can be around 49 - 50
However, It has the potential to touch 59 - 60.
It should not Break 40 now.

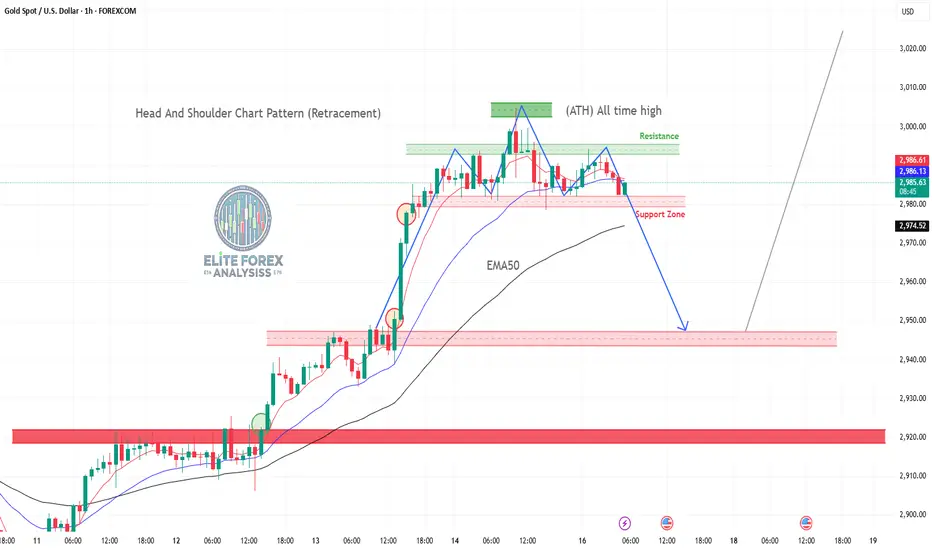
Gold (XAU/USD) – Head & Shoulders Pattern Analysis**📈 Gold (XAU/USD) – Head & Shoulders Pattern Analysis**
This chart represents the **Gold Spot (XAU/USD) 1-hour timeframe** and shows a potential **Head and Shoulders (H&S) pattern**, which is a bearish reversal signal. Let's break it down:
**🛠 Key Elements of the Chart:**
1. **📉 Head & Shoulders Formation (Bearish Sign)**
- **Left Shoulder**: Price makes a peak, then retraces.
- **Head (ATH – All-Time High at ~$3,005)**: The highest point before pulling back.
- **Right Shoulder**: Another peak, lower than the head, indicating weakness.
- **Neckline (Support Zone)**: Marked in red. A breakdown below this level confirms the pattern.
2. **📊 Exponential Moving Averages (EMA)**
- **EMA50 (Black Line)**: Indicates medium-term trend support.
- Price is testing this moving average, which acts as a dynamic support level.
3. **🔴 Resistance & Support Zones**
- **Resistance (Green Box near ATH)**: Selling pressure is strong at these levels.
- **Support (Red Zones)**: Price could test these areas if the H&S pattern plays out.
4. **📉 Bearish Projection (Blue Arrow)**
- If price **breaks below the neckline (~$2,974)**, it could drop to the next major support at **$2,940–$2,920**.
5. **📈 Bullish Scenario (Gray Arrow)**
- If price **rebounds from EMA50 and the support zone**, it could attempt another rally towards **$3,005 and beyond**.
### **📌 Trading Implications:**
✅ **Bearish Breakdown:**
- Sell below **$2,974** with targets at **$2,950–$2,920**.
- Confirmation comes from increased volume on breakdown.
✅ **Bullish Reversal:**
- If price holds above EMA50 and **breaks $2,990**, it could **retest ATH at $3,005+**.
- Strong buying interest could push gold to **$3,020–$3,050** in a risk-off environment.
### **🔎 Conclusion:**
📊 **Gold is at a critical level**—watch for a **breakout or breakdown** confirmation. A confirmed **H&S breakdown** could signal a retracement, while a **bounce above EMA50** keeps the **bullish trend intact**. 🚀💰 #XAUUSD
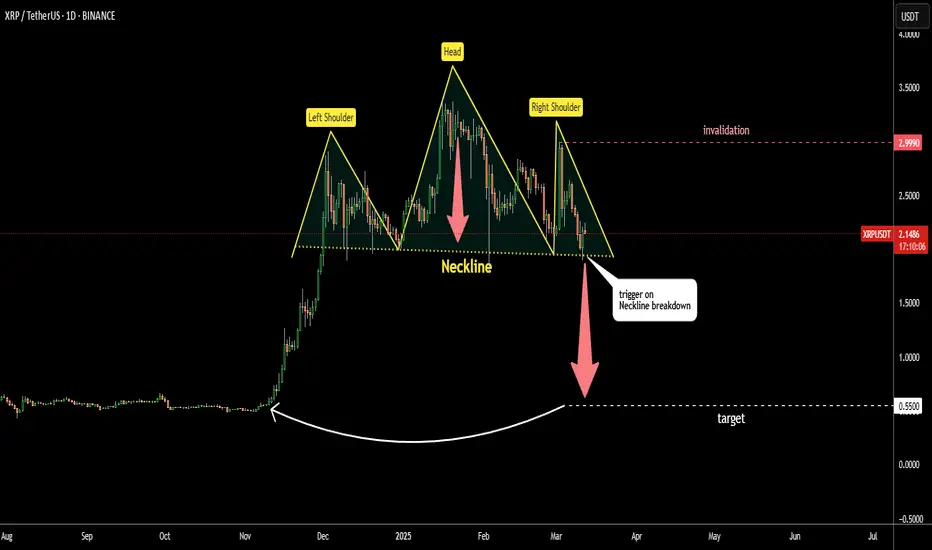
This Pattern Could Return Ripple (XRP) Where It Started Rally Textbook, beautiful symmetric Head & Shoulders reversal pattern emerged on Ripple
approaching the Neckline.
Head is the highest peak among three on the chart
Neckline is built through valleys of the Head.
Price already tested Neckline support and was rejected yesterday.
Bearish trigger is on the clear breakdown.
Target is located at 0.55
It was calculated by subtracting the height of the Head from the Neckline.
It is the support area where XRP started its rally before.
"What goes up should come down"
Bajaj_Auto towards 5500Bajaj Auto has Head & Shoulder pattern breakdown.
This will lead it to 5500 with following targets;
7000 / 6500 / 6000 / 5500

$64K price target of right shoulder of a H&S pattern.Bitcoin appears to have broken down from a H&S pattern.
BTC will likely consolidate down to old resistance and try to find some support before the next leg up to $140k.
Bullish Expanding Triangle highlighted in light green.

The Head and Shoulders Pattern: How to TradeHello, Traders!
Have you ever noticed price action forming three peaks, with the middle one standing taller than the others? If so, you’ve spotted the head and shoulders pattern, one of technical analysis's most well-known and reliable reversal patterns. Whether you’re trading stocks, forex, or crypto, the head and shoulders chart pattern can provide high-probability setups for both bullish and bearish trades. But is the pattern of the head and shoulders bullish or bearish? The answer depends on its structure.
Let’s dive into what a head and shoulders pattern is, how to identify it, and how to trade both the classic and inverse head and shoulders patterns effectively.
What Is a Head and Shoulders Pattern?
The head and shoulders trading pattern is a reversal formation that signals a shift in trend direction. It consists of three peaks:
Left Shoulder – A price rise, followed by a temporary decline.
Head – A higher peak, followed by another drop.
Right Shoulder – A lower peak that struggles to reach the height of the head, signaling weakness in the trend.
Neckline – A support level connecting the lows of the left shoulder and the right shoulder. The breakout below this level confirms the reversal.
The head and shoulders stock pattern typically appears at the top of an uptrend, indicating a potential trend reversal to the downside.
Is the Head and Shoulders Pattern Bullish or Bearish?
The classic head and shoulders pattern is bearish, which usually signals that buyers are losing strength and sellers are taking control. Traders use it to identify potential downtrends and short-selling opportunities.
However, the reverse head and shoulders pattern, also known as the inverted head and shoulders pattern, is bullish and might signal the start of an uptrend.
The head and shoulders candlestick pattern is considered to be most effective when combined with volume analysis—high selling volume at the neckline is thought to confirm the breakdown.
Head and Shoulders vs. Other Reversal Patterns
The head and shoulders chart pattern is one of the most reliable reversal formations, but how does it compare to others?
Head and Shoulders vs. Double Top – The head and shoulders pattern includes three peaks, while a double top has only two.
Head and Shoulders vs. Triangle – Triangles are continuation patterns, while the head and shoulders candle pattern signals reversal.
Final Thoughts: Why the Head and Shoulders Pattern Matters
The head and shoulders trading pattern is considered to be powerful for identifying trend reversals. Whether you’re trading a head and shoulders, a pattern bullish setup with an inverted head and shoulders pattern, or a bearish reversal with the classic formation, mastering this strategy can improve your trading accuracy.
So, traders, have you used the head and shoulders chart pattern in your strategy? What’s your success rate with it? Let’s discuss it!

GOLD Daily, H4, H1 Forecasts, Technical Analysis & Trading IdeasDaily Timeframe:
TVC:GOLD has been rising rapidly recently but has almost stopped since February 11, when it hit its uptrend channel line.
With the RSI hitting resistance at 77 and showing signs of falling, there is a high probability that a corrective wave is about to begin.
Four-hour Timeframe:
A rising wedge pattern has formed in the price.
As long as the price does not break the resistance at 2955 and the red line of the rising wedge continues upwards, a downward wave is expected to begin.
A strong bearish divergence has also formed in the RSI.
One-hour Timeframe:
A head and shoulders pattern is forming.
If the price can break the neckline downward and the blue trend line of the rising wedge is also broken, the probability of a downward wave will be very high.

Head & shoulders pattern: a bearish reversal setupThe Head & Shoulders pattern is a classic bearish reversal formation that signals a potential trend change from bullish to bearish. It consists of three peaks:
Left Shoulder: A rise followed by a decline.
Head: A higher peak forming the highest point of the pattern.
Right Shoulder: A lower peak, similar in height to the left shoulder.
Neckline: A support level connecting the lows of both shoulders.
Trading Strategy
1️⃣ Confirmation: A valid pattern forms when the price breaks below the neckline, confirming a potential downtrend.
2️⃣ Entry Point: Traders typically enter a short position when the price closes below the neckline.
3️⃣ Target: The expected price drop is approximately equal to the distance from the head to the neckline.
4️⃣ Stop Loss: Placed above the right shoulder to manage risk.
This pattern, seen in the NASDAQ 100 Futures (4H timeframe), highlights a strong reversal, leading to a significant downtrend after the neckline was broken.
Do you trade the Head & Shoulders pattern? Let’s discuss in the comments!

Accumulation complete, re-rating starts now ?There is some very bullish price action being observed in Biontech. This could mean a catalyst for all the vaccine stocks could be coming soon.

GBPCHF - Head and Shoulders SetupHello traders,
On the daily timeframe GBPCHF has been consolidating in a range. Now it is at the resistance level of the range and so we should be looking for shorting opportunities.
On the lower timeframes, the 4H and 2H, it has formed a head and shoulders pattern which is a great reversal pattern.
Add to this the RSI divergence which in many occasions foreshadows the change in trend.
I will be entering when we get a close below the neckline on the 2H timeframe.

Does anyone want to long this? No? Byeim15 has a patter on inverse hns and the ema crossover will send it to wave 5. target 0.35. This is a Yolo position

LINK's bearish movement!BINANCE:LINKUSDT
LINK is crafting a Head and shoulder pattern which is of course a bearish pattern!
The right shoulder is yet to come but when it happens, and the support line is lost, we shall see the price decrease massively!
expected targets:
14.07
12.82
Last target and also a hard support:
10.11
Note that the price will NOT decrease unless the support line is lost!
For now It shall ascend once again!
⚠️ Disclaimer:
This is not financial advice. Always manage your risks and trade responsibly.
👉 Follow me for daily updates,
💬 Comment and like to share your thoughts,
📌 And check the link in my bio for even more resources!
Let’s navigate the markets together—join the journey today! 💹✨

Cheniere Energy (NYSE:LNG): Head & Shoulders Targets $187 Head & Shoulders reversal pattern has been spotted.
Trigger: Breakdown below Neckline was activated yesterday
Target: $187 - height of Head below Neckline
Invalidation: $233
Fundamentals: Peace talks on Ukraine

Reversal in progress?Is NESF starting to complete the Head phase of an inverse H&S pattern?
Still no end to the downtrend yet.
Probably need to wait another 12 months to see.
If the BOE further reduce interest rates, this will help its cost of capital.

Decoding German DAX: Crucial Levels and Emerging PatternsFX:GER30
Current Market Overview
Explore the latest insights into the German DAX index with a focus on pivotal support, resistance levels, and potential trading patterns.
Support and Resistance Levels
Support at €21,105: This level acts as a critical neckline for a potential Head and Shoulders pattern formation. We should watch closely for any breaks below this level, as it could signal further downside movement.
Resistance at €21,557: A new resistance level has formed close to the 61.8% Fibonacci retracement level. This resistance may contribute to forming the right shoulder of a reversal pattern.
Potential Head and Shoulders Pattern
The Head and Shoulders pattern is a key technical formation to watch for:
Formation Details: If the DAX breaks below the neckline/support at €21,105, it could confirm the formation of a Head and Shoulders pattern.
Target Projection: A break below the neckline suggests a potential downside target around €20,452. This level aligns with the weekly fractal resistance previously breached at €20,529, which could act as support.
Happy Trading,
André Cardoso
