Accumulation complete, re-rating starts now ?There is some very bullish price action being observed in Biontech. This could mean a catalyst for all the vaccine stocks could be coming soon.
Head_and_shoulder

GBPCHF - Head and Shoulders SetupHello traders,
On the daily timeframe GBPCHF has been consolidating in a range. Now it is at the resistance level of the range and so we should be looking for shorting opportunities.
On the lower timeframes, the 4H and 2H, it has formed a head and shoulders pattern which is a great reversal pattern.
Add to this the RSI divergence which in many occasions foreshadows the change in trend.
I will be entering when we get a close below the neckline on the 2H timeframe.

Does anyone want to long this? No? Byeim15 has a patter on inverse hns and the ema crossover will send it to wave 5. target 0.35. This is a Yolo position

LINK's bearish movement!BINANCE:LINKUSDT
LINK is crafting a Head and shoulder pattern which is of course a bearish pattern!
The right shoulder is yet to come but when it happens, and the support line is lost, we shall see the price decrease massively!
expected targets:
14.07
12.82
Last target and also a hard support:
10.11
Note that the price will NOT decrease unless the support line is lost!
For now It shall ascend once again!
⚠️ Disclaimer:
This is not financial advice. Always manage your risks and trade responsibly.
👉 Follow me for daily updates,
💬 Comment and like to share your thoughts,
📌 And check the link in my bio for even more resources!
Let’s navigate the markets together—join the journey today! 💹✨

Cheniere Energy (NYSE:LNG): Head & Shoulders Targets $187 Head & Shoulders reversal pattern has been spotted.
Trigger: Breakdown below Neckline was activated yesterday
Target: $187 - height of Head below Neckline
Invalidation: $233
Fundamentals: Peace talks on Ukraine

Reversal in progress?Is NESF starting to complete the Head phase of an inverse H&S pattern?
Still no end to the downtrend yet.
Probably need to wait another 12 months to see.
If the BOE further reduce interest rates, this will help its cost of capital.

Decoding German DAX: Crucial Levels and Emerging PatternsFX:GER30
Current Market Overview
Explore the latest insights into the German DAX index with a focus on pivotal support, resistance levels, and potential trading patterns.
Support and Resistance Levels
Support at €21,105: This level acts as a critical neckline for a potential Head and Shoulders pattern formation. We should watch closely for any breaks below this level, as it could signal further downside movement.
Resistance at €21,557: A new resistance level has formed close to the 61.8% Fibonacci retracement level. This resistance may contribute to forming the right shoulder of a reversal pattern.
Potential Head and Shoulders Pattern
The Head and Shoulders pattern is a key technical formation to watch for:
Formation Details: If the DAX breaks below the neckline/support at €21,105, it could confirm the formation of a Head and Shoulders pattern.
Target Projection: A break below the neckline suggests a potential downside target around €20,452. This level aligns with the weekly fractal resistance previously breached at €20,529, which could act as support.
Happy Trading,
André Cardoso

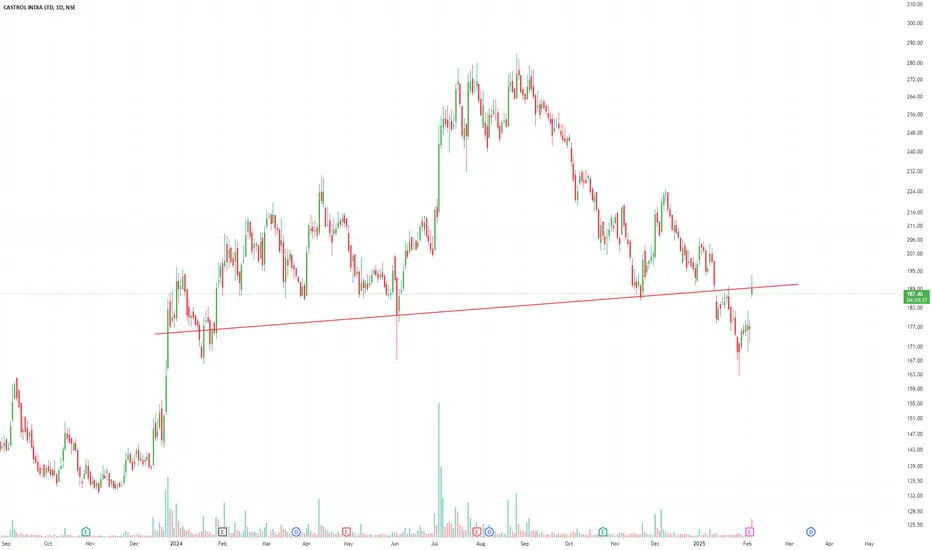
H&S Breakdown and Retest in CASTROLINDNSE:CASTROLIND formed a slightly tilted H&S followed by breakdown and now retest seem to be in progress. Depending on how the day closes, this could be a nice shorting opportunity.
As per the size of head, target would be around 125. However, due to the left side tilt (which reflects lack of extreme weakness), it would be prudent to go with a smaller fall, if at all this materializes.
XRP - Time to buy again!As I mentioned in the previous analysis, the price can form a head and shoulders pattern. If that is happen, expect a significant price increase.
previuos analysis
Give me some energy !!
✨We spend hours finding potential opportunities and writing useful ideas, we would be happy if you support us.
Best regards CobraVanguard.💚
_ _ _ _ __ _ _ _ _ _ _ _ _ _ _ _ _ _ _ _ _ _ _ _ _ _ _ _ _ _ _ _
✅Thank you, and for more ideas, hit ❤️Like❤️ and 🌟Follow🌟!
⚠️Things can change...
The markets are always changing and even with all these signals, the market changes tend to be strong and fast!!

TAO What will happen in the short term ?The price might form a head and shoulders pattern, and after the breakout, it could reach 580.
Give me some energy !!
✨We spend hours finding potential opportunities and writing useful ideas, we would be happy if you support us.
Best regards CobraVanguard.💚
_ _ _ _ __ _ _ _ _ _ _ _ _ _ _ _ _ _ _ _ _ _ _ _ _ _ _ _ _ _ _ _
✅Thank you, and for more ideas, hit ❤️Like❤️ and 🌟Follow🌟!
⚠️Things can change...
The markets are always changing and even with all these signals, the market changes tend to be strong and fast!!

ETH Forms Large Head & Shoulders Bottom, Might Break $4,000 SoonCRYPTOCAP:ETH has completed the right shoulder of a large head-and-shoulders bottom pattern, with the drop almost identical to the left shoulder.
Zooming in, #ETH is currently testing the ascending trendline (marked in pink) that started on 11/14.
In the coming days, watch if it can hold above this line. If it holds, the price could quickly surge past $4,000.
A key level to watch is around $3,331, which is the bottom of the candlestick with the highest recent trading volume.
Although it seems less likely right now, if this level breaks, it's possible that major players might intentionally push the price below the large triangle convergence bottom (marked in yellow) formed since June 2022, further shaking market confidence.
(From August to November last year, there was a similar intentional move, where the price was suppressed along the triangle's lower edge for three months, creating multiple bottoms before a strong rally.)
Follow me for more future price action scripts for different coins!

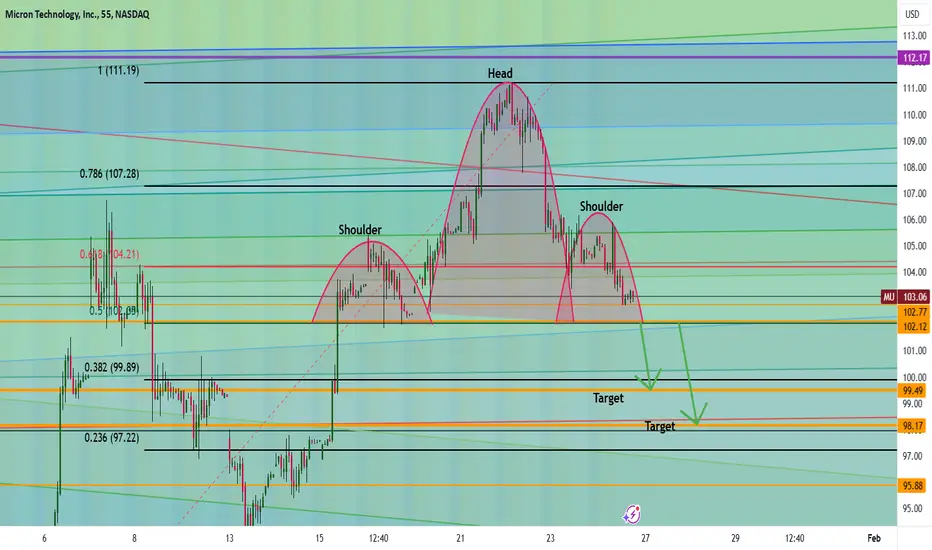
Micron's Next Move: Will $102 Trigger a Drop to $98?Micron (MU) is showing a head and shoulders pattern, and it’s at a critical level. If it breaks below $102, I think we could see it drop to $99.50 or even $98.
This could be a big move, so keep an eye on it!
If this helps, I’d love to hear your thoughts—drop a comment, like, or share. Let’s trade smarter and live better! 💡
Kris/Mindbloome Exchange
Trade What You See
Be careful with EURUSD !!!As you can see, the price has broken the head and shoulders pattern, and now, with a slight correction, the price can grow by the amount equal to AB = CD.
Give me some energy !!
✨We spend hours finding potential opportunities and writing useful ideas, we would be happy if you support us.
Best regards CobraVanguard.💚
_ _ _ _ __ _ _ _ _ _ _ _ _ _ _ _ _ _ _ _ _ _ _ _ _ _ _ _ _ _ _ _
✅Thank you, and for more ideas, hit ❤️Like❤️ and 🌟Follow🌟!
⚠️Things can change...
The markets are always changing and even with all these signals, the market changes tend to be strong and fast!!

JAN. 23, 2025 - BTC (4 HR) ROOF PATTERN ANALYSISJan. 25, 2025 - We're back at it this time on the 4HR time frame. We have a roof pattern playing out and we're going to analyze the possible price action.

ETH copying pattern? Potential drop below $3,000?CRYPTOCAP:ETH seems to be repeating an old pattern—I’ve marked it with an arrow. I first noticed this about 10 days ago, and as time goes on, it’s looking more and more like the left shoulder of a classic head-and-shoulders bottom. Interestingly, the #MACD is perfectly mirroring the same movement too.
If #ETH is indeed forming the right shoulder, we could see a pullback of around 31%, dropping it below 3000 to roughly 2800. This move makes sense, as key players often target psychological levels like 3000, where a lot of stop-loss orders are placed, potentially triggering larger price shifts.
What’s even more intriguing is that a drop to 2800 would push ETH below the lower edge of the symmetrical triangle, which could seriously dent market confidence.
What do you think? Does this match your analysis, or are you seeing it play out differently?
---
Let me know if you'd like further tweaks!

#ETH forming an Inv H&S 1WETH has been forming an inverse head and shoulders pattern since Mar '24. It tagged and has clearly formed a shoulder pattern/line and tagged it on May '24 and again in Dec. '24. When measured from head to shoulder, we show a possibility of an 88.37% increase in price. Target: $7487.

Potential Head & Shoulders Pattern on ATOMUSDT (1D Chart)A Head & Shoulders (H&S) pattern is potentially forming on the ATOM/USDT daily chart, signaling a bearish reversal if confirmed.
---
Pattern Structure
1. Left Shoulder:
- Top: 7.0 USDT
- Bottom: Around 5.8 USDT
2. Head:
- Top Wick: 7.8 USDT
- Bottom: 5.9 USDT
3. Right Shoulder (forming):
- Potential Top: Around 7.0 USDT (symmetrical to the Left Shoulder).
- Bottom: Around 5.8 USDT , completing the neckline.
4. Neckline:
- Slightly downward sloping, connecting the bottom of the Left Shoulder, Head, and Right Shoulder at approximately 5.8-5.9 USDT .
---
Target Calculation
The pattern height is measured from the Head's top wick (7.8 USDT) to the neckline midpoint (5.85 USDT):
- Height = 1.95 USDT
Projecting this distance downward from the neckline (~5.85 USDT):
- Target = 5.85 - 1.95 = 3.90 USDT
---
Potential Trade Setup
Short Trade Plan
1. Entry Points:
- Anticipation Entry: Around 6.5-6.6 USDT , assuming the Right Shoulder is in already in the process of forming.
- Confirmation Entry: Below 5.85 USDT , after a breakdown of the neckline.
2. Stop-Loss:
- Place a stop-loss at (tight stop-loss) or just above (slight margin) the Right Shoulder top at 7.0-7.2 USDT to account for false breakouts.
3. Take-Profit Levels:
- TP1: 4.0 USDT , near a historical support zone.
---
3.9-4.0 USDT as a Potential Buying Zone
- The 3.9-4.0 USDT range aligns with the measured target of the Head & Shoulders breakdown and is a strong support zone historically.
- Long-term investors can monitor this range for accumulation
---
Key Observations
1. Volume Confirmation:
- Watch for high sell volume during the breakdown of the neckline ( 5.85 USDT ) to confirm bearish momentum.
2. Reversal Risk:
- A daily close above **7.2 USDT** invalidates the H&S pattern, signaling bulls may regain control.
3. Patience is Key:
- Wait for the Right Shoulder to complete and the neckline to break before fully committing to short trade.
---
Summary
ATOM/USDT is showing a potential Head & Shoulders pattern , with a bearish target of 3.9-4.0 USDT . This range could also act as a strong buying opportunity for long-term investors.

(WTI Crude Oil) US oil Short - 1.62RR - Head And ShoulderTrade Idea: Short US Oil (WTI Crude Oil)
Analysis:
Head and Shoulders Pattern: The Head and Shoulders pattern is a classical reversal pattern that typically forms after an uptrend and indicates a potential trend reversal to the downside. In this case, the presence of a Head and Shoulders pattern on US Oil suggests a possible reversal from bullish to bearish sentiment.
Technical Indicators:
Confirmation: Look for additional technical indicators or chart patterns to confirm the potential reversal signaled by the Head and Shoulders pattern. This could include bearish divergence on oscillators like RSI or MACD, bearish candlestick patterns, or a break below key support levels.
Trade Setup:
Entry: Place a sell stop order below the neckline of the Head and Shoulders pattern. The neckline acts as a key support level, and a break below this level confirms the pattern's completion and the potential downtrend continuation. Ensure the entry is triggered only when the price breaches the neckline.
Stop-loss: Set the stop-loss order above the recent swing high or above the right shoulder of the Head and Shoulders pattern to protect against potential losses if the price reverses unexpectedly. Place the stop-loss level outside of the pattern to avoid being stopped out by normal market fluctuations.
Take-profit: Determine the take-profit target based on key support levels, Fibonacci extensions, or a favorable risk-reward ratio. Consider scaling out of the position as the trade progresses to lock in profits.
Risk Management:
Position Size: Calculate your position size based on your risk tolerance and the distance between your entry point and stop-loss level, ensuring that you only risk a predetermined percentage of your trading capital per trade.
Risk-Reward Ratio: Aim for a risk-reward ratio of at least 1:2 or higher to ensure that potential profits outweigh potential losses.
Conclusion:
With the formation of a Head and Shoulders pattern indicating a potential reversal to the downside for US Oil, a short position presents a favorable trading opportunity. However, always conduct thorough analysis, practice proper risk management, and remain vigilant for any unexpected market developments.

BTC Correction Incoming? Key Support Zones to MonitorOver the past 50+ days, Bitcoin has been consolidating within a well-defined range, with the all-time high (ATH) at 108K marking the upper boundary and 90K as the lower boundary. The current price action has formed a Head and Shoulders pattern, with the neckline positioned around 90K.
Volume and Recent Price Action
Volume has notably decreased compared to the elevated levels seen in November and December 2024, signaling weakening momentum.
Price rose significantly to 102.7K, reaching the 0.666 Fibonacci retracement level of the current downtrend, where it faced a sharp rejection. This rejection led Bitcoin to test the lows around 91.5K.
Key Resistance Levels
97K (POC): The Point of Control (POC) of the current range sits around 97K, which also aligns with the anchored VWAP taken from the all-time high.
98.3K (Fib 0.618): The Weekly Open (wOpen) coincides with the 0.618 Fibonacci retracement of the current downward wave, making it a significant resistance level.
100K (Psychological Level): A critical psychological barrier, also serving as a key level for setting stop-loss orders for short positions.
Short Trade Setup
A short position could be built in the range of 97K-98.3K, with the following parameters:
Stop-Loss: Above 100K.
Target: 84-80K range.
Risk-to-Reward Ratio (R:R): A favorable 3:1 to 4:1, depending on laddered entries.
Key Support Levels and Confluence Zone (80K-83K Region)
The 80K-83K region stands out as a strong support zone due to multiple confluence factors:
1.) Fib Retracement Levels:
0.618 (82.7K): From the swing low of 67K to the ATH of 108K.
0.5 (80.45K): From the broader wave structure (52.5K to 108.35K).
Negative Fib -0.618 (81.1K): From the current downward wave.
2.) Anchored VWAP: Anchored from 6th September 2024, currently aligning with the 82K level.
3.) ]Fib Speed Fan (0.618): Taken from the low at 52.5K to the ATH, intersecting with the 80-82K region around mid-to-late January.
Long Trade Setup
The 80K-83K support zone presents a strong opportunity for a long position for those who missed the previous uptrend:
Entry Zone: Between 80K and 83K.
Stop-Loss: Below 78K or lower.
Target: 90K, which aligns with the neckline of the Head and Shoulders pattern.
Risk-to-Reward Ratio (R:R): Approximately 2:1 if entering from the 80K level.

BTC (1D) HEAD & SHOULDERS, DBL BOTTOM, DRAGON PATTERN!!!!!!!January 15, 2025 - Analyzing the 1D Bitcoin chart. We've got several patterns playing out . Let's review them 1 by 1.

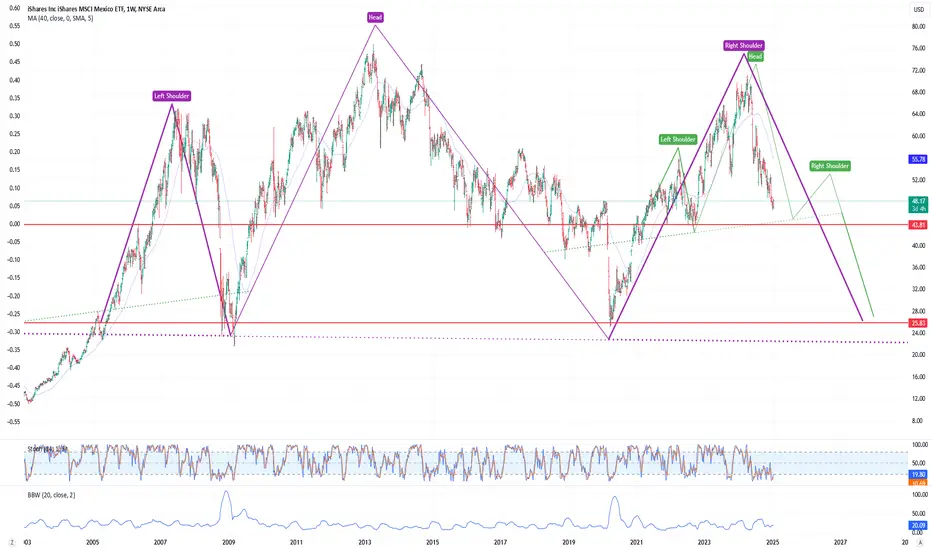
EWW - Another Long-Term ViewThe new president tauted her first 100 days in office mexiconewsdaily.com yet the stock remains in a downtrend. On a chart pattern look, it appears that we are in the midst of a larger-term Right shoulder of a massive head and shoulders formation.
The shorter-term formation also appears to be a head and shoulders formation with the neckline coming in just below 44. From there, it could pattern out the right shoulder before dropping again below 30.
Trump hasn't even taken office yet and Mexico is feeling the pain. While things might turn around, it's hard to feel positive in a socialist political environment. Should interest rates in the US continue to rise, negatively affecting US stocks, EWW tumbling down to the $30 level wouldn't be too much of a surprise.
$BTC Heads and Shoulders Pain Til Inauguration Close your eyes for the next 7 days, then blink ;)
Papa Trump coming to save us

Head & Shoulder on LINK - > Price will go downif the H&S is confirmed with BItcoin leading the path, Target should be around 15$
