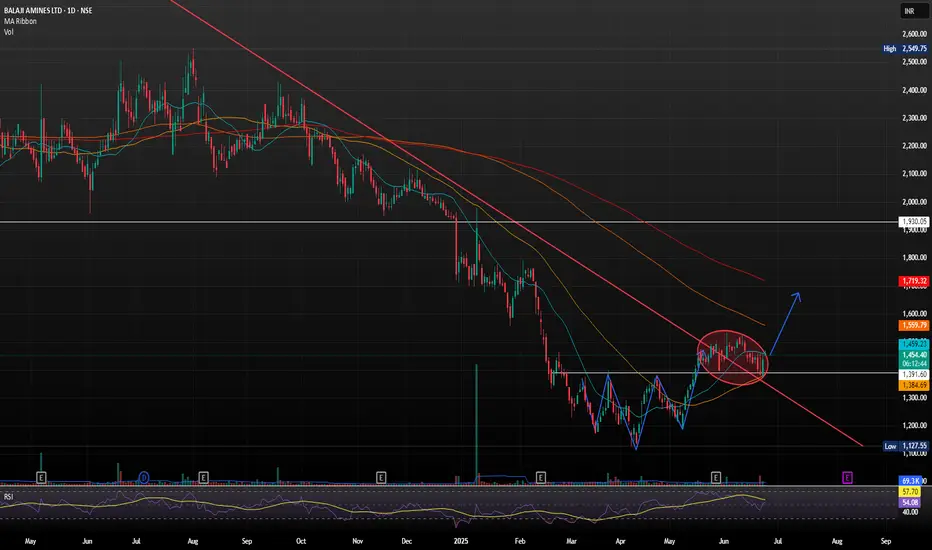
BALAJI AMINES PURE REVERSAL ON CHART.Balaji Amines Ltd. is a leading Indian chemical manufacturing company, primarily engaged in the production of methylamines, ethylamines, and their derivatives, along with specialty chemicals and pharma excipients. It holds a strong position in the aliphatic amines segment and is even the sole producer of certain specialty chemicals in India.
INVERSE HEAD & SHOULDER BREAKOUT AND CONSOLIDATION AT PULLBACKS SHOWS STRONG MOMENTUM FOR UPWARDS
A breakout above 1486 could trigger momentum toward 1524 and beyond towards 1775-1906
On the downside, keep an eye on support near 1330–1358.
Head and Shoulders
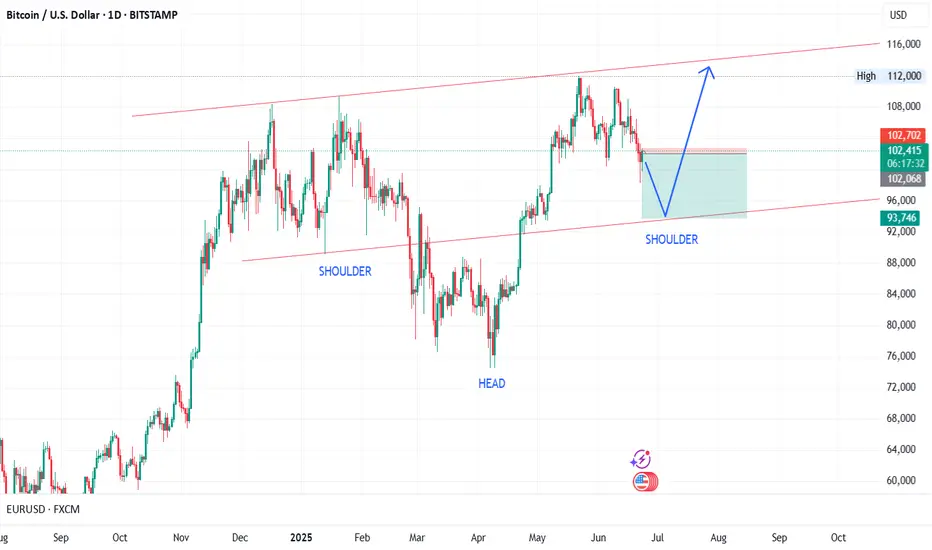
BTC short because head and shoulders pattern.It shows a baseline with three peaks with the middle peak being the highest. The head and shoulders chart pattern depicts a bullish-to-bearish trend reversal and it signals that an upward trend is nearing its end.
Inverse head and shoulders complete The price has completed the formation of an inverse head and shoulders pattern and is preparing for an upward movement.
The price has already tested the neckline; the breakout above $132 will initiate the bullish trend

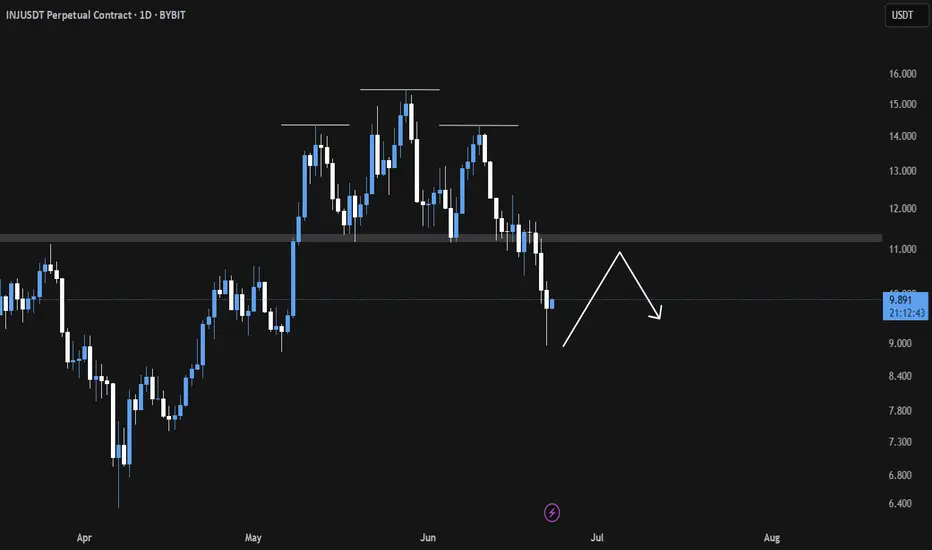
INJ Breakdown in Play Eyeing the Neckline for Precision ShortsINJ/USDT Analysis
〽️ The Head and Shoulders pattern has broken down successfully, confirming a bearish structure.
💠We anticipate a potential relief bounce towards the $11 region which aligns closely with the neckline retest zone. This area is likely to act as a liquidity trap, where institutional sellers may re-enter aggressively 👀.
🎯 Key downside targets remain at
1. $8.98
2. $8.03
3. $6.92
Strategic Plan 🎖️
Look to initiate short positions around the neckline retest near $11, as the risk-reward becomes increasingly favorable from that level.
Trade with discipline. Let the structure lead the execution. 🫡🧠
SOLANA MARKETCAP LOOKS COOKEDIs that a Head and Shoulder's top?
Is #crypto about to endure a Iron dome penetration event?

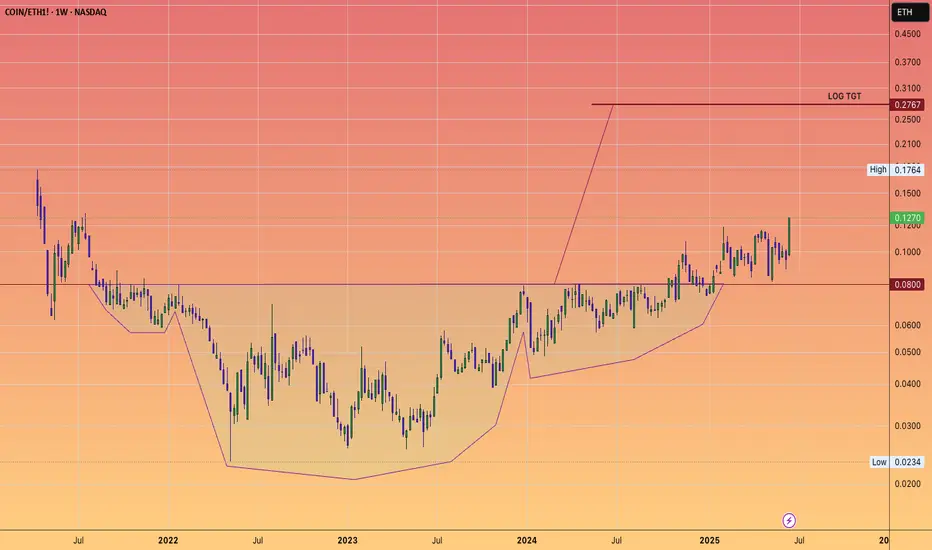
The Chart you don't want to see: Coinbase Vampire attacked ETHBrian Armstrong is a significant influencer in both Silicon Valley and now Washington, D.C., where he is instrumental in shaping legislation and attracting investments that benefit Coinbase and its shareholders.
Vitalik writes blogs and appoints EF directors who appear to have ambiguous gender identities and are quite out there on the spectrum.
Jesse Pollak is yet another astute player who has leveraged ETH's technology to transform BASE into a powerhouse integrating neatly into Coinbase platform for payments and now DEX trading within app.
ETH will thrive.
However, as we've observed, Joe Lubin's return as a public figure to advocate for and steer the future of Ethereum has never been more crucial.
But will it be sufficient to compete with Brian and Jesse? They seem to be operating on a significantly higher plane.
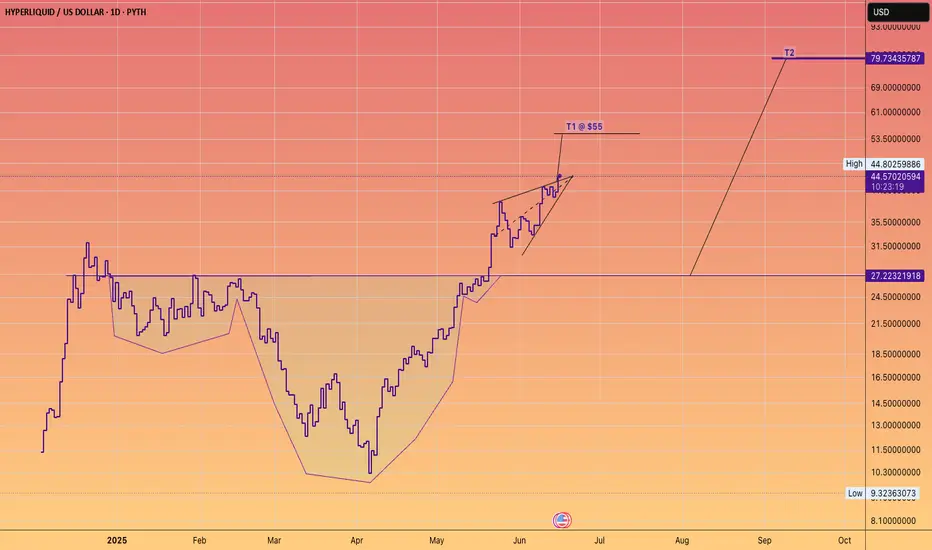
HYPE Long-short-Long planHYPE is good for the short-term long-position at this moment, as it could go as far as 40 from 34.18 to form a Second shoulder.
But it will not sustain over there, and will come down to 22.
There could be another possibility that it may come between 28-29 and form shoulder 2, and then come back to 22.
I will only enter a long position when it takes support from 28 or 22.
Future traders may see short opportunities near 40-41. You will have to wait for price rejection at 40-41.
If it fails these 2 support areas, then I will look for 15-16.

GBPUSD: Bearish After Opening 🇬🇧🇺🇸
There is a high chance that GBPUSD will drop after the market opening.
I see a strong bearish confirmation after a test of a recently broken trend line.
The price formed a head & shoulders pattern and violated its neckline
on an hourly time frame.
Goal - 1.3425
❤️Please, support my work with like, thank you!❤️
I am part of Trade Nation's Influencer program and receive a monthly fee for using their TradingView charts in my analysis.

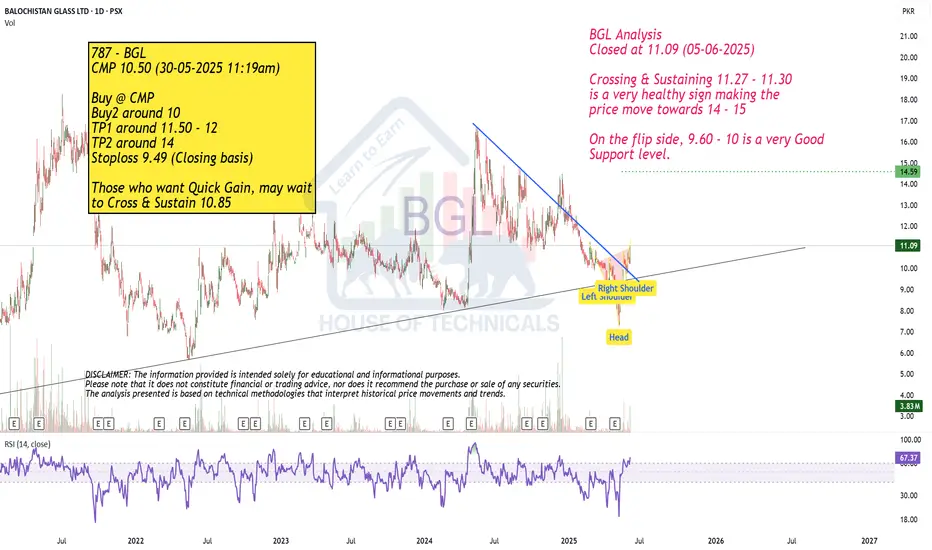
Breakout!
Closed at 11.09 (05-06-2025)
Crossing & Sustaining 11.27 - 11.30
is a very healthy sign making the
price move towards 14 - 15
On the flip side, 9.60 - 10 is a very Good
Support level.
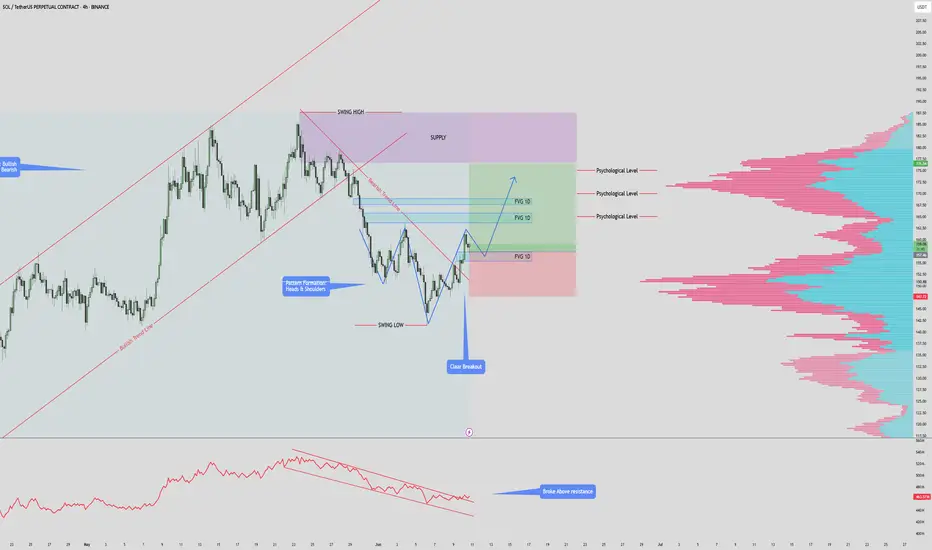
$SOLANA $180 PUMP INCOMINSOL/USDT – 4H Chart Summary
Market Structure:
HTF: Bullish trend remains intact.
LTF: Previously bearish, now showing early signs of a bullish reversal.
Pattern Formation:
Potential Inverse Head & Shoulders forming.
Neckline at $157 — must hold for pattern to complete.
Break above previous high will invalidate Inverse Head & Shoulders.
Trendline & Breakout:
Price has broken above the descending bearish trendline.
Indicates a momentum shift from bearish to bullish.
Fair Value Gaps (FVG):
1D FVG below current price – potential retest & long entry zone.
2x 1D FVG above price – act as targets or supply areas.
Psychological Levels & Volume:
Key levels at $165, $170, $175.
Volume profile shows high liquidity at each of these levels – strong TP zones.
OBV Indicator:
OBV has broken above resistance – supports bullish continuation.
Trade Scenarios:
Bullish Setup:
Long on retest of lower FVG zone ($142–$145).
Target TPs: $165 → $170 → $175 (align with psychological & high-volume areas).
Invalidation:
Break below FVG support or failure to hold above $142.
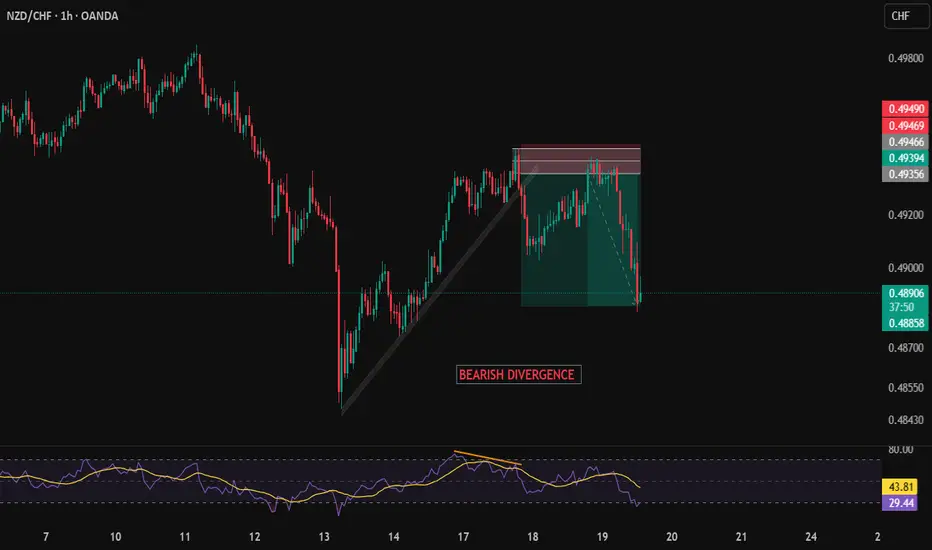
NZDCHFNZDCHF TRADE DONE
Reason behind trendline break down side and also sell stop trigger my entry is missed.
i will define shorter time frame with fib retracement.
ETH | BULLISH Pattern | $3K NEXT ??Ethereum has established a clear bullish pattern in the daily as we're seeing an inverse H&S:
The war issues across the globe must also be considered. So far, it's been bullish for crypto but this can also change overnight since it's a very volatile situation - and crypto being a very volatile asset.
For the near term, I believe ETH is due for another increase - at least beyond the current shoulder. This is IF we hold the current support zone:
It seems to be a bit of a slow burn with ETH for this season's ATH. In the ideal world, we'd either:
📢 consolidate under resistance (bullish)
📢make a flag (bullish)
📢OR smash right through the resistance.
But there's likely going to be heavy selling pressure around that zone.
__________________________
BINANCE:ETHUSDT

GBPUSD Weekly: Price Action at Key Supply Zone Confluence• Long-Term Resistance Zone: The chart displays a significant purple-shaded "Key Level" resistance zone, approximately spanning from 1.3600 to 1.3800. Price has previously reacted to this zone as strong resistance on multiple occasions (e.g., in 2018 and 2021), indicating a historical area of supply. The current price action shows the market testing this zone once again.
• Bullish Market Structure from 2022 Lows: Following a substantial decline through 2022, the GBPUSD pair initiated a strong recovery, characterized by a clear sequence of higher highs and higher lows since late 2022. This upward movement is encapsulated within a robust green ascending trend channel, signifying a dominant bullish bias on this timeframe.
• Identified Support Areas: A notable support zone is evident around the 1.2100-1.2200 levels. This area has historically acted as a strong demand zone, providing significant bounces for the price, most recently in late 2022 and early 2024.
• Current Price at Critical Confluence: Price is currently situated at the upper boundary of its long-term ascending trend channel and is simultaneously interacting with the established "Key Level" resistance zone. This confluence of technical elements suggests a pivotal point for the pair, where a decisive reaction from either buyers or sellers is anticipated.
Disclaimer:
The information provided in this chart is for educational and informational purposes only and should not be considered as investment advice. Trading and investing involve substantial risk and are not suitable for every investor. You should carefully consider your financial situation and consult with a financial advisor before making any investment decisions. The creator of this chart does not guarantee any specific outcome or profit and is not responsible for any losses incurred as a result of using this information. Past performance is not indicative of future results. Use this information at your own risk. This chart has been created for my own improvement in Trading and Investment Analysis. Please do your own analysis before any investments.

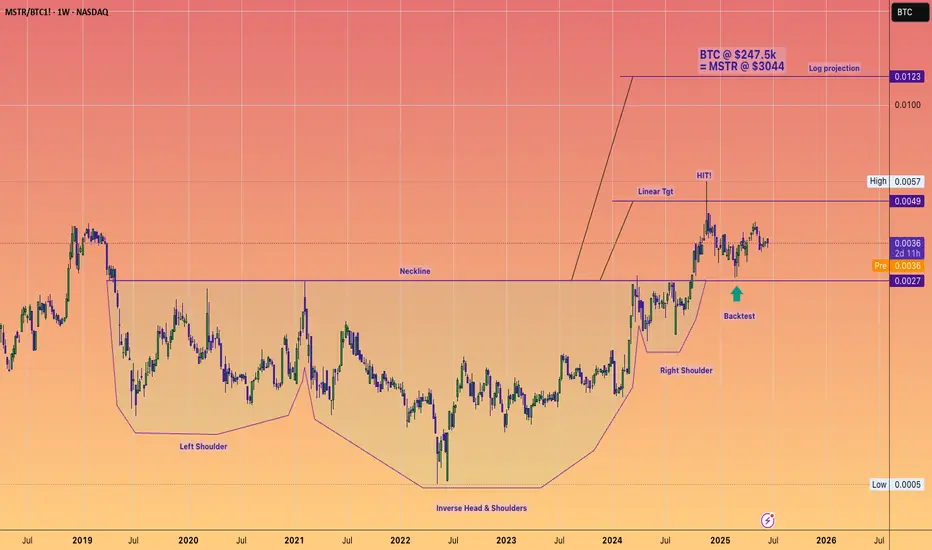
Could Microstrategy be a 1 Trillion dollar mcap company?!Microstrategy and Michael Saylor evoke a spectrum of opinions, with analysts offering a diverse range of potential future valuations.
High risk, high reward!
The destiny of Microstrategy’s market capitalization is clearly linked to Bitcoin’s performance. The company has been utilizing debt to acquire the cryptocurrency, aiming to create significant spreads. This leverage is the reason why the stock has significantly outperformed Bitcoin throughout 2024.
I am confident that Bitcoin can indeed reach $200k, with a potential upper price target of $250K for this cycle, indicating a potentially explosive Q3 and Q4.
The lingering question is how much additional FOMO and premium Saylor can cultivate for his leveraged vehicle in such an environment?
That's why charting is such a key component to any personal investing strategy IMHO, as we navigate these markets.
GBPCHF: Another Nice Setup to Sell📉GBPCHF could continue to decline after testing a significant daily resistance level.
As a confirmation signal, I spotted a head and shoulders pattern
on that on an hourly time frame.
The price may drop to at least 1.0971, followed by 1.0939 support.

SWING SHORT AUDCHFon weekly price back to weekly OB and last weekly candl was bearish
On Daily price engage in Daily SIBI but failed to give as reaction and last day
Price take PCH as liquidity after no reaction from Daily FVG
Last day was respected candle to downsides > that lead me to bearish BIAS
so in 4H was my entry point from 4H FVG
My SL above SWING HIGH

Netsol - Inverse H&S into playNetsol is in its buyback phase which is about to be over in June.
Inverse H&S is in play where it hit its daily pivot level. If it now makes a higher high and higher low, 2nd shoulder will be confirmed. Alternatively, it may hit 123 (bottom of its first shoulder) before going upward. Upside short term target will be 183.

GBPCHF Massive Sell??once the head and shoulder on H1 breaks, all we gotta worry about is this weeks fundamentals.

EURGBP upside target 0.8600On the daily chart, EURGBP stabilized after the bullish bat pattern. At the same time, the current market formed a head and shoulders bottom pattern. At present, we can pay attention to the support near 0.8450. If it falls back and does not break, it is expected to continue to rise, and the upward target is around 0.8600.

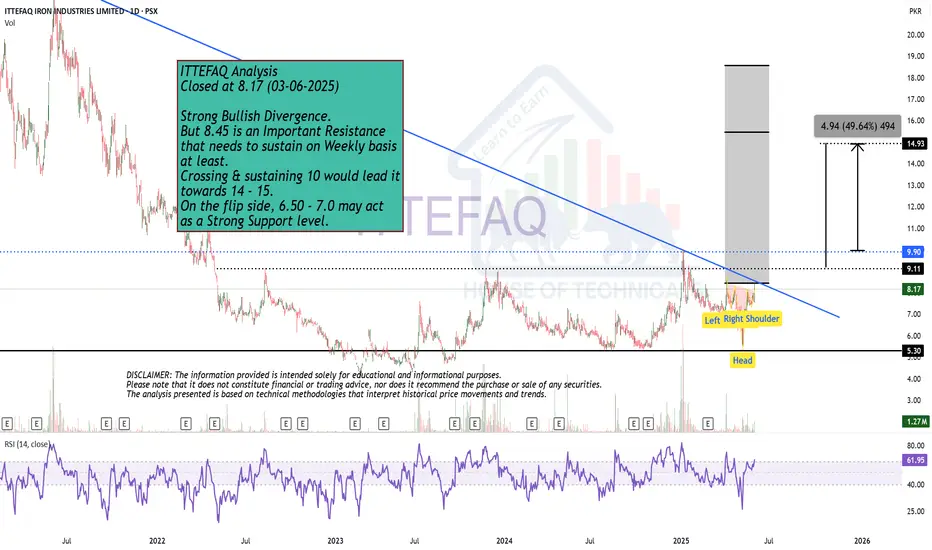
Strong Bullish Divergence. Closed at 8.17 (03-06-2025)
Strong Bullish Divergence.
But 8.45 is an Important Resistance
that needs to sustain on Weekly basis
at least.
Crossing & sustaining 10 would lead it
towards 14 - 15.
On the flip side, 6.50 - 7.0 may act
as a Strong Support level.
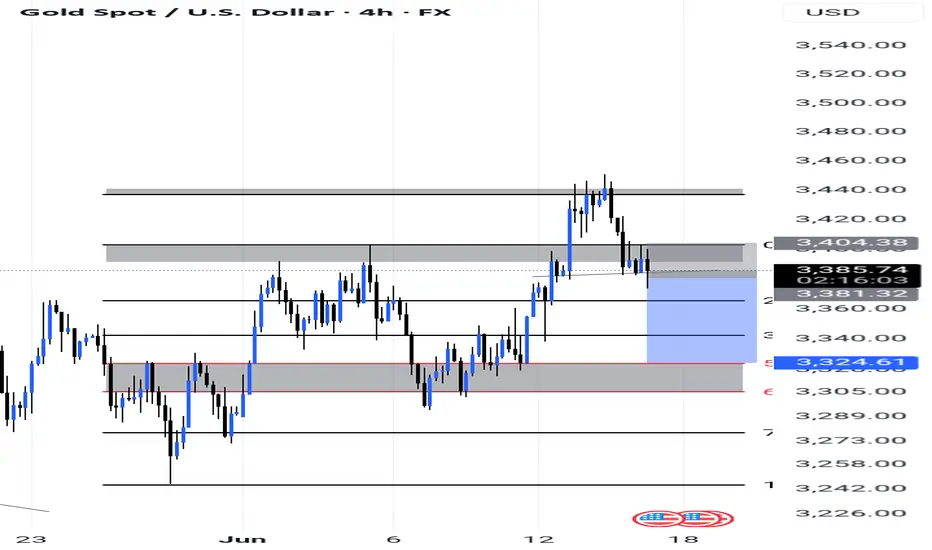
Short postionThe chart suggests a bearish setup, expecting price to drop from the current resistance.
Multiple support and resistance levels are drawn to identify reaction zones.
The price recently broke below a zone and might be retesting it (potential confirmation for a sell).
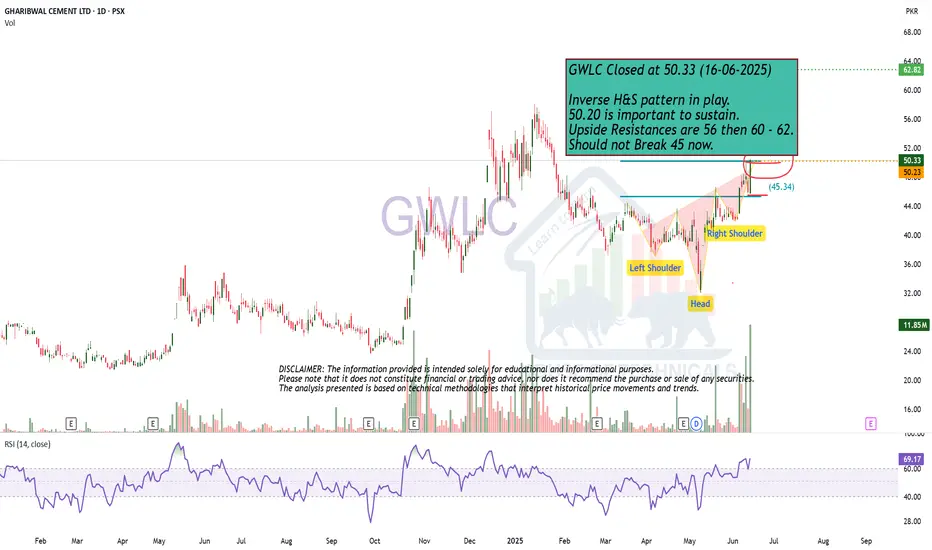
Inverse H&S pattern in play.GWLC Closed at 50.33 (16-06-2025)
Inverse H&S pattern in play.
50.20 is important to sustain.
Upside Resistances are 56 then 60 - 62.
Should not Break 45 now.
Don't fight the HYPE train!The James Wynn saga was wonderful advertising for the platform.
(Maybe it was staged).
Either way #Hyperliquid goes higher.