Bitcoin - Inverse Head & Shoulders on 4h (Neckline broken)Looking forward to a new ATH shortly IF the neckline holds.
BITSTAMP:BTCUSD
BINANCE:BTCUSD
COINBASE:BTCUSD
CRYPTOCAP:TOTAL
CRYPTOCAP:OTHERS
BINANCE:ETHUSD
COINBASE:ETHUSD
BINANCE:SOLUSD
OANDA:XAUUSD
FX_IDC:XAUUSD
Head and Shoulders

STRK/USDT Breaks Key Support !STRK/USDT has broken down from a clear Head and Shoulders pattern and is now trading below the critical support zone of $0.1234–$0.13, which has flipped into a key resistance area.
Unless price reclaims and closes firmly above this zone, long positions should be avoided. Traders may consider light short positions with tight risk management, ideally placing stop losses just above the upper boundary of the former support range.

There is another Bearish BPR zone below the current price.BTC/USDT Market Update – Clear, Detailed, and Easy to Understand (Even for Beginners)
Let’s take a look at what’s happening with Bitcoin (BTC/USDT) right now explained in a way that even someone new to trading can follow along and understand.
Recently, Bitcoin hit a new high it was climbing up steadily. But then, due to negative global news related to war, the market took a hit and started dropping sharply.
Currently, BTC is trading at a (BPR) this is a technical area that often acts as a strong resistance zone, where the price tends to face rejection and reverse.
👉 Right now, Bitcoin is struggling to move higher and appears to be getting rejected from this BPR level.
But here’s where it gets more interesting:
🔻 There is another Bearish BPR zone below the current price, and the market has already touched that zone once before bouncing upward.
So what's the current situation?
📍 If Bitcoin is able to break above the current Bearish BPR (the level where it’s trading now) — it would be a bullish sign, and the market may start rising again.
📍 However, if BTC fails to break this resistance level, then we could see another strong move to the downside, possibly heading back to lower support zones.
🚨 Key Takeaway:
This level — the one BTC is currently interacting with — is very important.
📌 Traders should keep a close eye on it.
📌 Let the market reveal its direction before making any decisions.
Remember:
⚠️ This is not financial advice. Always Do Your Own Research (DYOR).

Circle’s IPO and the Crypto Listing Wave: The Market EntersOn June 14, 2025, the U.S. stock market witnessed a pivotal moment for the crypto industry. Circle, issuer of the USDC stablecoin and a major player in the sector, successfully went public. Shares opened at $31 and soared to over $134 by the end of the first trading day—an explosive 330% gain.
This isn’t just a one-off success. It marks the beginning of a new chapter: the public crypto era, where leading crypto companies are stepping into the spotlight of traditional finance.
Why It Matters
Circle’s IPO signals the maturation of the crypto market. Just three years ago, crypto companies were seen as high-risk, unregulated tech startups. Now, they’re structured fintech firms with clear business models, institutional backing, and regulatory compliance.
Who’s Next in Line
Following Circle, a wave of major crypto firms is preparing for their own IPOs:
eToro – the social trading platform with crypto features has finalized its SPAC merger and is set to debut on NASDAQ.
Gemini – the exchange founded by the Winklevoss twins filed for an IPO in mid-May.
Galaxy Digital and Ripple – both confirmed listing plans for the second half of 2025.
Kraken is exploring a listing in Europe, where requirements are more flexible than in the U.S.
These companies are waiting for the right moment—regulatory clarity, growing interest in crypto ETFs, and progress in U.S. Congress (with the CLARITY and GENIUS bills gaining momentum).
What It Means for the Industry
Increased Investor Trust – Public companies must disclose financials, pass audits, and comply with regulations. This builds confidence in the broader crypto sector.
Institutional Capital Inflow – IPOs unlock access to capital from pension funds, hedge funds, and asset managers that cannot invest in private crypto startups.
Marketing Power – Going public draws media attention and boosts brand awareness. Every IPO is a PR win for the entire industry.
Risks and Challenges
Regulatory Uncertainty – Despite progress, the SEC could change direction, especially with potential political shifts.
Overvaluation Concerns – Circle’s stock is already raising eyebrows, with a P/E ratio over 200 and trading volume growing faster than revenue.
Crypto Market Dependency – If crypto prices crash, the valuations of these companies could quickly collapse.
What’s Next
Expect up to 10 more crypto IPOs over the next 6–12 months, including players in DeFi, blockchain infrastructure, and Web3. This is the next stage in crypto’s journey toward mainstream legitimacy.
What was once the domain of tech rebels and early adopters is now becoming a business—with a stock ticker and quarterly earnings. And that changes everything.

DOW - H&S is getting progressed. 📉 DOW JONES – Head & Shoulders Pattern Formation (Right Shoulder in Progress)
The chart illustrates a clear Head & Shoulders (H&S) pattern, a classic bearish reversal signal, forming on the higher timeframe.
🧠 Pattern Breakdown:
Left Shoulder: Formed in early March.
Head: Sharp dip and recovery formed during early April.
Right Shoulder: Currently in the making, aligning with a weekly resistance near 42,880 levels.
Price is expected to reject this resistance and complete the right shoulder.
📌 Technical View:
Strong rejection expected near the weekly horizontal resistance.
If the right shoulder completes and breaks below the neckline (around 41,500–41,600), it may trigger a measured fall.
Fibonacci levels also align, with the 0.382 and 0.5 retracement acting as potential reaction zones.
🎯 Target:
Target: 40,900 levels (Right Shoulder support zone).
This is a confluence zone where buyers may reappear.
Also forms a neckline test, critical for breakout confirmation or reversal.
🔔 Trade Setup Insight:
Short bias activated near 42,880 resistance zone.
Watch for confirmation via bearish engulfing candles or lower time frame breakdowns.
Targeting 40,900 initially. Further downside possible if neckline breaks decisively.
⚠️ Disclaimer:
This analysis is for educational purposes only and does not constitute investment advice or a recommendation. All trading involves risk. Please perform your own due diligence or consult a certified financial advisor before making trading decisions.

6/13 Gold Analysis and Trading SignalsGood morning, everyone!
Gold rallied to around $3399 during yesterday’s session, accurately reaching our preset sell zone at 3385–3403. Since then, the market has started pulling back, and today’s opening shows signs of accelerated downside movement. However, there are several strong support zones below, with immediate focus on 3378–3368, and further support around 3352–3343.
📉 Technical Outlook:
The current price action suggests the potential formation of a Head and Shoulders pattern. If confirmed, this could trigger a deeper correction towards 3340–3330. A break of these levels would significantly weaken the current bullish structure and open further downside risk.
🌍 Fundamental Drivers:
Today’s inflation-related data releases may add significant volatility;
Additionally, stay alert to any developments in the Middle East geopolitical situation, which could quickly shift market sentiment toward risk-off if escalations occur.
📌 Today’s Trading Recommendations:
✅ Sell Zone: 3410–3420
✅ Buy Zone: 3338–3326
🔄 Intraday Key Reaction Levels:
3403 / 3378 / 3362 / 3355 / 3343
🔒 Recommendation: Market is at a technically sensitive zone. Consider entering positions in batches and maintain strict risk control.

BTC: Elliot Cycle AnalysisA simple Elliot wave analysis of BTC's cycle. I predict we top out between 140-190k, before entering a bear market that will last ~12 months, likely ending early 2027. I can imagine that we form a massive H&S before we decline.
I believe the widespread adoption of crypto, BTC reserves, ETFs, etc. will serve as a bulwark against too harsh a winter. We perhaps drop to the 56k support, which would be an excellent buy-back opportunity.
Prepare to exit the market and remain tethered up for about a year or so. Don't get greedy. Things are gonna heat up real soon for the broader market.
Happy trading,
Melonfarmer

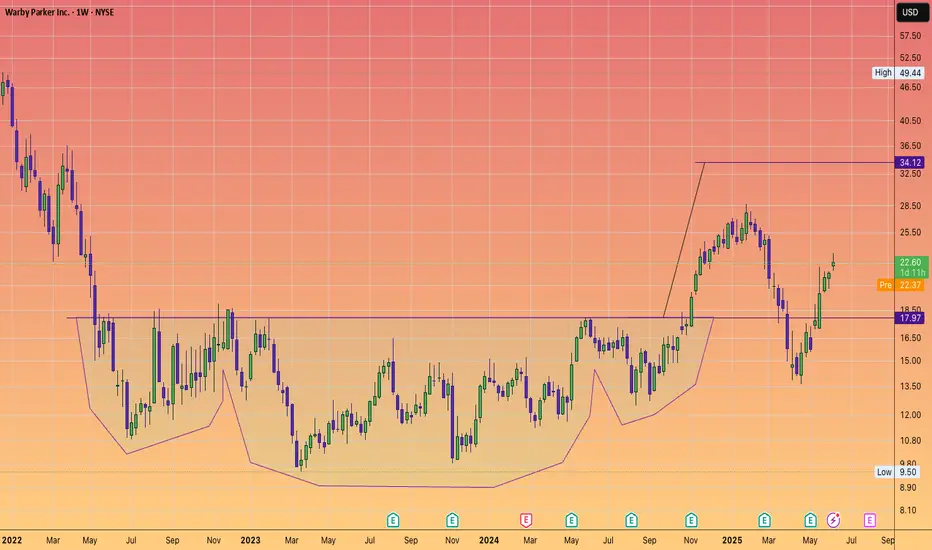
WARBY PARKER to continue its recovery to $34 and beyond#inverseheadandshoulders
They want to have 900 retail locations
currently operating 271 in the US and 5 in Canada.
EURGBP - Inverted Head and ShouldersHello Traders !
The EURGBP price formed an inverted head and shoulders pattern.
Currently, The neckline is broken !
So, I expect a bullish move🚀
______________
TARGET: 0.85110🎯

Altcoins (Market Cap) - Excluding Top 10 Coins - Inverted H&SBullish setup on the daily chart. CRYPTOCAP:OTHERS have once again made a inverted head & shoulders pattern which is a bullish reversal pattern. With the yellow chart below showing the Global M2 Liquidity index breaking out aswell. With more money in circulation, the propabilty is that more money will enter the market over time. Although, there can be latency.
For now I will trust the patterns in the chart of Others and follow it to see IF we can confirm the Inverse H&S. We have to break the neckline which should be around 310-325 B for June and July. But still, after that we need a pullback to confirm that neckline and make it support for continueation.
It´s a very interesting world right now. And much can happen. But IF this break out. It would probably be one of the most explosive bull markets to remember for a long time.. I myself are holding quality coins and tokens. Im not in memecoins, whats so ever. With the adoption happening right now in crypto I don´t believe that is the right market to be in right now.
Nothing on this profile should be interpreted as financial advice. Always do your own research and investment decisions. Im only expressing my thoughts and beliefs. Nothing else. Crypto is a risky business but It also has a lot of reward If being right. I can´t find equal yield in any other markets for now. If you know any, plz comment below =)
BINANCE:BTCUSD
CRYPTOCAP:OTHERS
CRYPTOCAP:TOTAL
MARKETSCOM:ETHEREUM
BINANCE:SOLUSD
BINANCE:SUIUSD
ICEUS:DXY

Inverse H&S Breakout! EURGBP Eyes Resistance Zone Amid Eurozone EURGBP ( OANDA:EURGBP ) is moving between two Support zone(0.83870 GBP-0.83500 GBP) and Resistance zone(0.8511 GBP-0.8470 GBP) .
In terms of Classic Technical Analysis , EURGBP has managed to break the Neckline of the Inverse Head and Shoulders Pattern .
I expect EURGBP to rise to at least 0.84911 GBP and attack the Resistance zone(0.8511 GBP- 0.8470 GBP) .
-----------------------------------------------------------
EURGBP Fundamental Analysis:
1. Eurozone (EUR) Overview :
The Eurozone economy has shown moderate recovery signs after pandemic disruptions.
Inflation remains a concern, but the European Central Bank (ECB) is expected to maintain or even tighten monetary policy gradually to combat inflation.
Economic data such as GDP growth and industrial production are mixed but generally indicate slow growth.
Political stability in the Eurozone is relatively steady compared to the UK.
The ECB’s forward guidance leans towards cautious optimism, supporting EUR strength over time.
2. United Kingdom (GBP) Overview :
The UK economy faces several challenges, including slower growth prospects compared to the Eurozone.
Inflation has been high but the Bank of England (BoE) has been raising interest rates aggressively to control it.
Political uncertainties related to Brexit aftermath, trade deals, and fiscal policies have created some volatility.
Consumer confidence and retail sales have shown signs of weakness in recent months.
Overall, the BoE’s hawkish stance is strong, but economic fundamentals are less robust compared to the Eurozone.
3. Comparative Factors Favoring EUR Long :
The Eurozone's relatively better economic stability and growth prospects support EUR strength.
UK economic challenges and political uncertainties weaken GBP.
ECB’s more gradual tightening approach may prevent shocks, making EUR attractive.
Brexit-related trade issues continue to pose risks for GBP.
4. Risks to Consider :
Unexpected ECB dovish moves could weaken EUR.
Positive UK economic surprises or faster-than-expected BoE tightening might strengthen GBP.
External shocks like geopolitical tensions can affect risk sentiment, impacting both currencies.
-----------------------------------------------------------
Note: Stop Loss(SL)= 0.84221 GBP
Euro/British Pound Analyze (EURGBP), 4-hour time frame.
Be sure to follow the updated ideas.
Do not forget to put a Stop loss for your positions (For every position you want to open).
Please follow your strategy; this is just my idea, and I will gladly see your ideas in this post.
Please do not forget the ✅' like '✅ button 🙏😊 & Share it with your friends; thanks, and Trade safe.

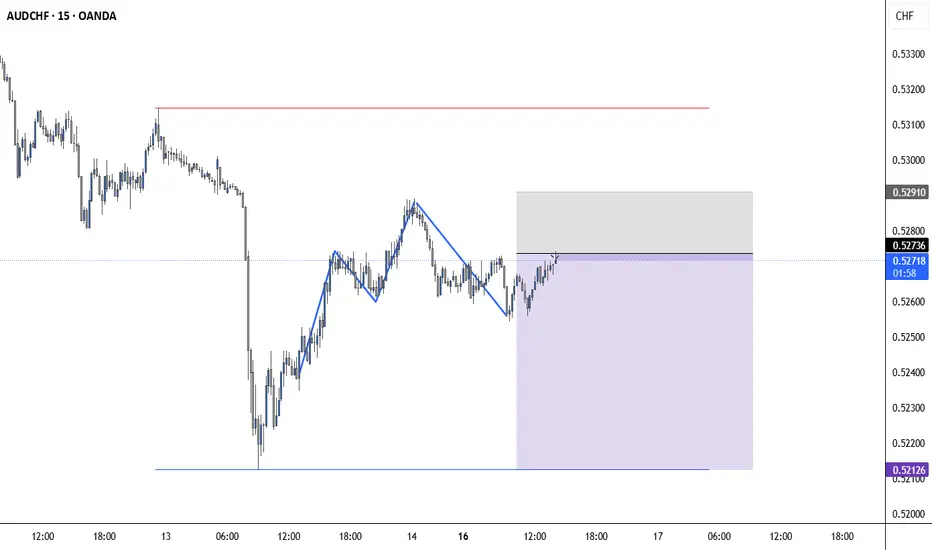
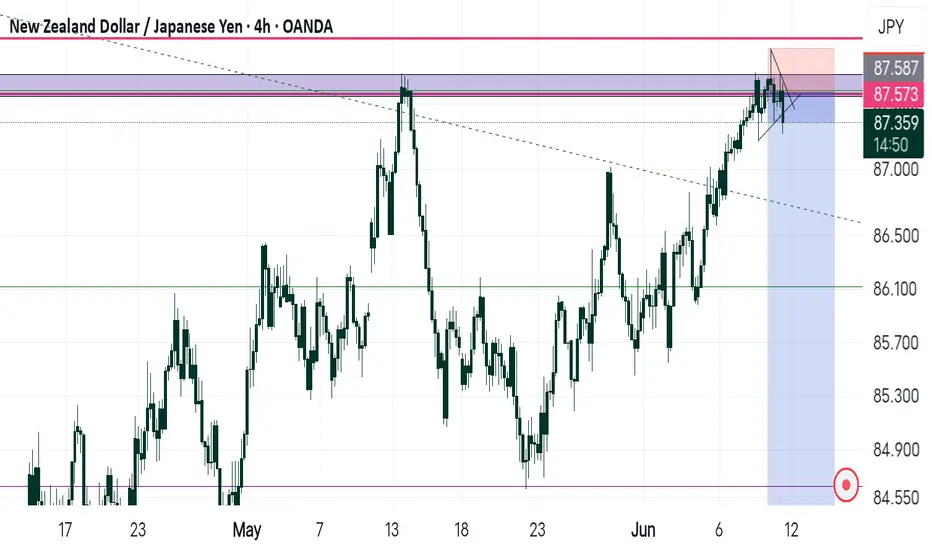
NZDJPY SHORTSNzdjpy is about to drop in my opinion to atleast another 200 pips and i entered quite early tho so i might either just watch and scale in as it drops but it already tested previous supply and formed head and shoulder pattern and broke my inverted trendline confirming drop...an it might take a couple weeks to fulfil so lets see... Follow @IAMWHITELIONFX for more analysis....
NEW ATH Quick flush down to 100K done, tbh was thinking it could drop to 90K but then again price action is king and I've got to go with the flow.
Not a confirmed breakout to all-time highs yet but will happen.
continuation of uptrend 🔒.
BITSTAMP:BTCUSD

6/11 Gold Analysis and Trading SignalsGood afternoon, traders!
Gold remains capped below the key resistance at 3350, with repeated failed breakouts. Meanwhile, strong support zones below are keeping the price range-bound in a narrow consolidation channel.
📉 Technical Outlook:
As higher lows continue to form, the trendline support is gradually shifting upwards. On the 30-minute chart, we now observe a potential double top pattern forming. If confirmed, it would signal a bearish reversal with the possibility of further downside.
🔍 Key Support Levels:
Watch for the 3330 level as initial support. If it’s broken decisively and the market fails to recover quickly, this may confirm the short-term double top and open the door for more aggressive selling.
On a broader timeframe, focus on 3320 as a critical support area.
📊 Fundamental Focus:
The key event today is the release of U.S. CPI data, which carries significant market-moving potential. A strong reading could be bearish for gold, supporting a shift in sentiment toward the downside.
📌 Today’s Trading Plan:
✅ Buy Zone: 3289–3272
✅ Sell Zone: 3358–3373
🔄 Intraday Levels for Flexible Scalping:
3348 / 3332 / 3319 / 3307 / 3293
Trade cautiously ahead of the CPI report, and keep position sizes moderate to mitigate volatility risk.

ADM | Inverse Head & Shoulders + Parallel Channel = Reversal📍 Ticker: NYSE:ADM (Archer-Daniels-Midland Company)
📆 Timeframe: 1D (Daily)
📉 Price: $48.74
📊 Volume: 2.82M
📈 RSI: 54.80 (Momentum building)
🔍 Technical Setup:
NYSE:ADM is completing a textbook Inverse Head & Shoulders at the bottom of a rising channel, hinting at a structural reversal.
🟢 Green arrow signals current buying opportunity
🔺 Red arrows highlight expected resistance zones on the way up
🟣 Channel provides a clean roadmap for a stair-step recovery structure
Pattern Highlights:
Well-defined L–H–R shoulders
Price reclaiming the midline of the channel
RSI recovering above 50, signaling shift in momentum
🧠 Trade Plan & Price Targets:
✅ Entry Range: $48.50–$49.00
❌ Stop-Loss: Close below $46.00 (invalidation of channel + pattern)
🎯 Target 1: $52.50
→ 📈 Return: +7.7%
🎯 Target 2: $56.50
→ 📈 Return: +15.9%
🎯 Target 3: $63.00
→ 📈 Return: +29.3%
⚠️ Technical Notes:
Pattern is visible across multiple timeframes — weekly structure aligns with daily bullish reversal
RSI breakout + neckline test = potential breakout confirmation
Earnings volatility in rear-view mirror – momentum favored near-term
💬 Is ADM finally turning the corner after months of weakness?
📌 Like & Follow for more structured swing setups!
#TargetTraders #ADM #HeadAndShoulders #ChannelBreakout #SwingTrade #InverseHnS #TechnicalSetup

HE | Inverse Head & Shoulders Breakout Setup / target +13%-56%📈 Ticker: NYSE:HE (Hawaiian Electric Industries)
📆 Timeframe: 1D (Daily)
📉 Price: $10.59
📊 Volume: 1.23M
📈 RSI: 50.96 (Neutral, ready for breakout)
🔍 Technical Setup:
A classic Inverse Head & Shoulders has formed just above the lower boundary of a multi-month parallel ascending channel.
🟩 Key Features:
Symmetrical reversal structure (L–H–R Shoulders)
Horizontal neckline around $12.00
Trading just above channel midpoint with supportive RSI action
🟢 Green arrow marks support near $10.50
🔴 Red arrows signal likely resistance areas
🧠 Trade Plan & Price Targets:
✅ Entry Zone: $10.50–$10.70
❌ Stop-Loss: Below $9.90 (channel breakdown + structure failure)
🎯 Target 1: $12.00
→ 📈 Return: +13.3%
🎯 Target 2: $13.80
→ 📈 Return: +30.3%
🎯 Target 3: $16.50 (upper channel resistance)
→ 📈 Return: +55.8%
⚠️ Technical Notes:
RSI at 51 – neutral zone, ready to build momentum
Volume declining — watch for breakout surge above $11.50
Channel provides structure for swing trades and scaling
💬 Is HE about to energize a trend reversal or flicker out?
📌 Comment your thoughts and follow for more high-conviction setups!
#TargetTraders #HE #Utilities #InverseHnS #BreakoutTrade #SwingTrading #TechnicalAnalysis

TATAMOTORS | Buy above 755 | SL below 700 | 1st Target 940Disclaimer:
This is not financial advice. Please do your own research or consult with a financial advisor before making any investment decisions. Investments in stocks can be risky and may result in loss of capital.

SHORT ON SPY (SPX/USD)SPY has failed to create higher highs and given us a head and shoulders pattern.
I will be selling spy to the next level of demand looking to catch 50-60 points.

INFY | Buy @LTP | SL below 1525 | Targets 1880, 2000Disclaimer:
This is not financial advice. Please do your own research or consult with a financial advisor before making any investment decisions. Investments in stocks can be risky and may result in loss of capital.

EURAUD: Pullback Trade From Support 📉EURAUD appears to be bullish following a test of significant daily/intraday support.
An inverted head and shoulders pattern has formed on the 4-hour chart, and strong bullish momentum observed this morning suggests positive movement.
I believe the market may retrace to the 1.7600 resistance level.

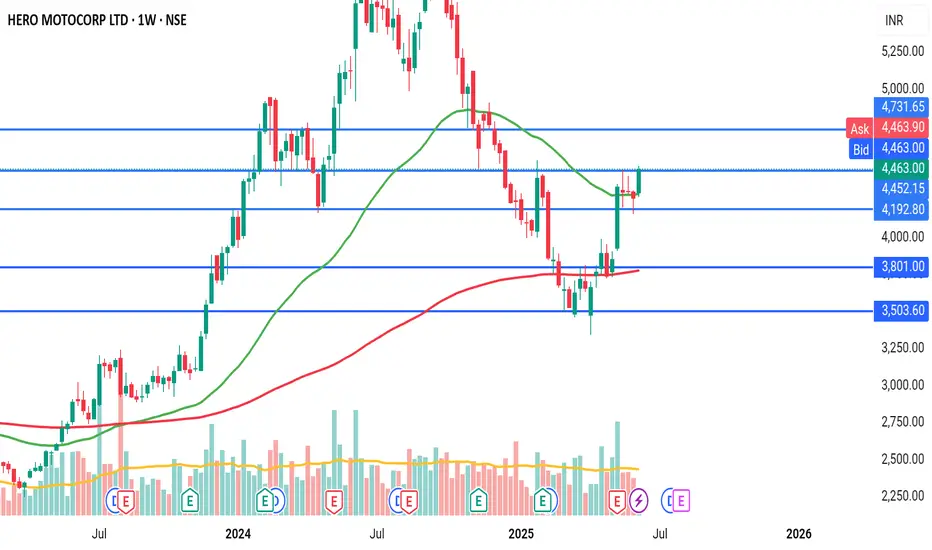
Hero starts heroingBreakout of inverted head and shoulder pattern in weekly timeframe, with big green candle and above average volume.
PayPal: Rebound or Rerun?PayPal in 2025: A breakout with backbone or just another spineless fintech?
PayPal is still in the rehabilitation ward after its fall from grace in 2021. Management drama, growth slowdown — the full fintech fatigue package. But something has shifted behind the scenes. A new CEO is cutting costs, AI integration is being whispered about, and earnings have started to surprise again. Wall Street pretends not to notice — but volume tells a different story.
Technically, we’re looking at a well-formed inverse head and shoulders. The neckline stretches from $72.00 to $74.76, aligning with the 0.5 Fibonacci level. A confirmed breakout above this zone opens the path to a clear target at $93.66 — the 1.0 Fibonacci extension. Multiple EMA clusters and strong pattern symmetry reinforce the setup. But no fairy tales here: the real entry comes after a retest. Without confirmation, it’s just another pretty formation for chart enthusiasts.
