PCG | Potential Reversal Zone at LT Support + Breakdown Retest📍 Ticker: NYSE:PCG (Pacific Gas & Electric Co.)
📆 Timeframe: 1W (Weekly)
💡 Pattern: Head and Shoulders Breakdown → Testing Key Support
📉 Price: $14.79 (as of last candle close)
📊 Volume: 87M
📉 RSI: 32.92 (approaching oversold)
🔍 Technical Setup:
A Head and Shoulders top has completed, with price breaking down below the neckline. However, PCG is now approaching a major confluence zone:
✅ Multi-year ascending trendline support (dating back to 2020)
✅ Previous horizontal support from 2022–2023
✅ RSI nearing oversold (32.9) — potential for bullish divergence
✅ Volume spike on breakdown — possible capitulation
The blue zone marks a potential retest area. If price holds and forms a reversal candle here, a bounce toward $16–$17 is possible (prior support zone).
🧠 Trading Plan:
Bullish Bias: If price shows bullish price action at/above trendline (~$14.40–$14.70)
🟢 Entry Idea 1: $14.75–$14.90
🟢 Entry Idea 2:$13.60–$14.20
🎯 Target 1: $16.20
🎯 Target 2: $17.00
⛔️ Stop1: Close below $14.20 (trendline + neckline invalidation)
⛔️ Stop 2: Close below $12.50 (Bearish Continuation: Close below ascending trendline + neckline = further downside risk toward $12.50)
⚠️ Watchlist Notes:
PCG is defensive (utilities), but often reacts to regulatory/news-driven catalysts.
Recent weakness may offer a risk/reward setup near major support.
RSI bearish structure is weakening — watch for divergence or failed breakdown.
💬 What do you think? Bounce or breakdown from here?
📌 Like & Follow for more setups! #TargetTraders #PCG #HeadAndShoulders #RSI #Utilities #SwingTrade #TechnicalAnalysis
Head and Shoulders

AMD - Inverted Head & Shoulders (Bullish Reversal)Let´s see if we can break the neckline (White trendline) and stay above with a close and possibly a retest on the neckline to confirm this pattern. If so, Im looking for the previous top on daily which is the all time high (So far).
This is not a financial advise. Always do your own research and decision before investing.

6/10 Gold Analysis and Trading SignalsGood afternoon, traders!
Gold continues to move within the predefined trading range from yesterday. Both the short from 3338 and the long from 3306 turned out profitable. Currently, price action is developing into a potential double bottom, with price once again testing key resistance around 3338.
🔍 Key Technical Outlook:
If gold breaks above 3338 decisively, and can hold above 3317 on any pullback, the next bullish target area lies between 3345 / 3352–3368.
However, if price fails to break out, then focus shifts back to the 3303–3286 support zone, which may serve as a potential buy region again.
📉 4H Trend Structure:
On the 4-hour chart, price has already broken below the previous uptrend line.
For the bulls to reclaim control, gold must re-establish above 3350 and sustain momentum. Failure to do so confirms bearish dominance, with the next major support near 3257.
Any weak rebound below key resistance can be treated as a short-selling opportunity.
📊 Macro Focus:
No major economic releases today, but traders should prepare for tomorrow's CPI data, which could be a key driver for gold volatility and inflation sentiment.
📌 Today’s Trading Plan:
✅ Buy zone: 3296–3286
✅ Sell zone: 3348–3358
🔄 Pivot levels for flexible intraday trades:
3343 / 3334 / 3326 / 3318 / 3309 / 3300
Stay cautious, manage position sizes wisely, and be alert for momentum shifts as CPI draws closer.

DOGE | BULLISH Pattern | +100%DOGE is seemingly ready for more upside as we start to see a pattern resembling an inverse head and shoulders pattern:
✅Usually, the Inverse H&S plays out something like this:
📢But the pattern is not quite confirmed just yet. We'd need to see a close ABOVE the current resistance zone to validate the pattern:
If we can see that, it's likely that there can be BIG gains on DOGE. It will especially help if ETH makes more increases, showing that the general alt market is heading in the right direction.
____________________
BINANCE:DOGEUSDT

Inverse Head and Shoulders Now Clear On Bitcoin ChartTrading Fam,
It has now become apparent that Bitcoin has formed an inverse head and shoulders pattern on the daily. This is very bullish and should the pattern follow through, it gives some good long-range targets to shoot for by the end of this year and potentially, well into the next.
Calculating our first target is relatively simple. We draw a measurement from the bottom of the head (that largest dip) to the neckline. We then move that measurement line to an approximated breakout area. This then gives us an estimated target of around 150k. I will say that this is a fairly sure target before the end of the year if and when that neckline is broken to the upside.
Target number two should be that 350 DMA in my opinion. Bitcoin likes to kiss that 350 DMA in bullish markets. So, where ever that ends up being pricewise during this next upwards movement is a good target #2. I would estimate it will be at least 175-180k.
But if we break that 350 DMA to the upside, then you will know the end of our bull cycle is drawing close. Bitcoin may blow-off here and generally would stay above that 350 DMA for at least another month or two. In our last bull cycle it remained above the 350 DMA for 5 and a half months. Selling anytime we are significantly above that 350 DMA pricewise and timewise is not a bad strategy because you will know we are nearing the end of our bull cycle at this point.
I hope this post gives you some good long-term targets and trading strategies going forward. Personally, I will be looking to sell much if not most of my holdings once Bitcoin breaks above that 350 DMA. Of course, as always, I will keep you all posted when that time comes.
Best,
Stew

GBPUSD: Intraday Bullish Reversal📉GBPUSD pair approached a significant horizontal resistance last week.
The price formed a clear head and shoulders pattern, then rebounded and broke below a strong rising trend line.
This indicates considerable selling strength, suggesting that the market may continue to decline.
The next target is 1.3453.

GBPUSD SELL 1.3520On the 4-hour chart, GBPUSD has formed a head and shoulders top pattern. At present, we can pay attention to the resistance near 1.3520. If the rebound is blocked, we can consider continuing to short. The support below is around 1.3420.

USDJPY Long then Short: inverse H&SThis is a follow-up to the USDJPY idea that I posted yesterday. I am seeing an inverse H&S setup that is broken as the video is being recorded.

Indian Market - HCL Tech looking for upside from hereDisclaimer : Do your own research before investing. This is just a chart analysis. No recommendation to buy and sell.
Starting of the year HCL Tech was at nearly Rs. 2000 mark. It came down to nearly Rs. 1302. Now getting consolidating at the current level. I can see an inverted Head and Shoulder Pattern in formation.
If the Market continue to support , it will go up.
I have shared the levels in the chart.

ICICIGI breakout inverse head and shoulders pattern bullish activated
The bullish inverse head and shoulders pattern is a chart formation that signals a potential shift from a bearish trend to a bullish one

BANKNIFTY - 1 Day Time Frame Analysis📈 NSE:BANKNIFTY - 1 Day Time Frame Analysis
This chart shows a classic Inverse Head and Shoulders pattern forming on the daily timeframe of BankNifty. This is a bullish reversal pattern, generally indicating a potential shift from a downtrend to an uptrend.
Left Shoulder: Formed around April 23rd–25th, marked by a short-term low.
Head: The lowest point in the pattern, formed around May 8th.
Right Shoulder: Formed around May 28th, indicating buyers are stepping in earlier, showing strength.
The neckline resistance lies near 55,913, which the price is currently testing. A decisive breakout above this level, with good volume, could signal a further upward move towards the higher resistance zones like 56,526, 56,907, and possibly 57,292.
Key Support Zones:
55,167
54,791
54,479
Traders may look for a daily candle close above 55,913 for confirmation. Risk management is crucial as a failed breakout may lead to a retest of support levels.
TRADE PLAN:
🔹 Entry:
On a daily candle close above 55,913 (neckline resistance).
Preferably with strong volume confirmation.
🔹 Targets (Upside Levels):
Target 1: 56,526
Target 2: 56,907
Target 3: 57,292
🔹 Stop Loss:
Below 55,167 (recent support and right shoulder low)
Conservative traders can use a tighter stop below 55,400 (previous candle low).
🔹 Risk Management:
Use appropriate position sizing (risk only 1-2% of capital).
Wait for candle close above breakout level, not just intraday movement.
🔹 Invalidation:
If price fails to hold above neckline and breaks below 55,167, pattern becomes invalid.
This setup favors bulls as long as price sustains above the neckline.
Disclaimer: This analysis is for educational and informational purposes only. Please consult your financial advisor before making any trading or investment decisions.

2400 - 3 months HEAD & SHOULDERS══════════════════════════════
Since 2014, my markets approach is to spot
trading opportunities based solely on the
development of
CLASSICAL CHART PATTERNS
🤝Let’s learn and grow together 🤝
══════════════════════════════
Hello Traders ✌
After a careful consideration I came to the conclusion that:
- it is crucial to be quick in alerting you with all the opportunities I spot and often I don't post a good pattern because I don't have the opportunity to write down a proper didactical comment;
- since my parameters to identify a Classical Pattern and its scenario are very well defined, many of my comments were and would be redundant;
- the information that I think is important is very simple and can easily be understood just by looking at charts;
For these reasons and hoping to give you a better help, I decided to write comments only when something very specific or interesting shows up, otherwise all the information is shown on the chart.
Thank you all for your support
🔎🔎🔎 ALWAYS REMEMBER
"A pattern IS NOT a Pattern until the breakout is completed. Before that moment it is just a bunch of colorful candlesticks on a chart of your watchlist"
═════════════════════════════
⚠ DISCLAIMER ⚠
Breakout Area, Target, Levels, each line drawn on this chart and any other content represent just The Art Of Charting’s personal opinion and it is posted purely for educational purposes. Therefore it must not be taken as a direct or indirect investing recommendations or advices. Entry Point, Initial Stop Loss and Targets depend on your personal and unique Trading Plan Tactics and Money Management rules, Any action taken upon these information is at your own risk.
═════════════════════════════

IWM - 3 months HEAD & SHOULDERS══════════════════════════════
Since 2014, my markets approach is to spot
trading opportunities based solely on the
development of
CLASSICAL CHART PATTERNS
🤝Let’s learn and grow together 🤝
══════════════════════════════
Hello Traders ✌
After a careful consideration I came to the conclusion that:
- it is crucial to be quick in alerting you with all the opportunities I spot and often I don't post a good pattern because I don't have the opportunity to write down a proper didactical comment;
- since my parameters to identify a Classical Pattern and its scenario are very well defined, many of my comments were and would be redundant;
- the information that I think is important is very simple and can easily be understood just by looking at charts;
For these reasons and hoping to give you a better help, I decided to write comments only when something very specific or interesting shows up, otherwise all the information is shown on the chart.
Thank you all for your support
🔎🔎🔎 ALWAYS REMEMBER
"A pattern IS NOT a Pattern until the breakout is completed. Before that moment it is just a bunch of colorful candlesticks on a chart of your watchlist"
═════════════════════════════
⚠ DISCLAIMER ⚠
Breakout Area, Target, Levels, each line drawn on this chart and any other content represent just The Art Of Charting’s personal opinion and it is posted purely for educational purposes. Therefore it must not be taken as a direct or indirect investing recommendations or advices. Entry Point, Initial Stop Loss and Targets depend on your personal and unique Trading Plan Tactics and Money Management rules, Any action taken upon these information is at your own risk.
═════════════════════════════

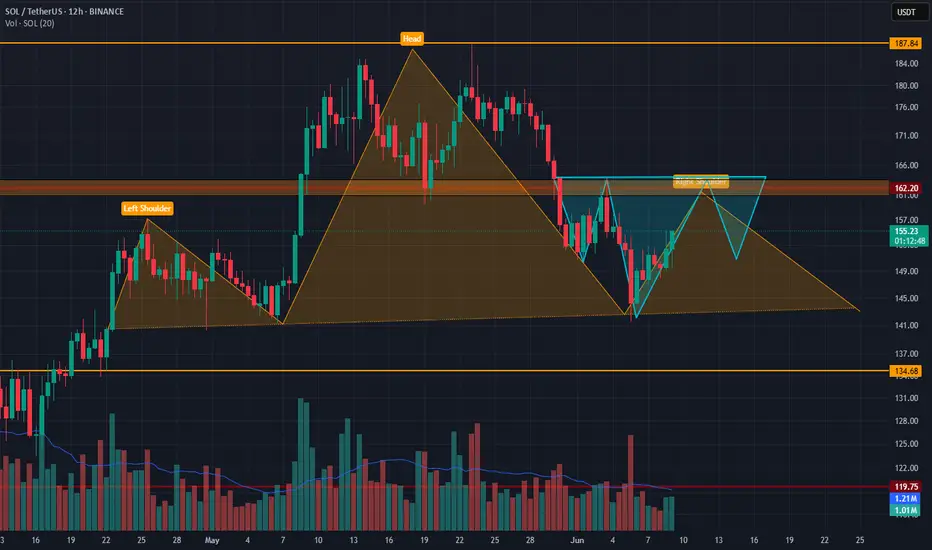
On Solana, 162$ is criticalBINANCE:SOLUSDT
On Solana we are see 2 possible head ans shoulders pattern. İf we cant go past 162$ and the bigger pattern works, things for solana is not so good.
But if we can past beyond 162$ dollars with or without a reverse head and shoulders pattern, the bigger patterns is breaks and we can look for a further bullish movement.
İf you look to my analysis from past, you see a falling wedge on solana too.
I think if Btc dont give any harm, solana wants to go up but one piece of news can change everything.
EUR/USD 4H – Potential Quasimodo + Bearish Divergence SetupCurrently monitoring EUR/USD for a potential sell setup based on several strong technical confluences:
⸻
🧠 Price Structure: Possible Quasimodo (QM) Pattern
• The chart is showing early signs of a Quasimodo pattern (QM) formation.
• Left Shoulder and Right Shoulder are developing, with a higher high (false break) between them.
• The recent Dominant Break above 1.14948 could be a liquidity grab — classic in QM setups.
• Price appears to be retesting the right shoulder area, signaling potential for a bearish reversal.
⸻
📉 AO Indicator: Bearish Divergence as Confirmation
• Clear bearish divergence between price action and the Awesome Oscillator (AO):
• Price made a higher high, but AO printed a lower high.
• This signals weakening bullish momentum — a powerful confluence for a potential drop.
⸻
⚠️ Confluences for Sell Setup:
1. ✅ Potential QM Pattern forming
2. ✅ Dominant Break followed by a potential right shoulder retest
3. ✅ Strong bearish divergence on AO
4. ✅ Price failing to break and close strongly above recent high (~1.1494)
⸻
📍 Sell Trade Plan (if confirms):
• Entry Zone: Around 1.14400–1.14600 (right shoulder zone)
• Stop Loss: Above previous high (~1.15000)
• Take-Profit Options:
• TP1: Previous structure support around 1.13600
• TP2: Deeper support zone ~1.13000–1.12700
• TP3 (Aggressive): Full QM target near 1.12100 (as marked on the chart)
⸻
⏳ Wait For:
• Bearish rejection or momentum candle on 4H or 1H
• AO to cross below 0 or accelerate red bars for extra confirmation
⸻
💡 Conclusion:
EUR/USD is showing signs of a bearish reversal with a textbook QM setup supported by AO divergence. If the right shoulder holds and bearish momentum kicks in, this could offer a high-probability short opportunity.

NHPC INVERSE HEAD AND SHOULDER BREAKOUTInverse Head and shoulder at NHPC ABOVE Neckline
Now target is 110

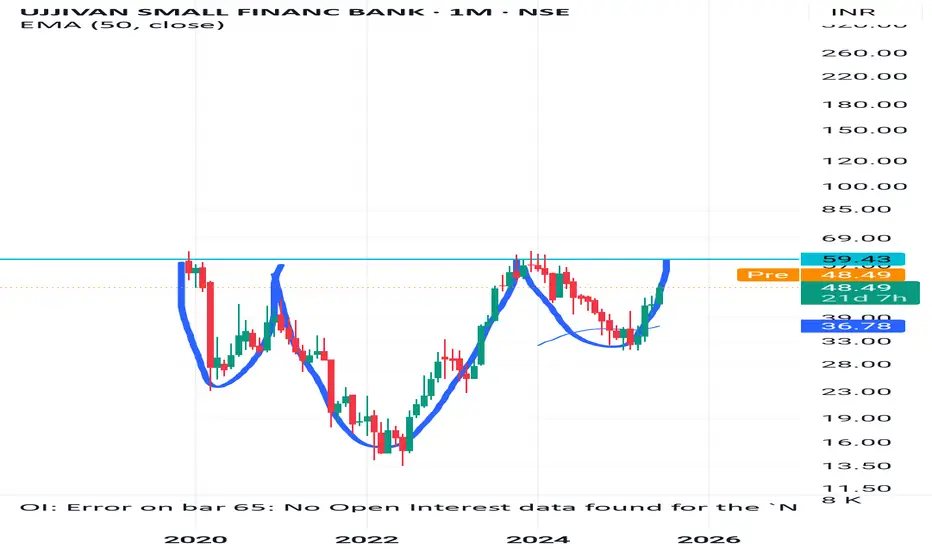
Head and shoulder pattern seen in Ujivan-sfbneckline at rs 60 in ujjivan sfb
After breakout
Target becomes 95-102
So add the alert at 60 rs
View is long term , for atleast 3 years
SHORT ON ETHEREUM ETH/USDEthereum has created a lower high after a triple top and is currently looking very bearish.
Huge imbalance to the downside to be filled.
I will be selling eth to the next demand level looking to catch over 500-600 points.

GOOG | The Year of Quantum | LONGAlphabet, Inc. is a holding company, which engages in software, health care, transportation, and other technologies. It operates through the following segments: Google Services, Google Cloud, and Other Bets. The Google Services segment includes products and services, such as ads, Android, Chrome, devices, Google Maps, Google Play, Search, and YouTube. The Google Cloud segment refers to infrastructure and platform services, collaboration tools, and other services for enterprise customers. The Other Bets segment relates to the sale of healthcare-related services and internet services. The company was founded by Lawrence E. Page and Sergey Mikhaylovich Brin on October 2, 2015 and is headquartered in Mountain View, CA.

LT possible to touch 2850 for 15 to 17% correctionLT has shown Head & Shoulder pattern formation, it there is a breakdown then it has possibility to have following targets;
3260 / 3100 / 2930 / 2850

Godrej Properties - H&S Pattern to reach 1600Godrej Properties has confirmed Head & shoulder pattern breakdown.
With this breakdown, following targets possible.
2000 / 1885/ 1750 / 1600
SL: 2470

ApolloTyre forming Head & shoulder - Possible 300.ApolloTyre has formed H&S pattern on weekly time frame.
It will have potential for 300 target in short term.
SL: 450
Target: 390 / 360 / 330 / 315 / 305 / 300

Cup with handle forming or an inverse head and shoulder formingAB Capital has formed either a cup with handle (almost :|) or is trying to make an inverse head shoulder with two shoulders.
