EURAUD – Bullish Breakout from Inverse Head & Shoulders + Target🔍 Pattern Insight: Inverse Head & Shoulders – A Powerful Reversal Formation
On the weekly timeframe, EURAUD has completed and broken out of a textbook Inverse Head & Shoulders (IHS) pattern — a highly regarded bullish reversal setup that often signals the end of a downtrend and the beginning of a sustainable uptrend.
Let’s break it down:
Left Shoulder: Formed in mid-2021 after a strong downtrend, price found support and rebounded, forming the initial shoulder low.
Head: A lower low was established around early 2022, marking the deepest point of the pattern. This represents the last dominant push by sellers before exhaustion.
Right Shoulder: In late 2022 to early 2023, bulls stepped in earlier than before, establishing a higher low — a strong sign of decreasing bearish momentum and accumulation.
Neckline : A descending resistance trendline connecting the peaks between the shoulders and the head. Once broken, it confirms the IHS breakout and trend reversal.
This multi-year formation reflects a major psychological shift: sellers lost control at the head, and buyers gradually regained dominance at the right shoulder, eventually breaking resistance.
📉 Retest in Progress – High Probability Entry Zone
Post-breakout, price action has pulled back for a technical retest of the neckline and curve line support — a dynamic trendline representing growing bullish momentum. This retest is essential for validating the breakout and building the base for a continuation rally.
The convergence of support zones (neckline + curve line) around the 1.70–1.72 area provides a strong confluence zone where buyers may step in again. This is often viewed as a second-chance entry for traders who missed the breakout.
🎯 Measured Target Projection & Resistance Levels
The IHS pattern gives us a clear measured move:
Measured Move Target: Distance from the head to neckline (~2,800+ pips) projected from the breakout point.
Target Zone: 1.92 – 1.95, just above the major resistance zone.
Resistance Zone: 1.85 – 1.87 is a historically significant supply area and may act as interim resistance.
Break and close above the resistance zone would further validate the bullish trajectory and open the door for higher targets.
📌 Risk Management – Defined Parameters
To manage risk effectively, consider:
Stop Loss: Below the recent retest low and curve line support, ideally placed at 1.63848, protecting against a false breakout.
Entry Idea: If bullish confirmation (e.g., bullish engulfing candle, higher low on lower timeframe) appears at retest zone, initiate a long position.
Risk-to-Reward (RR): Targeting 1.92 from an entry around 1.72 offers a 4:1 RR or better — highly attractive for swing and position traders.
🧠 Psychological and Structural Significance
This pattern is not just technical — it represents behavioral change in the market:
The head shows capitulation — a final wave of bearish pressure.
The right shoulder indicates growing confidence in bulls and waning selling interest.
The neckline breakout is where sentiment flips — traders recognize the change and enter long positions, fueling the breakout.
The current retest phase is crucial. Many professional traders wait for this moment to confirm that support holds before fully committing.
🔎 Final Thoughts & Strategy
Trend has shifted bullish on the weekly chart after years of consolidation and decline.
We’re seeing a classic breakout–retest–continuation setup.
A breakout above 1.85 would likely trigger momentum traders and institutions, driving price swiftly toward the 1.92–1.95 range.
Invalidation: Break below 1.63848 would invalidate the pattern and shift sentiment back to neutral or bearish.
📈 Trade Plan Summary:
Pattern: Inverse Head & Shoulders (weekly)
Bias: Bullish
Entry Zone: 1.70 – 1.73 (retest area)
Target: 1.92+
Stop Loss: Below 1.63848
Risk Level: Medium (weekly setup, but long-term play)
Head and Shoulders

Potential Inverse H&S120660 should be Crossed & Sustained
for further Upside (with Good Volumes)
Inverse H&S Potential Target is around 138000-140000

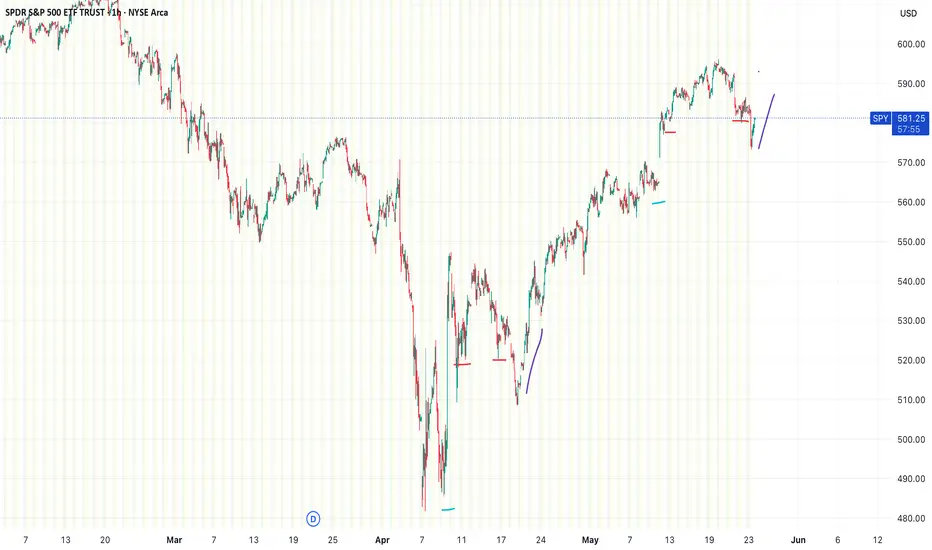
Repeat of Late Apr-May lows & rallyThe chart shows the SPDR S&P 500 ETF Trust (SPY) on a 1-hour timeframe, with a pattern appearing to be repeating itself from late April/May(Liberation day announcements) dip and then boot and rally from trade announcements, all marked by colored lines.
The colored lines (blue, red, purple) highlight a recurring price action setup. Each set of lines seems to mark a sequence of movements:
Blue: Sharp drop, then gap up
Red: Consolidation at a lower higher from gap up, return to high, consolidation back lower at previous lower high
Purple: Breakout & reversal upward.
Walmart Head & Shoulders on Daily and Weekly chartWalmart (WMT) may be forming, or already has formed, a bearish Head & Shoulders pattern.
#WMT #Walmart #bearish #short #headandshoulders #retail #discountstore

Dow Jones breakdown or setup for 15 percent rally?The Dow looks weak but this might be the setup traders dream of. We break down two possible bullish patterns forming — an inverse head and shoulders and an ascending triangle — and explain how Trump’s EU tariffs could shape the next move. Target gains up to 15 percent with risk reward ratios as high as 7.5 to 1.
This content is not directed to residents of the EU or UK. Any opinions, news, research, analyses, prices or other information contained on this website is provided as general market commentary and does not constitute investment advice. ThinkMarkets will not accept liability for any loss or damage including, without limitation, to any loss of profit which may arise directly or indirectly from use of or reliance on such information.

Novo 1h longShould get up and at least break the neckline from the bigger SHS/IHS.
Stop below zone or lower trendline.

GBPUSD Head and Shoulders PatternIf GBPUSD drops to 1.3255, the Head and Shoulders pattern will be confirmed.
This is a bearish signal, and it could be a good time to consider a short position.
Watch this level closely.

BNB Ready for a Major Breakout? Head & Shoulders Pattern in PlayMarket Insight:
#BNB is currently trading in a prime buying zone for spot traders, showing strong price action on the 4-hour timeframe. A Head and Shoulders (H&S) pattern is forming, and we are closely monitoring its breakout for a potential bullish move.
🔹 Bearish Signs? None so far! The market structure remains intact, and buyers seem to be in control.
Trade Plan for Bulls:
🔹 Breakout Confirmation: A clean break above the neckline of the H&S pattern will confirm bullish momentum.
🔹 Entry Zone: After confirmation, a long position can be initiated with proper risk management.
🔹 Stop Loss & Risk Management: Place a stop-loss below the right shoulder to manage risk effectively.
🔹 Potential Target: If the breakout holds, we could see a strong upward move toward key resistance levels.
🔹 Chart Analysis: (Attach a well-annotated chart with clear trendlines, breakout zones, and risk-reward levels)
🔹 What’s Your Take?
Do you think #BNB will break out or face rejection? Drop your thoughts in the comments!
Like & Follow for more real-time trade setups!

Is this Bitcoin’s final push before altcoin season?Bitcoin breakout confirmed. But what if AVAX and other altcoins are where the real profits are hiding? Let’s talk targets, setups, and the coming shift in momentum.
This content is not directed to residents of the EU or UK. Any opinions, news, research, analyses, prices or other information contained on this website is provided as general market commentary and does not constitute investment advice. ThinkMarkets will not accept liability for any loss or damage including, without limitation, to any loss of profit which may arise directly or indirectly from use of or reliance on such information.

5/22 Gold Trading SignalsGood afternoon everyone!
Yesterday's trading session was a bit bumpy, but in the end, we achieved considerable profits.
Today, gold rose to around 3346 and then began to pull back. It is now approaching the 3300 support level.
🔍 From a technical perspective, the candlestick structure and several indicators suggest that bears may still attempt further downside:
Primary support area: 3288–3276 — if this holds, a rebound is expected, with resistance around 3309–3316.
Secondary support area: 3263–3248 — if it breaks lower, watch for a short-term bounce around 3276-3282.
📰 On the news front, Initial Jobless Claims and PMI data will be released today. These could trigger short-term volatility.
📌 Trading strategy for today includes two key scenarios:
If the data is bearish for the dollar and gold drops to 3253, look for buy opportunities.
If the data is bullish and gold rises to 3358, it's a good spot to sell into strength.
📈 Today’s Trading Recommendations:
📉 Sell near 3358–3372 (Resistance zone)
📈 Buy near 3263–3248 (Support zone)
🔁 Flexible intraday levels: 3253 / 3268 / 3277 / 3286 / 3298 / 3309 / 3316 / 3328 / 3348
Wishing everyone a smooth trading day. Feel free to leave a comment if you have any questions—I’ll get back to you as soon as possible.

ElectroCast SteelSwing Trade for existing share holders
Down trend expected with head & shoulder pattern

LTCUSD has formed a head and shoulders bottomOn the daily chart, LTCUSD has formed a head and shoulders bottom pattern, and the short-term market is dominated by bulls. At present, attention can be paid to the resistance near 107.0. If it breaks through, it is expected to continue to rise, and the upper target is the previous supply area of 123.6-140.0.

Zero coupon bonds 🚀This is the most extreme US Treasury bond ETF. Basically pay some amount and get back face value in 25 years. Inflation would kill these, whereas deflation and falling interest rates will send this to the moon.
Interestingly this pays a dividend in line with other bonds, I looked it up and it looks like the fund has to do this for tax purposes, but the underlying security has literally a Macaulay duration of 25 years. TLT by comparison is 17 years (per iShares website), so duration risk is 50% higher.
Using fibs a modest pullback to 78, completing a IHS, would be a great place to start loading up, assuming 1) this thing doesn't just take off right here, and 2) I'm not totally wrong and inflation comes back next year.

Bullish Setup
Closed at 141.02 (21-05-2025)
Beautiful Bullish Divergence +
Inverse H&S in progress.
As mentioned earlier, 144 - 146 is
an immediate resistance; once crossed
& sustained, we may witness 152 - 155
& then 175 - 180.

Beautiful SetupClosed at 141.02 (21-02-2025)
Beautiful Bullish Divergence +
Inverse H&S in progress.
As mentioned earlier, 144 - 146 is
an immediate resistance; once crossed
& sustained, we may witness 152 - 155
& then 175 - 180.

$ETH / $BTC Inverse Head and Shoulders Confirmed! NGL pretty much every chart i'm looking at rn looks crazy bullish 🐂
Inverse Head and Shoulder confirmed on ETH / BTC 🤯
The real test comes at the 200DMA as CRYPTOCAP:ETH has not traded above it in the past 307 days.

Bullish
Closed at 34.03 (21-05-2025)
Hidden Bullish Divergence on bigger tf.
Bullish Divergence on shorter tf.
Immediate resistance is around 34 - 34.10
Crossing & Sustaining this level may exposes
upside towards 47 - 48
However, mid way, 40-41 & 44-45 are important
resistances that should not be ignored.
On the flip side, 30 - 32 are important Support levels.
and 29.80 Must not Break on Monthly Basis.

Dell going strong after big dipDell going strong after big dip, after creating head and shoulder, Dell going to close the chart pattern with target 127$, to the target we have the strong Weekly resistance 115$ to break, then the strong high 121$, a short term trend line , and the all time high trend line, with good momentum we can test after this the last high before the dip 146$, Dell raised 75% in lest than 2 month and expect to reach 120$ from last dip in another 2 months,

5/21 Gold Trading SignalsGood afternoon, everyone!
In yesterday’s trading, our buy-side positions performed well, but unfortunately, sell orders around 3280 weren't closed in time, resulting in a partial loss of profit.
Today, gold has shown impressive strength, breaking above the 3300 level and forming an irregular inverse head-and-shoulders pattern. Technically, this implies further upside potential.
🔍 Based on price action and technical patterns, this rally could extend beyond 3330, and even test 3350+. However, the 3346–3369 zone marks a strong resistance band, making it an ideal zone for medium-term selling opportunities.
📉 On the downside, we identify the first major support at 3278, followed by the 3261–3246 zone.
📰 On the news front, several Fed officials expressed economic concerns in speeches early this morning. Meanwhile, reports of Israel preparing to strike Iran’s nuclear facilities fueled safe-haven demand, pushing gold strongly back above the 3300 mark.
📌 Today's Trading Strategy:
Sell between 3346–3373 (consider scaling in)
Buy between 3260–3243
Flexible trading in the zones: 3338 - 3326 - 3318 -3309 -3298 - 3288 - 3272
Lastly, a heartfelt thought:
Living in a peaceful country like China, it's truly heartbreaking to see so many innocent children suffering or even losing their lives due to war. Let us hope for peace soon—so all people may live safely, freely, and happily.

Inverse H&S + Triangle = Gold’s Perfect Setup for a BreakoutAs I expected in my previous idea , Gold ( OANDA:XAUUSD ) started to rise after a correction and made another attack on the Resistance zone($3,280-$3,245) .
Gold is currently moving near the Resistance zone($3,280-$3,245) and Yearly Resistance (2) .
If we look at the Gold chart from a Classic Technical Analysis perspective, two Classic Patterns are clearly visible.
1- Inverse Head and Shoulders pattern , which is a good sign for a Resistance zone($3,280-$3,245) breakout.
2- Symmetrical Triangle Pattern is also a sign of a continuation of the recent bullish trend
In terms of Elliott Wave theory , Gold seems to have completed the corrective waves , and we can expect the start of an impulsive wave . Breaking the Resistance zone($3,280-$3,245 ) can be a good sign for the start of an impulsive wave and a gold pump .
I expect Gold to trend higher in this week , and the first sign could be a break of the Resistance zone($3,280-$3,245) . The targets are clear on the chart.
Note: If Gold touches $3,179 , we should expect a drop.
Gold Analyze ( XAUUSD ), 1-hour time frame.
Be sure to follow the updated ideas.
Do not forget to put a Stop loss for your positions (For every position you want to open).
Please follow your strategy; this is just my idea, and I will gladly see your ideas in this post.
Please do not forget the ✅' like '✅ button 🙏😊 & Share it with your friends; thanks, and Trade safe.

EURUSD: One More Bullish ConfirmationThe EURUSD pair formed another bullish pattern on the 4-hour chart following a test of significant daily/intraday support.
An inverted head and shoulders pattern was formed, with a bullish breakout of the neckline.
I anticipate further upward movement in the market, with a target of 1.1414.

GOLD (XAUUSD): Bullish Reversal ConfirmedGOLD reached a significant horizontal support level last week..
The price formed an inverted head and shoulders pattern, leading to a bounce that broke through a strong downward trend line.
This indicates buyer strength, suggesting the market may continue to rise, with a target of 3322.

USDJPY: Very Bearish Setup ExplainedI spotted a lot of bearish confirmations on 📉USDJPY on a 4H time frame:
A significant head and shoulders pattern was formed, and its neckline is broken.
As the right shoulder formed, a distinct horizontal trading range emerged, which also saw support being violated.
The neckline serves as an important horizontal support, and the market has broken through all of these levels.
We can expect further declines, with the next support level at 143.
