Keep an Eye on TreasuriesNot really liking the treasury bond price action. Still believe that bond vigilantes are dumping US treasuries... not liking the head and shoulders pattern on the weekly... the higher treasury yields don't seem to be impacting the equity markets... until they do.
Head and Shoulders

XAUUSD(LONG)
Inverse head and Shoulder reversal pattern
to go long
Rule(length on head= Target from neckline to TP)

CARDANO (ADAUSD): Very Bullish Pattern
ADA formed a huge inverted head and shoulders pattern
on a daily time frame.
A bullish violation of its neckline is a strong bullish signal.
I expect more growth and a test of 0.974 level soon.
❤️Please, support my work with like, thank you!❤️

Chinese Fear Head & Shoulders Pattern.Oh no! China's stock market is showing signs of a downturn!
The dreaded "head and shoulders" pattern is emerging, buyer volume is plummeting, and despondent sellers are circling like sharks!
Brace yourselves as the market takes a nosedive, plunging below the 1.13 Fibonacci level!
Get ready for some potential turbulence!

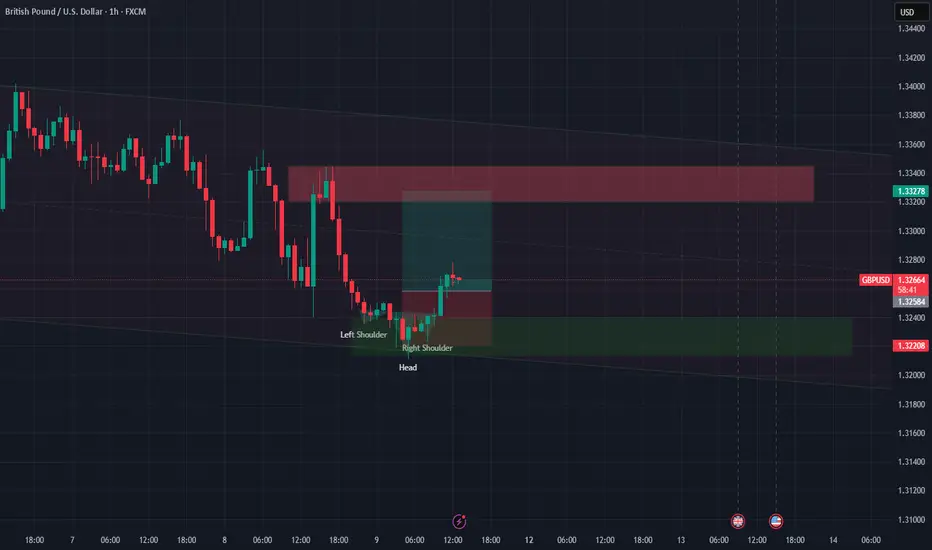
GBPUSD - Trend Continuation Trading Using Structure & Ice ZonesA technical walkthrough of a simple price action trading setup using structure. In this trade specifically we're looking for a bullish trend continuation trading opportunity that occurs after the violation of structure (and a head and shoulders pattern neckline) which also lines up with a current Ice Zone.
If you have any questions or comments about the trading opportunity, please leave them in the comments section below as well as any pairs or trading ideas that you'd like me to touch on in future videos.
Akil

GBPUSD SELLSDaily had a head and shoulder. H4 support has been broken. Long term target is 1.27000 but watch out for 5 month old H4 trendline support.

IMX retesting inverse head and shoulders breakout lineIMX is currently retesting the inverse head and shoulders pattern. If we bounce off here we can see a bullish move to the upside. Gaming tokens haven't really taken off yet compared to memes and the big dogs such as BTC and ETH.

USDJPY Short: Video WalkthroughHello, this is the video walkthrough on the USDJPY short idea that I posted 7 hours earlier. Price has since moved down so you would either scale in your short position, or do this on a smaller size based on your risk management. But definitely for this idea, the invalidation point, and thus the stop loss, will be if price moves above the wave Y high.
Good luck!

$COIN is FLYING! 33% UpsideNASDAQ:COIN Trade Alert 🚨
🎯$240🎯$286 (MM)
- Inverse H&S Breakout ✅
- Massive Volume GAP ✅
- Bullish H5 Indicator ✅
- Crypto flying ✅
Not financial advice

$IWM, small caps, not YET giving the "all clear"AMEX:IWM is the lone index still not in the clear 🚩 — backtesting its 200dma today and tagging the weekly mid-BB , just like in '22. Will it matter by week's end? If not, the bull is likely back across the board 🐂
This week's #CPI (Consumer Price Index) and #PPI (Producer Price Index) prints could significantly influence market direction across major indices — AMEX:SPY , NASDAQ:QQQ and AMEX:IWM — especially with rate cut expectations in flux. 🧵Here's how:
1. Hot CPI or PPI (above expectations):
AMEX:SPY : Likely to pull back as sticky inflation pressures broader S&P names, especially rate-sensitive sectors like real estate and utilities.
NASDAQ:QQQ : Could see sharper downside—tech stocks (many of which are high duration assets) are highly sensitive to interest rate expectations.
AMEX:IWM : Likely the hardest hit. Small caps suffer from tighter financial conditions and depend more on domestic borrowing costs.
🟥 Result: Bearish across the board, with small caps underperforming.
2. Cool CPI or PPI (below expectations):
AMEX:SPY : Broad lift, particularly in consumer discretionary and financials.
NASDAQ:QQQ : Strong rally—mega cap tech loves the prospect of lower yields.
AMEX:IWM : Outperforms if cooling inflation suggests easing ahead, since it's more leveraged to rate cycles and domestic growth.
🟩 Result: Bullish, with small caps possibly leading a relief rally.
3. In-line CPI/PPI :
Markets may stay choppy or consolidate, with AMEX:SPY and NASDAQ:QQQ more stable.
AMEX:IWM remains at risk of drifting lower unless there’s a strong dovish narrative from the Fed or other macro catalysts.
With small caps already lagging, this week’s inflation data could either validate its bearish divergence or spark a rotation rally if inflation
AMEX:SPY NASDAQ:QQQ TVC:VIX $ES_F $NQ_F $RTY_F TVC:TNX NASDAQ:TLT TVC:DXY #Tariffs #Stocks

GBPUSD ready to drop 500 pips !!!As the Dollar Index TVC:DXY strengthens, most of the major FX pairs are gearing up for massive drop or have started dropping already. One of these pairs is FX:GBPUSD which is about to drop 500 pips in the coming days.
FX:GBPUSD having formed a Head and Shoulder chart pattern, the bullish momentum of the TVC:DXY has caused a break of the neckline of the above mentioned chart pattern.
What to expect:
FX:GBPUSD will most likely either retest the neckline that it broke, and then give a massive drop or it will continue the drop from the broken neckline all the way to 1.3030 before retracing.
Below are the expected targets for this setup
TP1: 1.3030
TP2: 1.2900
TP3: 1.2745
SL: 1.3370
Kindly support this analysis to enable it reach to other people, and do comment your thoughts.

Bitcoin Chart Pattern Signals Possible Dip Before Pump!🚀 Hey Traders! 👋
If you’re finding value in this analysis, smash that 👍 and hit Follow for high-accuracy trade setups that actually deliver! 💹🔥
📉 #BTC – Potential Inverse Head & Shoulders in Play
Bitcoin is showing signs of a classic inverse head and shoulders formation on the daily chart. However, it's facing heavy resistance near the neckline around the $106,000 zone.
🧠 Possible Scenario:
A correction toward the GETTEX:92K –$93K range could complete the right shoulder before a potential breakout. If we see a clean bounce from that level, bulls might reclaim momentum.
⚠️ Invalidation:
A daily close above $106,000 would invalidate the structure and signal early continuation.
💬 What do you think of this setup? Drop your views and analysis in the comments below!

$SOL / $BTC Inverse Head and Shoulders BREAKOUT!!CRYPTOCAP:SOL / CRYPTOCAP:BTC Inverse Head and Shoulders reversal pattern confirmed 🥳
PA has also reclaimed the 50DMA
Bullish Divergence on RSI
So many signs indicators aligning across the market.
IS IT REALLY TIME !!?!?

OptionsMastery: MARA Inverse H&S!🔉Sound on!🔉
📣Make sure to watch fullscreen!📣
Thank you as always for watching my videos. I hope that you learned something very educational! Please feel free to like, share, and comment on this post. Remember only risk what you are willing to lose. Trading is very risky but it can change your life!

Chainlink (LINK) Update (12H) – Bullish Structure StrengthensIn our previous analysis, I outlined multiple technical reasons suggesting that LINK was preparing for a major bullish phase. Since then, LINK has surged over 25% from the level I initially highlighted.
Upon reassessing the chart from a broader perspective, I’ve identified a reversed Head and Shoulders pattern forming on the higher timeframes — a classic bullish reversal signal. This has also prompted a revision of the Elliott Wave count on the macro structure.
Updated Technical Insights:
Wave Count: LINK is currently in Wave 3 of a larger bullish impulse, based on Elliott Wave Theory.
Breakout Confirmation: The neckline of the reversed Head and Shoulders pattern is being breached, which aligns with the 1.618 Fibonacci extension — a typical target zone for Wave 3.
If you entered based on the prior setup, you’re likely sitting on a 20–25% gain even on a 1x position. There’s no need to add or chase the price at this point — the optimal move is to secure profits by moving stop-loss to break-even and continue managing your position with discipline.
Updated Target:
The mid-term projection for LINK now stands around the $25 mark.
— Thanks for reading.

Going short on this tradeThis market is going short. Its at a nice daily/ monthly resistance and its been hitting that area for while trying to break but i dont see a strong enough momentum to the upside. i took entry at 163.834 and hoping it drops down to 161.423 to 160.496 or further down . Another thing on the 4hr it did create a head and shoulder pattern which could mean she will have a nice drop so lets see what Ej does if she has a big drop or not .

5/9 Gold Trading SignalsLong time no see, my friends! My holiday trip is about to end. I attended two weddings during this trip, which was unforgettable! I hope that everything goes well for everyone during my absence!
Gold has risen recently and returned to above 3400 again. Although it has fallen back in the past two days, the current technical level shows that the bulls are not over yet! This means that if there are friends who buy at high prices, they will have a chance to get out of trouble without doing other operations!
From the current pattern, it is in the stage of triangle consolidation. It is necessary to pay attention to the resistance of the 3360-3382 range. If the price falls under pressure at this position, we need to observe the support of the 3300-3280 range to determine whether it can form a short-term double bottom pattern or a head and shoulders bottom pattern again, so as to support the bulls to run again.
Based on the above analysis, today's trading suggestions:
Sell in the 3364-3386 range
Buy in the 3318-3302 range
Flexible trading in the 3323-3362 range

EURUSD: Important Bearish Reversal Confirmed?!The EURUSD chart shows a large head and shoulders pattern on a daily basis, indicating a strong bearish reversal signal with the breakout of the neckline.
The broken neckline now acts as a key resistance level, suggesting a potential further decline towards the 1.1150 level.

Gold Head & Shoulder PatternThe completion of a head and shoulders pattern in the gold market suggests the potential commencement of an upward trend.
Current market conditions indicate that we are presently situated within the right shoulder formation of this pattern, an observation that warrants careful monitoring for confirmation of the bullish reversal and subsequent price appreciation.

Bull run 4H after liquidity run??lower tf shows inverted Hadn shoulder and we can see we formed a fairvalue gap as of this post, Bull run to supply zone
DOLLAR INDEX (DXY): Bullish Reversal Confirmed?!
Dollar Index formed an inverted head and shoulders pattern on a daily.
Its neckline breakout is a strong bullish reversal signal.
The broken neckline of the pattern turns into a significant support now.
We can expect a growth from that at least to 101.25 resistance.
❤️Please, support my work with like, thank you!❤️

US DOLLAR INDEX(DXY): Bullish Outlook & BreakoutThe Dollar Index formed a significant inverted head and shoulders pattern on a 4-hour chart.
Following the release of yesterday's economic data, the market surged and broke through both the neckline and a strong downward trend line.
This created an expanding demand zone with two broken structures.
I plan to take long positions in anticipation of a bullish trend continuing to at least 102 support level.

TOST Target Price $74.18 - LARGE Cup Handle Formation.Large C & H formation with ultimate Target Price of $74.18. Within the Handle is an inverted H & S formation with 1st Taregt of $45.13
