$BTC Rejected at .618 Fib - Correction Coming!Textbook rejection at the .618 Fib for CRYPTOCAP:BTC
Now on its way to retest the 200 and 50DMA as expected.
If that does not hold, we’ll go back to my original inverse head & shoulder idea ~$78k.
This will be the catalyst for Bitcoin’s next leg up to $130k end of June.
Head and Shoulders

Gold AnalysisSharing the potential direction of where gold may be heading to this week. Share your thoughts below.

GBPJPY: More Growth Ahead?! 🇬🇧🇯🇵
For some unknown reason, I received a lot of requests from
the members of my free channels to share my thoughts about GBPJPY.
Well, from a daily time frame perspective, the pair still looks bullish to me.
I do believe that the market has unrealized potential to go higher.
A bullish breakout of a neckline of a huge inverted head & shoulders pattern
was a very bullish event. It now turned into a strong support from where
I will look for buying.
The closest resistance is 191.95.
It will most likely be the next goal for the buyers.
❤️Please, support my work with like, thank you!❤️
I am part of Trade Nation's Influencer program and receive a monthly fee for using their TradingView charts in my analysis.

4/28 Gold Trading SignalsLast Friday, gold retested the 3260 support zone for the second time. After confirming support, prices began to climb steadily, and our low-entry long positions have already delivered impressive returns.
From a technical perspective, the broader structure still resembles a head-and-shoulders pattern, but recently, a double-bottom pattern has formed around the right shoulder, signaling an intense battle between bulls and bears—mainly influenced by geopolitical tensions.
Here, I would like to propose a bold yet speculative thought:
Could the current turmoil possibly lead to a regime change for Trump, or trigger massive nationwide protests? If such scenarios unfold, it would likely be extremely bullish for gold, potentially pushing prices toward 4000.
On the other hand, if Trump softens his trade policies under pressure, it would be bearish for gold, making a decline toward 2800 highly probable.
Of course, this is purely my personal speculation, and I don't claim deep expertise in international politics.
Focusing back on the technicals:
The 3260 support is critical.
A breakdown could see prices moving toward the 3245–3213 range, or even lower toward around 3190.
Any rebound from there should be carefully watched near the 3260 resistance; failure to break above would suggest a potential further drop toward 3153–3137.
If the double-bottom pattern holds firmly, a return to above 3400 this week is highly likely.
🔥 Today's Trading Plan:
Sell zone: 3407–3418
Buy zone: 3273–3241
Scalping zones: 3288–3323 / 3386–3344
Manage your positions wisely and stay flexible!

Fetch finished it's recent up swing?Could a head and shoulders pattern have formed on Fetch? Hopefully not as I've gone bought non-CFD Fetch.

XRP - Time to buy again!The pattern has broken, and now I expect the price to rise to $3 . AB=CD.
Give me some energy !!
✨We spend hours finding potential opportunities and writing useful ideas, we would be happy if you support us.
Best regards CobraVanguard.💚
_ _ _ _ __ _ _ _ _ _ _ _ _ _ _ _ _ _ _ _ _ _ _ _ _ _ _ _ _ _ _ _
✅Thank you, and for more ideas, hit ❤️Like❤️ and 🌟Follow🌟!
⚠️Things can change...
The markets are always changing and even with all these signals, the market changes tend to be strong and fast!!

The beginning of the carry trade unwind part 2?If we look at the chart, the current structure looks very similar to what happened right before the market decline in August.
We've formed a head and shoulders (albeit not perfect as it's slanted), and price seems to be breaking down.
If price action accelerates to do downside, it's likely to take the market with it just like it did the last time.
Paying attention to this over the coming weeks.

Short Term NEAR (4H)Near has formed a reversed head and shoulders pattern while breaking up a downwards trendline. Also retest confirmed. As long as the level of 2$ is maintained, Near should go upwards through 2.4$ at least.
Use 1.78 as stoploss and enter long right here.
Thanks for reading.

S (EX FTM) Update (4H)Like many other altcoins, S has formed an Inverse Head and Shoulders pattern, signaling a potential trend reversal.
Additionally, a bullish flag formation has broken out on the lower timeframes, further confirming the upward momentum.
The current price structure appears suitable for long positions, especially with confluence from multiple technical signals.
A conservative target lies around the $0.64 level, based on the measured move projections from the flag and neckline breakouts.
— Thanks for reading.

A wonderful ALTCOIN Bullrunis all set in motion.
If my chart resonates with you in any way.
The combined dominance charts of the big four.
#BTC.d
#ETH.d
#USDC.d
#USDT.d
We are on our way to my anticipated target zone.

4/25 Gold Trading StrategyYesterday’s long position strategy performed well—whether you closed your trades or continue to hold, the returns have been solid. Gold has now risen to the 3370 level, and technically, there's still room for further upside.
There is some selling pressure near 3370. If price breaks through decisively, we should watch for further resistance in the 3380–3400 zone. If bullish strength weakens, a pullback to 3368–3352 could occur.
If the market dips first, the 3345–3328 range is a key support area. A slow, corrective pullback to this zone could offer another buying opportunity. However, if the decline is sharp, we must monitor whether 3306–3288 can hold as a firm bottom.
From a trend perspective, I personally lean toward the possibility of gold pushing above 3400 today. Stay long-biased, but be flexible with high-level adjustments.
🔁Trading Recommendations:
Sell in the 3410–3440 range
Buy in the 3306–3288 range
Use 3380–3348 / 3328–3368 for flexible, intraday swing trades

Nokia:Inverted Head and Shoulders Structure + Retest of BreakoutOn the weekly chart of Nokia, a classic Inverted Head and Shoulders reversal pattern has formed. The breakout above the neckline occurred with increased volume, confirming the strength of the move. Currently, the price is undergoing a standard technical retest of the neckline from above — a typical phase before a potential continuation higher.
The structure remains active: the projected height (H) points to an initial target at $5.48, based on the distance from the neckline to the head. If momentum continues, Fibonacci extension targets are located at $6.18 (1.272), $6.55 (1.414), and $7.08 (1.618).
Technical view: the retest of the neckline is happening on declining volume, strengthening the probability of a bullish reversal. EMA 50/100/200 are beginning to align in a bullish crossover. The ascending channel structure also supports the upward movement.
Fundamentals: Nokia is progressing with its strategic programs in 5G and upcoming 6G network technologies, reinforcing its long-term growth prospects. Improved financial performance and the recovery in demand for telecommunications infrastructure amid global digitalization trends continue to support investor interest in the stock.
The Inverted Head and Shoulders pattern is confirmed by the breakout and current retest. As long as the price holds above the neckline, the bullish scenario toward $5.48 and beyond remains intact. This is a medium-term trend reversal structure — strong setups like this form the foundation for major moves. Don’t miss them.

HCH in XAUUSD?It looks like we are going to witness a possible bearish HCH in gold! The key level is 3260. If it is broken, the outlook is bearish in the short term. In the medium to long term, the outlook depends on what happens with this level and the geopolitical environment.

XRPUSDT The Calm Before the Storm: Major Breakout Loading…BINANCE:XRPUSDT has been trading within a well-defined horizontal channel for an extended period, signaling a prolonged consolidation phase. This kind of price behavior often precedes a major breakout, and all signs now point toward an explosive move to the upside.
What makes this setup even more compelling is the presence of an inverse head and shoulders pattern within the channel a classic bullish reversal formation. This pattern, forming after a long sideways trend, adds serious weight to the bullish narrative. It suggests that the accumulation phase is coming to an end, and buyers are preparing to take control.
A breakout above the upper boundary of the channel would confirm the pattern and could trigger a strong rally. Once XRP breaks out with volume, it may leave the consolidation zone behind for good and momentum could carry it to much higher levels.
Traders should watch closely for confirmation and manage risk accordingly. Always use a stop-loss to protect your capital. The opportunity is clear. CRYPTOCAP:XRP is gearing up, and the breakout could be unstoppable.
BINANCE:XRPUSDT Currently trading at $2.19
Buy level : Above $2.2
Stop loss : Below $1.95
Target : $3.5
Max leverage 3x
Always keep stop loss
Follow Our Tradingview Account for More Technical Analysis Updates, | Like, Share and Comment Your thoughts

Gold can break support level and continue to declineHello traders, I want share with you my opinion about Gold. For a while, Gold was confidently moving within an upward channel, with each impulse supported by rebounds from the lower boundary. After breaking out of the buyer zone, the price made a strong bullish move, supported by momentum and healthy corrections. This movement continued up to the current support level at 3285, where the price began to stall. Then, a classic Head and Shoulders pattern has now fully formed. The left shoulder, head, and right shoulder are all visible and aligned with the support area, which now acts as the neckline of the pattern. This isn't random, it's a well-defined reversal signal forming after an extended bullish leg. The rejection from the right shoulder shows evident seller control, and the price is now testing the neckline from below. The support area has already been broken once, and any bounce from here appears corrective rather than impulsive. Given this setup, I expect that price can fully breakdown toward the 3060 level, which acts as both a strong historical support and my TP1. Please share this idea with your friends and click Boost 🚀

AUDUSD BEARISH SETUP SELL!!!Based of my analysis on the pair I see it going lower, as I have confirmed with a few factors which I would state now..
First of all you can clearly observe a head and shoulder chart pattern in formation..
Second being a FVG zone was respected and price didn't close above the zone...
Third being the creation of new lower highs and lower lows..
#FOREXPAID
#PIPSPAYTHEBILLS
#FXSTORM

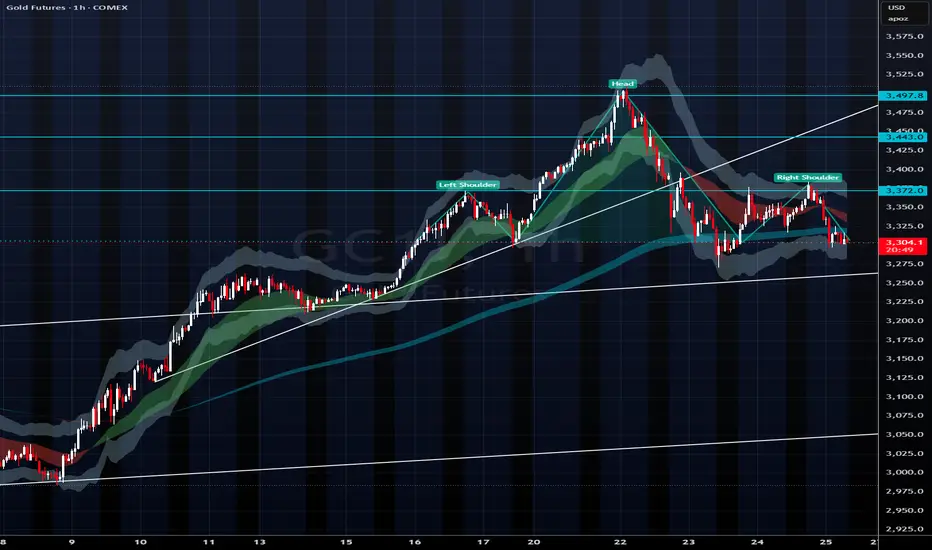
Watch to Watch - Gold Bearish Head and ShouldersWith the recent strength in US equities, the long gold trade may be over. Gold broke below a key trendline and formed a distinct bearish head and shoulder pattern signifying possible downside pressure coming up today and into the next week. Definitely worth watching for futures traders. First target with a break lower would be around $3240 with a lot of downside from there.
LTF Forming Inverted H&SLTF has formed inverted H&S pattern and has confirmed breakout
With this it will have following targets
168 / 175 / 180

Gold Analysis – New Leg of Correction Incoming?It’s been a “special” week for Gold, with wild swings that kept me mostly on the sidelines – except for Monday’s take profit. Now, however, the market is starting to show more clarity.
❓ Has the Market Topped Out?
After a dip to 3260, the price reversed sharply, gaining over 1,000 pips to reach 3367. Yet, both recent attempts to push higher were rejected.
Now, with the spike from 3360 to 3500 looking like a blow-off top, the stage seems set for a new leg of correction.
🔍 Key Technical Signs:
• Heavy selling pressure near recent highs.
• Price action suggests buyers are exhausted.
• 3370 becomes a key resistance – as long as it holds, bearish setups are favored.
📉 Trading Plan:
My approach is simple:
👉 Sell rallies
🎯 Target: a 1,000+ pip drop if 3370 remains intact.
Disclosure: I am part of Trade Nation's Influencer program and receive a monthly fee for using their TradingView charts in my analyses and educational articles.

EUR/USD: Is the Uptrend Losing Steam?EUR/USD has had an exceptionally strong month, gaining over 7% from bottom to top – one of the best performances in EUR’s history against the dollar.
But now, things are starting to shift.
🧭 Possible Long-Term Trend Change?
Beyond the impressive rally, the bigger story might be the potential shift in the long-term trend. However, after such a sharp move up, a correction is not only likely – it may already be underway.
🔍 Technical Outlook:
- Price pushed above the key 1.15 psychological level but failed to hold momentum.
- A bearish consolidation is forming.
- A classic Head and Shoulders pattern appears to be developing, with a neckline near 1.13.
- A break of that level could open the door for a deeper retracement, with a target around 1.11.
🛠️ Trading Plan:
I’m looking to sell rallies, ideally near 1.1450, to maintain a 1:3 risk-to-reward ratio.
Disclosure: I am part of Trade Nation's Influencer program and receive a monthly fee for using their TradingView charts in my analyses and educational articles.

Head and shoulder - sellThis is a possible head and shoulder pattern, one neckline is broken and price is creating another shoulder aka pullback before heading down in a reversal after price attempted to push up.

4/24 Gold Trading StrategyYesterday's intraday recommendation to buy near 3260 has paid off, with gold trending upward after the market opened today and generating solid profits.
The current pullback appears to be a healthy support retest. However, caution is needed—if the price breaks below 3306, momentum could drag it under 3300 again.
Should that happen, a renewed long position at lower levels is still worth considering. The rebound so far lacks both strength and duration, suggesting a potential shakeout. While it could also be a bull trap, entering at lower levels limits downside risk—with the worst case being reduced profits, not significant losses.
Today's Trading Strategy:
Sell Zone: 3410–3440
Buy Zone: 3267–3230
Flexible Trading Zones: 3383–3340 / 3288–3336

AT&T I Tipping Point : Short Opportunity with Head & ShouldersHey traders after a previous trade trade on the hood hitting targets of 16.4%. Today I bring you NYSE:T
Technical + Fundamental View
Pro Tip
- Breakdown below the Entry Line will be considered at Trade Initiation. (Risky Traders)
R:R= 5.4
- Rest can follow entry at day close post breakdown SL above Entry Candle.
- The Breakdown Below the Entry Line will confirm the head and shoulder pattern
Entry Line - 26.93
Stoploss - 27.53
Target 1 - 25.59 (Neckline of head and shoulder)
Target 2 - 24.74
Target 3 - 23.68
Technical View
- Head And Shoulder on Daily Time frame
- On the hourly timeframe, the chart looks weak, showing a potential double top pattern where the second peak is lower than the first, indicating growing investor fear.
Fundamental View
- High Debt: Over $140 billion in debt limits investment capacity and consumes significant cash flow.
- Network Issues: Poor service quality and outages risk losing customers to competitors.
- Strong Competition : T-Mobile and Verizon offer better plans, making customer retention harder.
- Market Saturation: The U.S. wireless market is nearly saturated, limiting new customer growth.
- Execution Risks: Growth and debt reduction depend on flawless asset sales and network upgrades; delays could harm finances and stock performance.
Additional Considerations
- AT&T’s valuation is higher than some peers, potentially capping upside.
- Telecom market competitiveness means growth hinges on successful 5G and fiber rollouts.
- Dividend yield (~3.9%) is attractive but lower than some rivals, which may impact income investors.
