BTC 97K Long Target Inverse Head and ShouldersTHIS BLUE NECKLINE IS 100% THE LINE TO FOLLOW
Inverse Head And Shoulders
Active Long Target - 97,050
What To Expect?
Trump's tweets are highly volatility just like the markets so rather then trying to call the exact bottom use this for your bull / bear transition. I'm not saying when it will happen... but above the blue line bullish, below it flip bearish despite it would take a number in the 60Ks to invalidate this target.
Downside seems to be the orange support line in 73.8... but money is on 97K sooner than later and this chart staying valid.
Head and Shoulders

GBPUSD HEAD&SHOULDER WEEKLY T_FStill keeping it simple and clean
# we've a obvious HEAD & SHOULDER on the weekly time frame
we both known the higher time frame has the high probability
find your entry if it aligns with your analysis

SBIN 754 - a good to buySBIN 754 has given inverted HS pattern which suggests it as a good to buy for target 855
in.tradingview.com/symbols/NSE-SBIN/
What is SBIN stock forecast?
We've gathered analysts' opinions on STATE BANK OF INDIA future price: according to them, SBIN price has a max estimate of 1,050.00 INR and a min estimate of 700.00 INR. Watch SBIN chart and read a more detailed STATE BANK OF INDIA stock forecast: see what analysts think of STATE BANK OF INDIA and suggest that you do with its stocks.

ETHUSD potential head and shoulders bottom patternOn the 4-hour chart, ETHUSD forms a potential head and shoulders bottom pattern. Currently, we can focus on the support near 1470. If it falls back and does not break, it will be expected to rise. The upper resistance is around 1750, and the breakthrough will go to the resistance near 1956.

Bearish Continuation or Reversal? XRP at Make-or-Break ZoneCurrent Price: around 1.956 USDT (bouncing slightly as of now).
Support Zone:
First Support: 1.821 USDT
Stronger Demand Zone (highlighted in the blue box): 1.6215 to ~1.84 USDT
Price might test this zone if the downward momentum continues.
Could serve as a potential buy zone or accumulation area.
- Watch for a breakout from the channel with strong volume for confirmation of a reversal.
- A breakdown below the support box would invalidate the bullish outlook and could signal deeper downside.

Tesla Shares Tumble 7%+ Following Cybertruck Quality ComplaintsTesla Inc. (NASDAQ: NASDAQ:TSLA ) faced another sharp sell-off on Thursday 10th. The stock dropped 7.27% to close at $252.40, down $19.80 for the day. However, volume was high, reaching 399.04 million shares.
The fall followed reports of build quality issues in Tesla’s Cybertruck. Owners posted complaints on the Cybertruck Owners Club forum. Several noted that the vehicle’s metal panels had detached.
Additionally, videos showing Cybertruck damage in cold weather gained attention on social media site X. These reports raised concerns over production quality.
Tesla had been recovering before the recent plunge. However, concerns about product reliability appear to have paused the rebound.
Technical Analysis
The 3-day chart shows Tesla in a strong downtrend. The stock broke below $290, triggering a drop to around $220 before bouncing back to $252. Price recently respected a key support near $190m, which may act as a floor for future declines. High volume near support signals buyer interest. If Tesla breaks above $290, it could retest $300. That zone acts as resistance and aligns with the 50- and 100-day moving averages at $252 and $232, respectively.
The longer-term target is near $488, but the price must clear $290 first. A failure to hold support near $220 could send the stock back toward $180. The RSI is at 42.77, slightly above oversold. Momentum is weak but may shift if price builds support above $250. Tesla’s next move depends on how it manages both technical resistance and consumer concerns.

U.S. Steel (X) Shares Drop 10% Following Presidential CommentsUnited States Steel Corporation (NYSE: NYSE:X ) shares dropped sharply after remarks from former President Donald Trump. He opposed the company's potential sale to Japan's Nippon Steel. Trump said he admired Japan but opposed the sale of an iconic American steel company.
He described U.S. Steel as “a very special company” and tied it to national interests. His statement caused a wave of uncertainty in the market. The stock dropped 15% shortly after the news. During extended trading, it fell as much as 16%.
As of 11:41 AM EDT, the stock trades at $42.03, down $3.11 (6.89%), as trading volume hits 19.7 million shares. Investors are concerned about the deal's future. U.S. Steel is central to U.S. economic and industrial discussions.
The takeover deal has raised questions about manufacturing and national security. The company is expected to report earnings between April 30 and May 5, 2025.
Technical Analysis
The 3-day chart shows a long-term uptrend. Price respects an ascending trendline starting at$16 in June 2022. Support lies above the 200-day moving average at $34.44. The 50-day and 100-day moving averages sit at $37.51 and $38.76, respectively.
The stock recently broke above $45 but pulled back after Trump's comments. Resistance lies at $50.20 and a breakout above this level could lead to further gains. The 3-day RSI sits at 55.89, suggesting neutral momentum that has room for the price to cover without reading an overbought reading.
However, a sharp drop could push it lower. Volume surged on the sell-off, confirming a strong market reaction. Adding to the bullish momentum is a complete head and shoulder pattern that signals potential recovery.
The short-term outlook depends on deal clarity and upcoming earnings. However, the trend remains intact above $34, and a move below could signal further downside.

STX Bulls Beware: Is This the Calm Before a Massive Drop?Yello, Paradisers! Are you seeing what we’re seeing on STXUSDT? If not, now’s the time to pay attention—our recent predictions on bearish setups are starting to unfold again, and this one might catch many off guard. Let’s break it down.
💎Currently, STXUSDT is flashing some serious warning signs. We’re spotting a clear bearish Change of Character (CHoCH) in play, which is being reinforced by a Head and Shoulders pattern—a combination that significantly increases the probability of a downside move.
💎To make things worse for the bulls, there’s an unfilled Fair Value Gap (FVG) sitting just below the current price. This acts like a magnet and could drag the price downward as liquidity gets targeted.
💎However, if STXUSDT manages to bounce from current levels, we’ll be closely watching the Order Block (OB) and Fibonacci Golden Zone as potential entry points. These could offer an excellent risk-to-reward (RR) setup if the bearish scenario gets temporarily rejected.
💎But here’s the key invalidation point: if price breaks and closes above the OB zone, the entire bearish thesis falls apart. In that case, we’ll step aside and wait for stronger confirmation before jumping back in. No need to rush—better opportunities always come with clear setups.
🎖Trade smart, Paradisers. The market doesn't care about your bias—it rewards only patience, precision, and discipline. Stick to your trading plan, and don’t let FOMO or fear drive your decisions.
MyCryptoParadise
iFeel the success🌴

Bull Trap Confirmed: HOOD's Rally Faces Exhaustion Part 2Hey Traders after the success of our last month trade on Tesla hitting all targets more than 35%+
With a Similar Trade setup I bring you today the
NASDAQ:HOOD
Hey Guys sorry but i just had to Reinitiate this trade with some updates
Short opportunity on Hood
Based on Technical + Fundamental View
-Market structure
-Head and shoulder pattern
-Caught in a Bull TRAP
Pro Tip
If today's day Pinbar's low broken tomorrow we can place a trade. (Morning Trade)
Target 1 - 35.52$
Target 2 - 30.81$
Target 3 - 26.26$
Stop Loss - Above Entry Candle
For Rest of the Details follow Part 1!
NOT AN INVESTMENT ADVISE

$BTC Not Out Of The Weeds Yet - Must Break $84kIf CRYPTOCAP:BTC can break back above ~$84k then we could continue to follow my OG setup (yellow) and rip,
but since PA dumped slightly below the 50WMA it technically invalidated my inverse h & s idea.
A rejection of $84k would dump us back to ~$78k to form the right shoulder (red) and complete the setup.
nonetheless, i believe we've seen the bottom 👋

BTC UPDATE: Flash Crash? Or Bullish Retest?🚀 Hey Traders! 👋
If you’re enjoying this analysis, smash that 👍 and hit Follow for high-accuracy trade setups that actually deliver! 💹🔥
📉 BTC just dropped nearly $10K in a single day, sliding from $84K to $74K amidst growing tariff tensions and broader market turmoil.
But here’s the bullish twist—this dump might just be a healthy retest.
BTC recently broke out of a strong inverse head & shoulders pattern, and what we’re seeing now looks like a classic neckline retest.
📌 Key Support: $72K
As long as BTC holds above this level, there’s no reason to panic. Once the dust settles from this bloody Monday, momentum could shift back to the upside.
🟢 This could be a golden accumulation zone—low risk, high potential reward.
❌ Invalidation Level: Weekly close below $72K
💬 What’s Your Take?
Will BTC bounce from this level, or is there more downside ahead? Drop your analysis and predictions below—let’s navigate this together and secure those gains! 💰🔥🚀

LONG ON CAD/JPYCAD/JPY is respecting a major demand area/zone
It has given a inverse head and shoulders in the recent pass, and now a double bottom at the same zone.
I will be buying this pair as a market order aiming for the next level of resistance/liquidity.

Go long gold, target: 3030-3040Gold tested the support of 2985-2975 again during the correction process, but did not fall below this area during the test. Combined with the structural lows of gold yesterday, they were 2970 and 2956. Today, gold did not fall below 2970, so it is very likely that gold will form a head and shoulders bottom pattern at the technical level, which will help gold to continue its rebound momentum with this strong technical support!
So I think the short-term decline of gold is not a risk for us, but the best gift for us. So I advocate going long on gold from now on. After gold repeatedly tests the support, it will rise to the 3030-3040 area without hesitation.
The trading strategy verification accuracy rate is more than 90%; one step ahead, exclusive access to trading strategies and real-time trading settings

AUDCAD: True Bullish Reversal?! 🇦🇺🇨🇦
AUDCAD formed a nice inverted head and shoulders pattern
after a test of a key historic support.
A bullish violation of its neckline with a strong bullish candle
provides a reliable confirmation.
I expect a correctional move at least to 0.8723
❤️Please, support my work with like, thank you!❤️

EURAUD head and shoulder patternThis is a strong reversal pattern which points to below the 1.7900 level. This is a complex H&S pattern, but targets the 1.7840 level in the days ahead. We'd need to see some bounce in the equity market to assist a move lower here.

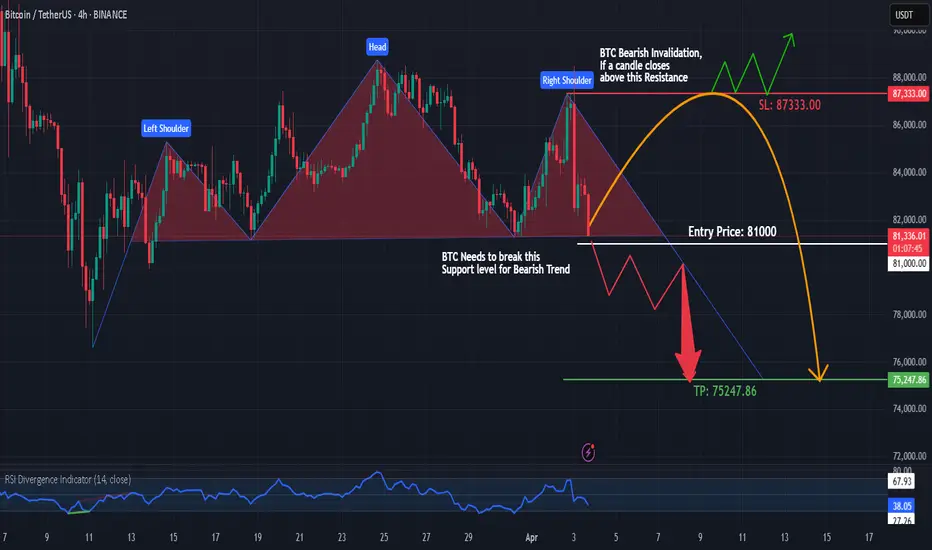
Bitcoin Head & Shoulders Pattern – Bearish Breakdown Ahead?#Bitcoin is forming a Head & Shoulders pattern on the 4-hour timeframe, signaling a potential bearish move. Currently, #BTC is hovering near the neckline—a key level to watch!
Bearish Confirmation: If #BTC breaks below the neckline and the support zone, it will confirm the bearish trend, potentially leading to further downside.
Trading Plan:
Wait for a clear break & retest of the neckline.
Enter a short trade with proper risk management.
Keep an eye on volume for strong confirmation.
Will #BTC hold or break down? Drop your thoughts in the comments!
ENA Possible Head and ShouldersENA might be forming an head and shoulders formation which could cause a significant drop in value.
Be careful if the level of 0.34 breaks. It's also a great short opportunity.
Thanks for reading.

$BTC Inverse Head and Shoulders Finally FormedAnd just like that, the Death Cross has formed the right shoulder for the Inverse H & S idea I formed on March 14th
We may sit a bit more downside to retest the 50WMA at $76k for confirmation
If we get a V-shaped recovery tomorrow, this very well could be the bottom for CRYPTOCAP:BTC

USDCAD, Bearish Bias, Fundamentally and TechnicallyFundamental Analysis
1. Endogenous and Exogenous factors indicates bearish trend in USDCAD.
2.USD is getting weaker in previous months while CAD is stronger
3. Seasonality also shoes bullish trend in CAD in April and Bearish in USD
4. COT report of USD indicates continuous reduction in long positions by NON-COM
5. Sentiments of USD and CAD are both bearish due to Tariffs but CAD will improve in coming days.
Technical Analysis.
1. Weekly chart shows Bearish RSI divergence with consolidation Box
2. Daily chart shows breakdown of consolidation box with Head and Shoulder pattern with retracement/retest
3. Entry of short sell in 2 parts
i. Enter at current price with 1% risk
ii. Enter at 1.43769
4. Stoploss above right shoulder 1.45597
5. Initial target at weekly support 1.39497

Dow jones - Head & Shoulder formation - Towards 36,500Dow Jones has Head & Shoulder breakdown,
With this it will have following targets possible,
37700 - 37200 - 36500

SP500,A BIRTH OF A NEW TREND (FURTHER DECLINE EXCEPTED)Sp500 has given birth a to new trend after forming bullish pattern from our previous analysis to give us ATH of 6k. It has form another bearish reversal pattern on weekly timeframe. We might see further declines in coming weeks. Overall target $4700 a $43,00

INVERTED HEAD & SHOULDERS ON 4HR TFSupport and resistance trap the market, forming a left shoulder, then breaking out of the support zone, forming an inverted head. The market now breaks back into the zone; wait for a retest and buy to the resistance. If the market breaks back out of support and closes, wait for a retest and sell at the support area. Collect your losses and look for the next setup.

Head & Shoulder Pattern in Making in NIfty 50 IndexI can see a clear Neck & shoulder Pattern in Making.
all international Markets are down and now on their Support Area.
Mostly all international Market should bounce back from here.
Nifty 50 once touches 22800 and if takes a support from here it should then proceed toward 23800 to complete H&S pattern.
There is a resistance @ 23800. If market break that resistance then 23800 should act as a Support and Market should Advance for 24800 levels.
"Otherwise"
if Market Crashes below 22800 and doesn't take support here next major support will be 22000 but this is less likely.
Hope for the best!
