Head and Shoulders
AVAXUSDT Breakdown Alert – Are Lower Lows Coming Next?Yello, Paradisers! Is AVAXUSDT gearing up for a bigger drop? Let’s break it down.
💎AVAXUSDT has turned bearish after breaking below its key support trendline. A Change of Character (CHoCH) confirms the shift to the downside, and right now, the price is rejecting from a critical 4H Fair Value Gap (FVG) and the 200 EMA resistance zone. Adding to the bearish pressure, we also see a 4H bearish divergence, making a downside move highly probable.
💎Moreover, AVAXUSDT is in the process of forming a Head & Shoulders pattern, which increases the risk-to-reward (RR) potential for short trades. On top of that, there’s liquidity resting below, which could act as a magnet, pulling the price further down.
💎However, if the price breaks out and closes a candle above the 200 EMA resistance zone, this bearish outlook will be invalidated. In that case, it’s better to wait for clearer price action before making any moves.
🎖Patience is key, Paradisers. Stick to the strategy, avoid emotional trading, and let the market come to you. The best setups will always present themselves to those who wait!
MyCryptoParadise
iFeel the success🌴
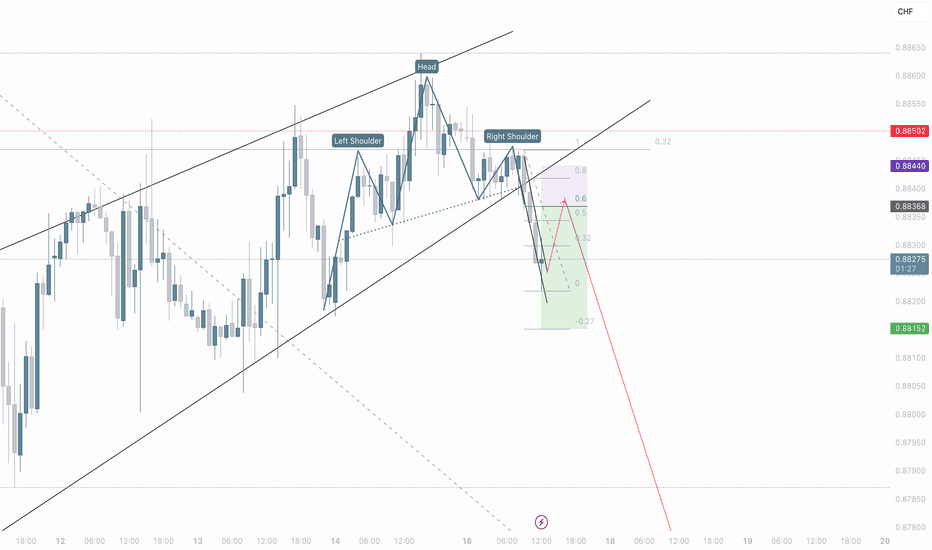
USD/CHF: Selling the Head & Shoulders BreakdownSpotted a clear H&S pattern on USD/CHF 15m chart!
Selling at 0.8826 with stop above 0.8844.
Target: First 0.8815, then possibly lower to the -0.27 Fib level.
The neckline break looks solid and we're still in the channel. Risk-reward looks good here.
What do you think? Are you bearish on USD/CHF too?
#USDCHF #Forex #TradingIdea
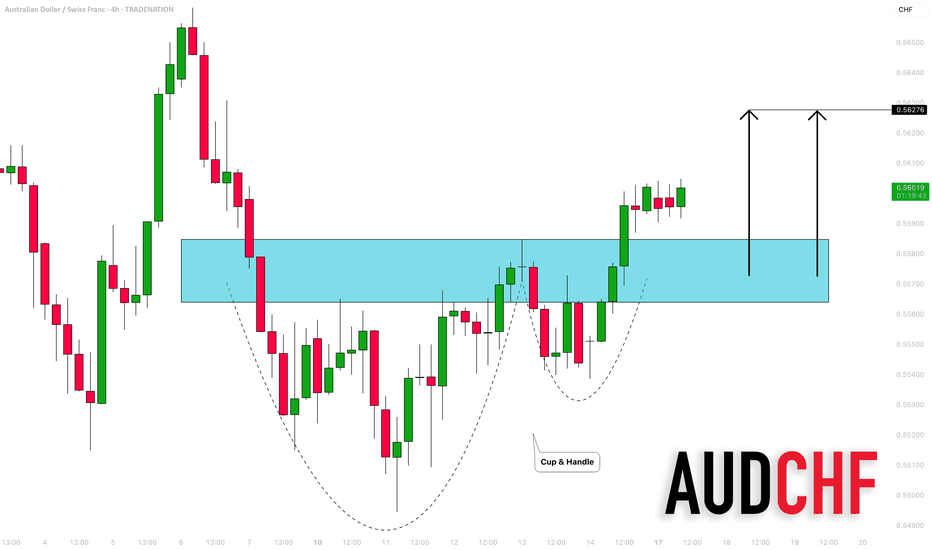
AUDCHF: Strong Bullish Continuation 🇦🇺🇨🇭
It looks to me that AUDCHF will continue rising.
A confirmed breakout of a neckline of a cup & handle pattern
on a 4H time frame provides a strong bullish signal.
The price will likely reach at least 0.5627 level soon.
❤️Please, support my work with like, thank you!❤️
I am part of Trade Nation's Influencer program and receive a monthly fee for using their TradingView charts in my analysis.
Gold (XAU/USD) – Head & Shoulders Pattern Analysis**📈 Gold (XAU/USD) – Head & Shoulders Pattern Analysis**
This chart represents the **Gold Spot (XAU/USD) 1-hour timeframe** and shows a potential **Head and Shoulders (H&S) pattern**, which is a bearish reversal signal. Let's break it down:
**🛠 Key Elements of the Chart:**
1. **📉 Head & Shoulders Formation (Bearish Sign)**
- **Left Shoulder**: Price makes a peak, then retraces.
- **Head (ATH – All-Time High at ~$3,005)**: The highest point before pulling back.
- **Right Shoulder**: Another peak, lower than the head, indicating weakness.
- **Neckline (Support Zone)**: Marked in red. A breakdown below this level confirms the pattern.
2. **📊 Exponential Moving Averages (EMA)**
- **EMA50 (Black Line)**: Indicates medium-term trend support.
- Price is testing this moving average, which acts as a dynamic support level.
3. **🔴 Resistance & Support Zones**
- **Resistance (Green Box near ATH)**: Selling pressure is strong at these levels.
- **Support (Red Zones)**: Price could test these areas if the H&S pattern plays out.
4. **📉 Bearish Projection (Blue Arrow)**
- If price **breaks below the neckline (~$2,974)**, it could drop to the next major support at **$2,940–$2,920**.
5. **📈 Bullish Scenario (Gray Arrow)**
- If price **rebounds from EMA50 and the support zone**, it could attempt another rally towards **$3,005 and beyond**.
### **📌 Trading Implications:**
✅ **Bearish Breakdown:**
- Sell below **$2,974** with targets at **$2,950–$2,920**.
- Confirmation comes from increased volume on breakdown.
✅ **Bullish Reversal:**
- If price holds above EMA50 and **breaks $2,990**, it could **retest ATH at $3,005+**.
- Strong buying interest could push gold to **$3,020–$3,050** in a risk-off environment.
### **🔎 Conclusion:**
📊 **Gold is at a critical level**—watch for a **breakout or breakdown** confirmation. A confirmed **H&S breakdown** could signal a retracement, while a **bounce above EMA50** keeps the **bullish trend intact**. 🚀💰 #XAUUSD
GOLD (XAUUSD): Correctional Movement Ahead?
After a test of 3000 psychological level, Gold looks overbought.
Analysing a 4H time frame, we can spot a completed head & shoulders pattern.
A bearish movement will be confirmed with a breakout of its horizontal neckline.
If a 4H candle closes below 2978, we can expect a retracement much lower
at least to 2955.
❤️Please, support my work with like, thank you!❤️
I am part of Trade Nation's Influencer program and receive a monthly fee for using their TradingView charts in my analysis.
Is PI Network About to Reclaim $3 Again ?Hello Traders 🐺
In this idea, I want to talk about the PI coin, which, in my opinion, is the best mobile mining app so far. I've been mining PI coins for at least 4 years and still holding them. PI Network has a solid team behind it and a strong community!
If you're still holding or planning to buy some for the upcoming Altcoin Season, I'm here to break down the chart and show you what's happening right now. So stay tuned until the end, and don't forget to like and follow for more support! 🌟
Chart Analysis 📈
As you can see, we have a strong downward-sloping blue trend line. Currently, the price seems to be forming an Inverse Head and Shoulders Pattern, which is a bullish signal. 🎯
However, make sure to wait for the breakout and retest as new support, at least on the 1H time frame. Regarding the price target of this pattern, I personally believe the next major resistance to the upside is the current all-time high around $3. 💰🔥
I hope you enjoy this idea! 💡
🐺 KIU_COIN 🐺
XRPUSDT after more range here more fall is ahead XRPUSDT is long-term still super bullish and we are looking for targets like 5$ and 10$ too but if the major resistance zone which is 3.1$ break to the upside else we are looking for more range here and even breakout of 2$ support zone to the downside and targets like 1.5$ and less and then we will update with long positions near that support zones mentioned on the chart too.
DISCLAIMER: ((trade based on your own decision))
<<press like👍 if you enjoy💚
Dollar General Corp Stock Quote | Chart & Forecast SummaryKey Indicators On Trade Set Up In General
1. Push Set Up
2. Range Set up
3. Break & Retest Set Up
Notes On Session
# Dollar General Corporation Stock Quote
- Double Formation
* A+ Set Up)) At 137.00 USD | Completed Survey
* (Target Entry Or Gap Fill)) | Short Bias Entry | Subdivision 1
- Triple Formation
* ((Inverted Pattern)) & Uptrend Area (TP1)| Subdivision 2
* ABC Flat Feature & (TP2) | Subdivision 3
* Daily Time Frame | Trend Settings Condition
- (Hypothesis On Entry Bias)) | Indexed To 100
- Position On A 1.5RR
* Stop Loss At 67.00 USD
* Entry At 62.00 USD
* Take Profit At 54.00 USD
* (Downtrend Argument)) & Pattern Confirmation
* Ongoing Entry & (Neutral Area))
Active Sessions On Relevant Range & Elemented Probabilities;
European-Session(Upwards) - East Coast-Session(Downwards) - Asian-Session(Ranging)
Conclusion | Trade Plan Execution & Risk Management On Demand;
Overall Consensus | Neutral
BITCOIN (#BTC): Bullish Outlook & Breakout
Bitcoin formed an inverted head and shoulders pattern on a 4 hours chart.
With the release of some fundamental news from US, the market surge
and violated its neckline and falling trend line.
2 broken structures compose the expanding zone.
I will look for a long position from there,
anticipating a bullish continuation at least to 88,043.
Dollar Index (DXY): Bullish Reversal is Coming?!
Dollar Index is stuck on a key daily horizontal support.
Analyzing the intraday time frames, I spotted an inverted head & shoulders
pattern on a 4H.
Its neckline breakout will be an important event that will signify a bullish reversal.
The index will continue recovering then.
Alternatively, a bearish breakout of the underlined blue support
will push the prices lower.
❤️Please, support my work with like, thank you!❤️
love you 3000 GOLDGOLD has seen hit the target of 3k.
looking gold base on Daily and Weekly candles it is still bullish. and it is very high potential to go far.
However on Friday with the high impact new of consumer sentiment and inflations expectation that suppose to be weak data for USD but gold did a strong sudden dip of about 200pips.
In the smaller time frame like M30/H1 gold seems to to make a reversal with HNS is clearly visible and also the entry in 3000 was very short within minutes it exit with a strong rejections.
so next week i expect to witness high volatility as last week growth of 1,250 pips exactly for the weekly candle itself from tip to tip.
i am still bias to buy but we got to be prepared to sell when there' s opportunities. hence for the either directions with few key zones to trade and only please trade within the zone with confirmation.
A self reminder for myself.
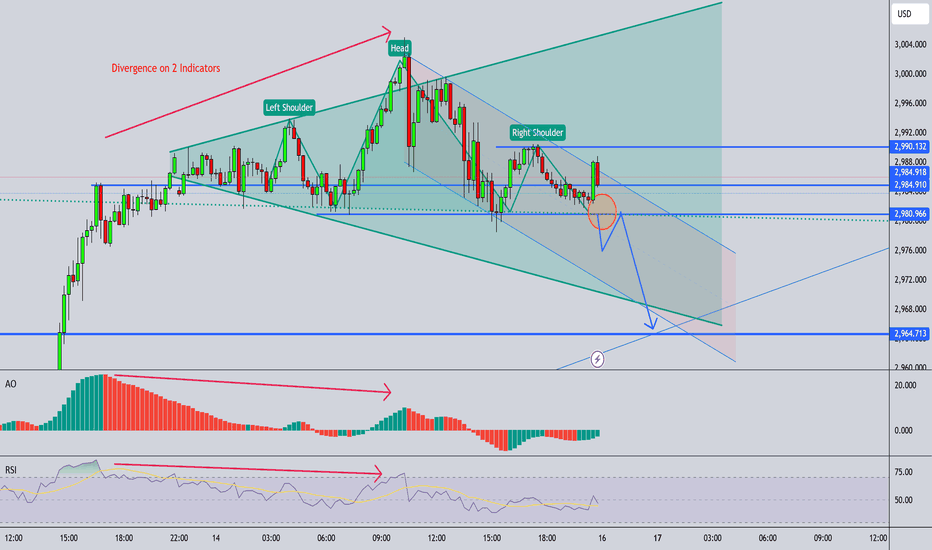
Gold Head & Shoulder Pattern, Possible shorting opportunities.Gold has recently formed a head and shoulders pattern on the chart, a classic bearish reversal signal that could indicate a potential decline in price. If the neckline is broken with strong volume, it may present a shorting opportunity for traders looking to capitalize on downside momentum.
Also showing bearish on 2 indicators ( RSI and MACD).
Also, in downward channels.
However, confirmation and risk management are essential before making any trading decisions.
Note :- This is not financial advice.
Gold Head & Shoulder Pattern, Possible shorting opportunities.Gold has recently formed a head and shoulders pattern on the chart, a classic bearish reversal signal that could indicate a potential decline in price. If the neckline is broken with strong volume, it may present a shorting opportunity for traders looking to capitalize on downside momentum. However, confirmation and risk management are essential before making any trading decisions. This is not financial advice.
Dow Jones 3-daily OutlookLooks like a confirmed double-top, might turn into a Head/Shoulders even.
Head Shoulders:
A common scenario with these is, it looks like a double top, then has a strong reclaim of the neckline, which is around 41.9k, and then a 2nd loss of it shortly after w/ yet another re-test with failure to reclaim.
Double Top:
Another common scenario is just a re-test and failure to reclaim, and this is a textbook double-top.
50/200 3-daily EMAs and MAs:
After losing the 50 EMA and MA, we keep dropping below the 200 EMA and MA on the 3 daily chart during stronger dips, and then finally recovering back above both.
Recovery or Recession?
Recovery:
If we want to see a recovery, we need to do that again. So, a strong move back above the 200 and 50 EMAs/MAs after losing both, down to around 38.5k and then 37.5k, possibly as low as 36.3ish.
Or, for a more immediate flip to bullish, we need to reclaim ~41.9k during any re-tests, and then head to a new ATH above 45k.
Recession:
If we don't bounce from just below the 200 EMA and MA, we might see an extended move down or even a recession.
#BTCUSDT: BULLISH BREAKOUT IN LTF!!🚀 Hey Traders!
If you're finding value in this analysis, smash that 👍 and hit Follow for high-accuracy trade setups that actually deliver! 💹🔥
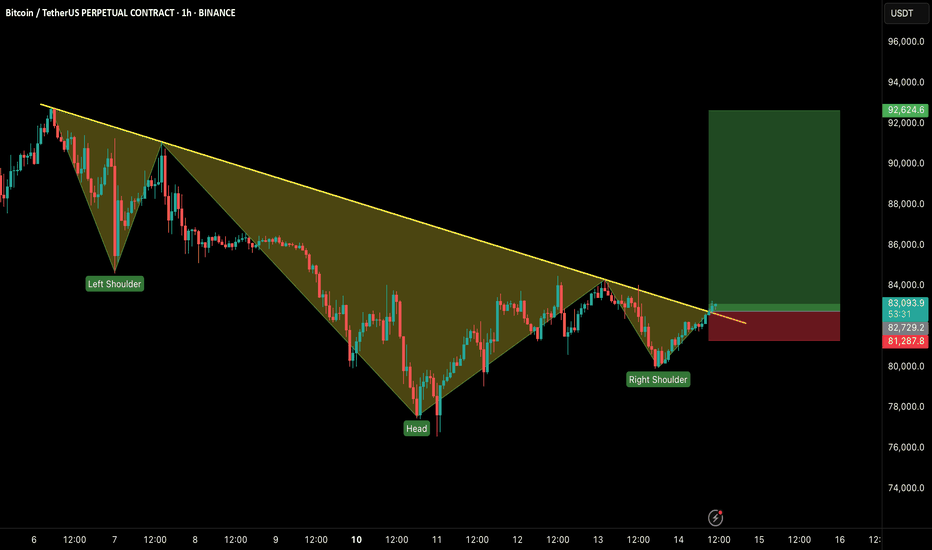
BTC is breaking out from an inverse head & shoulders pattern on the 1H timeframe, signaling strength! 📈 If it holds above the neckline, we could see a strong rally toward $90K– GETTEX:92K in the coming days! 🚀
🔹 Key Levels to Watch:
✅ Target: $90K– GETTEX:92K
❌ Invalidation: Close below $81,200
Momentum is building—can bulls take control? Let us know in the comment section.
XAUUSD (Gold) daily market analysisThe momentum is still up and it looks like gold is poised to retest the 2950 levels again, unless we see some healthy candle closures towards the 2895 levels.
Join me, a CFA charterholder, as I breakdown the daily market scenario for XAUUSD (GOLD). Whether you're a beginner or an experienced trader, this video is packed with insights to help you improve your trading game. Don't forget to like, comment, and subscribe for more trading tips and strategies!


