AUDCHF: Strong Bullish Chart Pattern 🇦🇺🇨🇭
AUDCHF formed an inverted head & shoulders pattern on a 4h time frame
after a test of a key intraday/daily horizontal support.
After a deep retest of a broken neckline, we finally see a positive bullish reaction.
I think that the market will rise and reach 0.56 level soon.
❤️Please, support my work with like, thank you!❤️
I am part of Trade Nation's Influencer program and receive a monthly fee for using their TradingView charts in my analysis.
Head and Shoulders

Inverted H&S$apm.to NASDAQ:APM $apm.v measured-move target $3.50. Looking at market cap and what they have coming down the growth pipe, I think that's a conservative target.
Will check back later. I'm long.

SILVER (XAGUSD): Pullback From Resistance
In comparison to Gold, Silver looks bearish after a test of a key daily resistance cluster.
A head and shoulders pattern on an hourly time frame confirms a local
bearish sentiment and overbought state of the market.
The price may continue retracing at least to 3291 level.
❤️Please, support my work with like, thank you!❤️
I am part of Trade Nation's Influencer program and receive a monthly fee for using their TradingView charts in my analysis.

BTC inverted HNSBTC has seem to make a characyeristic to climb back up.
for now bias is a buy.
probably to cover value gap from the decent from 91-92k
the decent was substancial that it fail to return until today.
so its logic for its return

XRPUSDT: A Massive Move Is Coming – But Will It Be Up or Down?Yello, Paradisers! Are we about to see an explosive breakout in XRP, or is a deeper pullback lurking around the corner? Let’s break it down.
💎XRPUSDT has formed a falling wedge alongside a bullish divergence, signaling a potential upside move. Adding to the bullish case, we also see an inverse head & shoulders pattern forming underneath – a combination that significantly increases the probability of a breakout.
💎For a high-probability bullish confirmation, we need a breakout and candle close above the falling wedge.
💎That said, if price retraces deeper, we should be watching the major support zone for a potential bounce. A bullish I-ChoCH on lower timeframes will serve as the key confirmation for a reversal.
💎The invalidation level? If XRPUSDT breaks down and closes candle below the major support zone, this bullish setup will be completely invalidated.
🎖Stay sharp, Paradisers. The next move will decide everything! As always, discipline and patience will separate the winners from the crowd. Be strategic, trade smart, and wait for the highest probability setups.
MyCryptoParadise
iFeel the success 🌴

AUDJPY: Bullish Continuation Confirmed 🇦🇺🇯🇵
On a today's live stream, we spotted a confirmed bullish reversal on AUDJPY.
The price formed a huge inverted head & shoulders pattern on a 4H
and violated its neckline during the London session today.
A bullish movement is now expected at least to 94.0
❤️Please, support my work with like, thank you!❤️
I am part of Trade Nation's Influencer program and receive a monthly fee for using their TradingView charts in my analysis.

AMERICA'S BITCOIN MINER: CLEANSPARKThe chart for Ethereum Futures is showing a promising inverse head and shoulders pattern. This indicates a potential turnaround for the struggling bitcoin mining industry. It appears that miners are behaving more like altcoin investors rather than taking a leveraged stance on Bitcoin. This shift suggests that their fortunes are more closely tied to the performance of Ethereum rather than Bitcoin itself.
Here’s what you should be aware of: CleanSpark (#CLSK), is set to be added to the S&P SmallCap 600 index on March 24.
This index features smaller publicly traded companies in the U.S. that have a market cap exceeding $1 billion and fulfil certain financial requirements.
Being included in this index may enhance CleanSpark’s visibility, boost its trading volume and liquidity, and draw in more institutional investors.
CleanSpark is the second crypto miner to be added to the index after peer Marathon Digital was added to the list last year.
Companies in the index typically benefit from increased trading volume and improved liquidity, making their shares more accessible to a broader pool of investors.
"CleanSpark's inclusion enhances visibility within the investment community," CEO Zach Bradford said in the announcement. “Our inclusion enhances visibility within the investment community and gives us an opportunity to demonstrate the value of being a pure play, vertically integrated Bitcoin mining company and making exposure to our model more broadly available."
CleanSpark operates bitcoin mining facilities across the U.S., focusing on energy efficiency and cost-effective power sources. The company has expanded its operations over the past year with the acquisition of peer GRIID Infrastructure.

NZDJPY, Double Bottom and Inverted H&S, Bullish Move ExpectedDouble Bottom on 4h TF
inverted head and shoulder on 1h TF
Bullish Divergence
Breakout expected
Fundamentally JPY is slightly bearish which could trigger Breakout
Buy @ CMP
Sl Below double bottom
Take Profit on mentioned levels

BREAKOUT push to the upsideThere a high chance that EURJPY will break above the Zone and continue heading up for sometime. We can see according to the price analysis that the downtrend is finished and market formed a strong Invert H&S pattern which indicates strong buyers. Price is now in the Major Key Level with a high chance of breaking through due to the strong bullish momentum and if a clear breakout occurs then that means price will continue heading up

Sanmina Corp Stock Quote | Chart & Forecast SummaryKey Indicators On Trade Set Up In General
1. Push Set Up
2. Range Set up
3. Break & Retest Set Up
Notes On Session
# Sanmina Corp Stock Quote
- Double Formation
* (Diagonal) | Completed Survey & Entry Bias
* Inverted Pattern On Long Bias Entry | Subdivision 1
- Triple Formation
* (Uptrend Argument)) At 63.00 USD | Subdivision 2
* ((No Trade)) | Invalid Execution On Trade Entry | Subdivision 3
* Daily Time Frame | Trend Settings Condition
- (Hypothesis On Entry Bias)) | Indexed To 100
- Position On A 1.5RR
* Stop Loss At 159.00 USD
* Entry At 187.00 USD
* Take Profit At 228.00 USD
* (Uptrend Argument)) & Pattern Confirmation
* Ongoing Entry & (Neutral Area))
Active Sessions On Relevant Range & Elemented Probabilities;
European-Session(Upwards) - East Coast-Session(Downwards) - Asian-Session(Ranging)
Conclusion | Trade Plan Execution & Risk Management On Demand;
Overall Consensus | Buy

XRPUSDT soon can dump below 2$ As we can see on daily chart we the head and shoulders is forming and if the support of this head and shoulders break which is 1.95$ support zone then heavy dump will lead and we are looking for at least -50% dump from here and targets like 1.5$ and lower and maybe after that if the support hold then 5$ is also expected.
DISCLAIMER: ((trade based on your own decision))
<<press like👍 if you enjoy💚

Bajaj_Auto towards 5500Bajaj Auto has Head & Shoulder pattern breakdown.
This will lead it to 5500 with following targets;
7000 / 6500 / 6000 / 5500

#BTC: IS THE BULL MARKET OVER??🚀 Hey Traders!
If you're finding value in this analysis, smash that 👍 and hit Follow for high-accuracy trade setups that actually deliver! 💹🔥
Is the Bull Market Over? 🤔
The big question on everyone's mind—Has the bull market ended? My answer is NO! Let’s break it down:
📊 Technical Perspective:
As you can see in the chart, BTC recently broke out from an inverse head and shoulders pattern on the weekly timeframe. This current dip? It’s nothing but a healthy retest of the breakout ($72k-$75k). Once BTC successfully confirms this retest, we should see a strong push to the upside. Patience is key!
🌍 Fundamental Perspective:
1️⃣ Institutional Adoption: Big players like BlackRock, Fidelity, and global hedge funds continue accumulating BTC, Also adopting by some big countries like US proving confidence in the long-term trend.
2️⃣ ETF Inflows: Bitcoin Spot ETFs have seen billions in inflows—indicating that traditional finance (TradFi) is betting on BTC’s future.
3️⃣ Macroeconomics: With the Fed slowing down rate hikes, liquidity might start flowing back into risk assets, benefiting BTC and crypto as a whole.
🔍 The Key Level to Watch:
A successful bounce from the neckline of this pattern will confirm strength and could send BTC soaring to new highs!
🔥 What’s your take? Drop your thoughts in the comments, and let’s navigate this market together! 🚀💰

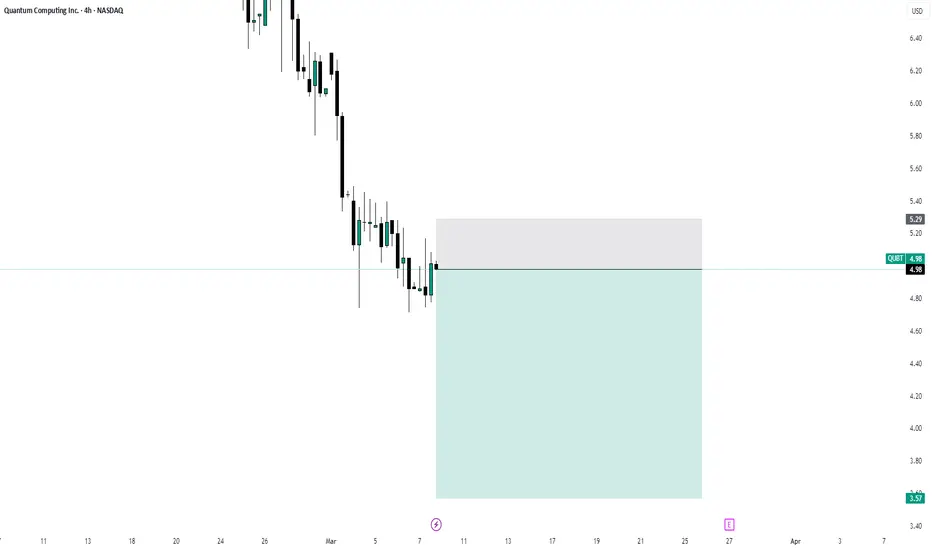
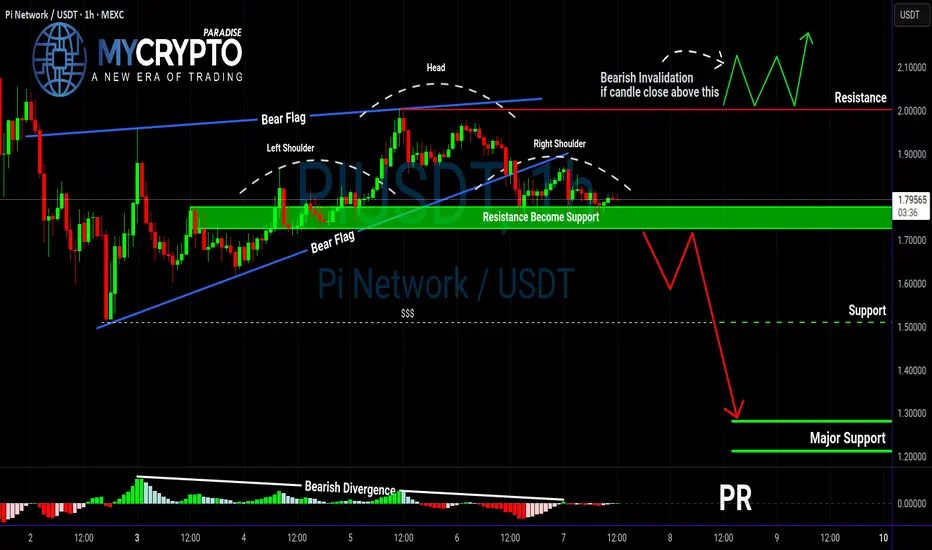
PIUSDT Breakdown Incoming? Bearish Patterns Are Stacking Up! Yello, Paradisers! Is PIUSDT about to break down hard? The charts aren’t looking great, and the confluence of bearish signals is something we can’t ignore.
💎PIUSDT has formed a bear flag on the higher timeframe, a classic continuation pattern that suggests further downside. This alone is already a bearish signal, but there’s more.
💎On the lower timeframe, we can see a head & shoulders pattern forming, along with bearish divergence. These factors together significantly increase the probability of a move to the downside.
💎In the case of PIUSDT breakdown and closes candle below the support zone, this will confirm the bearish setup and likely trigger selling pressure. A breakdown at this level would validate both the bear flag and the head & shoulders pattern.
💎If the price bounces from here, the bearish bias still remains, but there’s also a chance that the market is setting a trap within this range. This makes it a high-risk zone, so it’s better to avoid trading here until a clearer move develops.
💎However, If the price breaks and closes candle above the resistance zone, the bearish outlook will be completely invalidated. In that case, it’s smarter to wait for a more defined price action before making any moves.
🎖Patience is key, Paradisers. The market loves to shake out inexperienced traders before the real move happens. Stay disciplined, focus on high-probability setups, and trade like a pro. Only those who truly understand market cycles will capitalize in the end!
MyCryptoParadise
iFeel the success 🌴
JUP in Danger: Are We in for a Crash?JUP has been on a four-day downtrend, and it's starting to show its bearish side. The token has lost its yearly open, which was a major support level. Let’s break down the key support and resistance to see what the chart is telling us.
Support & Resistance
Resistance:
Yearly Open & Monthly Level: JUP has dropped below the yearly open at $0.8169 and the monthly level at $0.7427
Support:
Long-Term Range & Liquidity: JUP has been trading within a range for over 300 days, with a significant amount of liquidity below the low at $0.6328 from 5 July 2024.
POC: The volume profile shows the POC sitting at around $0.5, marking an attractive entry point for a long position.
Fibonacci Confluence: The 0.786 Fibonacci retracement level falls just below the key low at $0.431 (a level last seen on 12 February 2024), offering a great long trade setup.
Long Trade Opportunity:
Alarms are set, let's see if JUP drops to these key support levels. If it does, we could have a solid long setup on our hands.

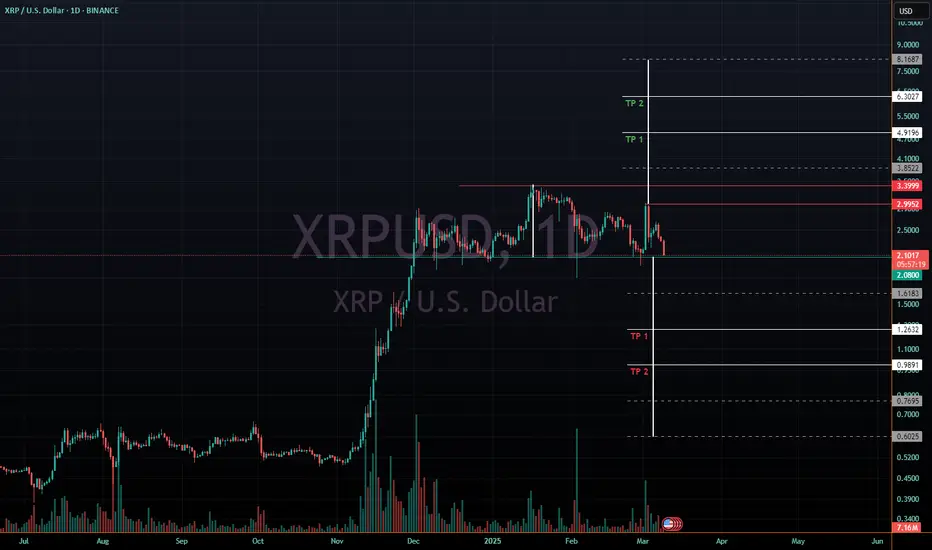
Head Shoulders Bull and Bear TargetsLose $2.08 - Ripple will move down to 1.26 and then 98 cents approx
Hold 2.08 and reclaim ~3 dollars - Ripple can move up to 4.91 and then 6.3
Dashed lines are additional possible targets if it continues in either direction, the first dashed lines also mark halfway points to bull or bear TP 1
What is Double Top or Double Bottom and how it works?Hello in this educational content we are talking about one of the major reversal pattern in market or maybe even the most important reversal pattern which is exist.
Double Top: Like the pattern mentioned on the chart now double Top is made by two reject from resistance but it is complete when the support or neckline of this two top break and then the pattern is complete and we can say this is a valid double Top and market now can get correction and get bearish.
here is chart & example take a look at Two kinds of Double Top available in my View:
As we can see sometimes price even made fake breakout to the upside or downside of the pattern and in these kinds of situation we can expect more fall if we had Advance Double Top because the liquidity was more at the beginning of second phase rejection.
We also have other Strong Reversal patterns like Head & shoulders and ... which you can mention them in comments or we may have another live post for them in next Educational posts.
most of You know about Regular Double top or Double Bottom and in this Educational post we mention some data about Advance form of it too and also so many know this form as regular form and consider this fake breakout a sign of good double Top and ....
Double Bottom is the same like the Double Top but reverse(This time support can not break two times and price after breaking neckline or resistance start to pump and bear market turn to bullish with Double Bottom).
DISCLAIMER: ((Always trade based on your own decision))-----this post is not signal content or analysis and just Try to talk about an important Reversal pattern with Example which happened also on Bitcoin in previous days in my Opinion.
<<press like👍 if you enjoy💚

ETHUSDT +30% in next 10 days (4h RSI BULLISH DIVERGENCE)Upcoming FED meeting, 18-19. March can be breakout SELL THE NEWS event
MA 80 and MA200 cross the graph
4H Head and Shoulders formation
4H RSI bullish divergence
This is enough reason to believe in a 30% increase in BINANCE:ETHUSD over the next 10 days.
Link: www.federalreserve.gov

Pentamaster, Is the downtrend getting weaker ?As you can see, Daily Chart is making chart pattern QM (Quasimodo). Buy at current price better because it is not high liquidity (hard to match price). With risk reward 1:3.

MVB Financial Corp Stock Quote | Chart & Forecast SummaryKey Indicators On Trade Set Up In General
1. Push Set Up
2. Range Set up
3. Break & Retest Set Up
Notes On Session
# MVB Financial Corp Stock Quote
- Double Formation
* Pattern Confirmation | Inverted Feature
* (Consolidation Argument)) | Area Of Value | Subdivision 1
- Triple Formation
* Wave 1, 2 & 3 | Ongoing Wave Structure | Subdivision 2
* Retracement Area At 19.00 USD | Entry Bias | Subdivision 3
* Daily Time Frame | Trend Settings Condition
Active Sessions On Relevant Range & Elemented Probabilities;
European-Session(Upwards) - East Coast-Session(Downwards) - Asian-Session(Ranging)
Conclusion | Trade Plan Execution & Risk Management On Demand;
Overall Consensus | Sell

HD 3d chart, 2025NYSE:HD falling from it's head and shoulders. Keep an eye on this one as this could be the canary in the coal mine for housing starts.

SOL formed Weekly H&S, Pump Potential Could Be HugeLast time, I shared an analysis predicting that CRYPTOCAP:SOL could drop to $131 to form the second right shoulder of a massive Head and Shoulders Bottom. (I’ve included the related publications for you to check.)
That drop has played out recently, and COINBASE:SOLUSD has hit the target.
The weekly Head and Shoulders Bottom on BINANCE:SOLUSDT looks perfect, with two dips on each shoulder and nearly identical drop sizes.
If this pattern holds, the upside potential is massive—breaking $1,000 could just be a matter of time (and that might even be a conservative target).
But, please always set a stop-loss for your trades—there are no guarantees in any scenario.
🔴 Read my signature & publications for more info you don’t want to miss.
🔥 for more future "guesses" like this!
