PYPL possible H&S patternIf stock fails retest of ~$89 mark, we could see the stock drop back to $85 and test support there. PYPL has already broken the trendline that started at $58 and reached as high as $94.
Head and Shoulders

FETUSD H&SHead and Shoulders Formation
Fetch.ai (FET) against the US Dollar (USD) has formed a classic head and shoulders (H&S) pattern, which is one of the most reliable reversal patterns in technical analysis. The price has recently broken below the neckline, a critical support level, and is now expected to retest the broken support structure to confirm the pattern's validity. This development suggests a potential shift in market sentiment from bullish to bearish, and it’s worth exploring the implications of this pattern in greater detail.
1. Breakdown of the Head and Shoulders Pattern
The head and shoulders pattern is a bearish reversal formation that typically occurs at the end of an uptrend. It consists of three distinct peaks:
Left Shoulder: The price reaches a high, retraces, and forms a trough.
Head: The price rallies to a higher high, surpassing the left shoulder, and then retraces again.
Right Shoulder: The price forms a lower high, failing to reach the height of the head, and then breaks below the neckline, which is the support level connecting the troughs of the left shoulder and head.
The breakdown below the neckline confirms the pattern and signals a potential trend reversal. The price often retests the neckline from below before continuing its downward move, which is what we’re currently anticipating in FET/USD, my area of immediate target is 0.80000.
What do you think of this analysis?

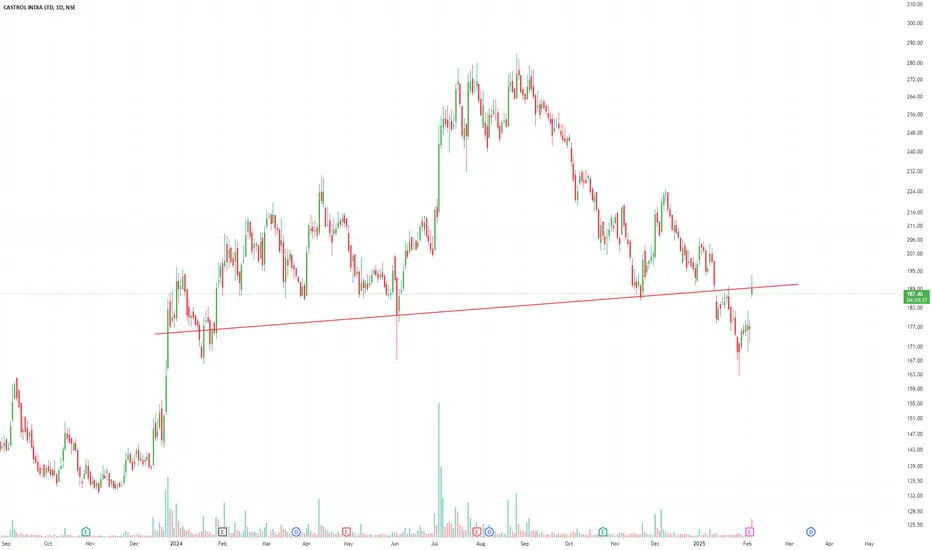
H&S Breakdown and Retest in CASTROLINDNSE:CASTROLIND formed a slightly tilted H&S followed by breakdown and now retest seem to be in progress. Depending on how the day closes, this could be a nice shorting opportunity.
As per the size of head, target would be around 125. However, due to the left side tilt (which reflects lack of extreme weakness), it would be prudent to go with a smaller fall, if at all this materializes.
Doge is next moveForming head and shoulders in daily chart.. may go till 0.3 usdt ,then should go back to 0.14usdt.. let's see..

Avalanche Cryptocurrency Quote | Chart & Forecast SummaryKey Indicators On Trade Set Up In General
1. Push Set Up
2. Range Set up
3. Break & Retest Set Up
Notes On Session
# Avalanche Cryptocurrency Quote
- Double Formation
* (Reversal Argument)) + (Inverted Head & Shoulders)
* (TL)) | 1 & (TL)) | 2 | Triangle Structure | Subdivision 1
- Triple Formation
* 1st Numbered Retracement | Downtrend | Subdivision 2
* 2nd Numbered Retracement | Bias Structure | Subdivision 3
* Daily Time Frame | Trend Settings Condition
Active Sessions On Relevant Range & Elemented Probabilities;
European Session(Upwards) - US-Session(Downwards) - Asian Session(Ranging)
Conclusion | Trade Plan Execution & Risk Management On Demand;
Overall Consensus | Neutral

DOLLAR INDEX (DXY): Does The Market OVERREACT?
It looks like Dollar Index is preparing for a retracement
after a very bullish market opening.
As a clear sign of strength of the sellers, I see
a head and shoulders pattern on an hourly
and a breakout of its neckline.
The market may drop at least to 108.6
❤️Please, support my work with like, thank you!❤️

On its way to 78k?As I said in my last posted idea (Day scale), two steps down, one step up. I see another H&S formation and I would set my Stop Loss a bit higher above the right shoulder but when I wake up in the morning I expect to be well into profit with a SHORT. Just my opinion.

A neckline breakout can push price to previous lowsThe market created resistance at an old support zone
price has also broken out of our trendline, if price breaks out
of our neckline as well we may expect a push towards previous lows or a divergence to form.

Silver towards 24 (Possible 15% Correction)Head & Shoulder pattern break down in Silver,
It will have possible target of 27 / 25 / 24

XRPUSDT: Ellio analysisHello Friends. According to the chart we see the 4th wave of 5 and 1-2 of wave 5: so completed I expected continued to formed wave 3-4-5 of wave 5: , to reach 3.8 and 4 $

Head and shoulder on weeklyBank nifty is fighting for its life after breaking down from neck line in head and shoulder pattern
Budget is not going to help it much

ProPetro Holding Corp. Stock Quote | Chart & Forecast SummaryKey Indicators On Trade Set Up In General
1. Push Set Up
2. Range Set up
3. Break & Retest Set Up
Notes On Session
# Propetro Holding Corp. Stock Quote
- Double Formation
* 10.00 USD | Area Of Value
* (Continuation Argument)) | Subdivision 1
- Triple Formation
* 1st Retracement | Uptrend Bias & Entry | Subdivision 2
* 2nd Retracement | Numbered On Short Entry | Subdivision 3
* Daily Time Frame | Trend Settings Condition
Active Sessions On Relevant Range & Elemented Probabilities;
European Session(Upwards) - US-Session(Downwards) - Asian Session(Ranging)
Conclusion | Trade Plan Execution & Risk Management On Demand;
Overall Consensus | Sell


AUDUSD longAUDUSD is long as per VOLUME confirmation on Daily and liquidity Hunt.
Tp1 is 0.65385
Tp2 is 0.67500
Tp3 is 0.68744

GBPJPY: Very Bearish Chart Pattern 🇬🇧🇯🇵
I see a perfect example of a completed head & shoulders pattern
on GBPJPY on a 4H time frame.
A breakout of its neckline is a strong bearish signal.
I think that the price will continue falling soon.
Goals: 191.38 / 190.7
❤️Please, support my work with like, thank you!❤️


XAU/USD $$$
Well, after forming a new ATH, gold made a correction and made a new high on the 15-minute time frame.
At this moment, all the time frames on the gold chart are bullish and we should only think about buying. There are 3 scenarios
Scenario 1: We enter a buy trade after the confirmation of the lower time frame in this 15-minute area
Scenario 2: We enter a buy trade after attracting liquidity with a confirmation of the 5-minute area
Scenario 4: We enter a buy trade after the price reaches the 4-hour area.
(The probability of scenario 4 is low)
Because the uptrend is very strong

Potential back to SouthVery strong Weekly resistance zone that has recently been tested twice. Head and shoulder pattern can reveal itself. Be patient to see price break the latest 4h uptrend line that coincide with right shoulder. Once that happens, be ready to sell on pull back.

Longggg Term Best Buy #adobeMay be not towards the end of 2025, but for more long term
Fundamental Reasons:
A diversified Tech Business which operates as a technology company worldwide. It operates through three segments: Digital Media, Digital Experience, and Publishing and Advertising.
Its CEO, Shantanu has been recognized by several publications as one of the world’s leading executives, including Barron’s World’s Best CEOs and Fortune Businessperson of the Year lists, and named a Top CEO by Glassdoor based on employee feedback. He is a recipient of India’s civilian honor Padma Shri and the Economic Times Global Indian of the Year award.
10 years revenue CAGR is 6.5 %
The largest Market Cap in its Sector > 192 B USD
Technical Reason:
On Monthly chart it took 4 years to make a Head & Shoulder pattern.
The best monthly closing on 31st Jan 2025 , the doji which is signalling for long term bullish reversal at the end of its right shoulder on montly chart.
This week it enters into its strong resistance Level above 440 - 446
Come to Daily chart, a bullish Harami formed on 29th January .
If this level remains till tomorrow, 31st Jan 2025 , then we have a strong bullish reversal.
1st Long Term Target 700
2nd Long Term Target 800
Best Of luck to me you all!!!


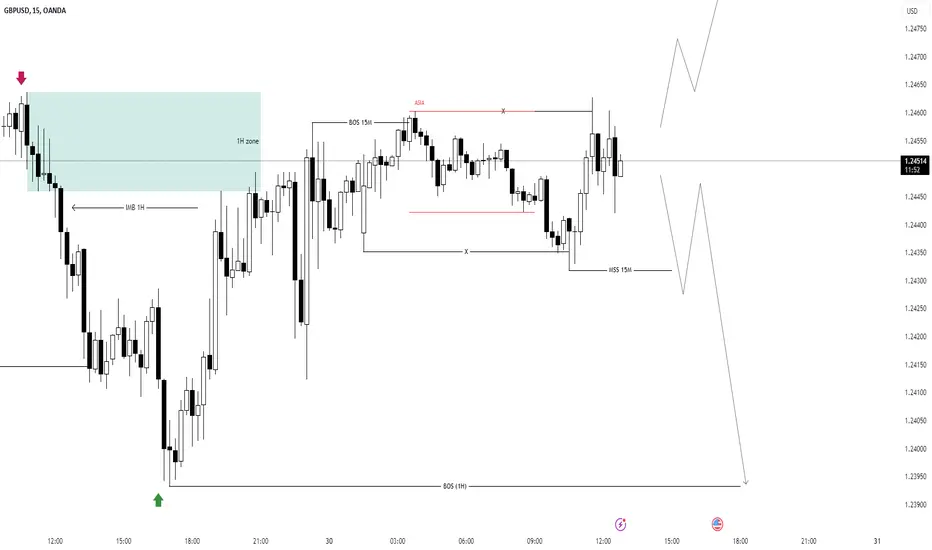
GBP/USD $$$
The pound is currently in the 1-hour zone. The Asian ceiling and floor liquidity has been removed.
Scenario 1: The 15-minute low is broken, with a 5-minute or 3-minute confirmation in the order block area, enter a sell trade like the euro
Scenario 2: After the ceiling is broken and the order block is formed in the 5-minute or 3-minute time frame, enter a buy trade
(Scenario 1 is more likely than scenario 2)
Because the trend is down
xau shortgold short based on the H4, H1 and m15 time frames
H4 forming a head and shoulders pattern
gold to retest the H1 break
really tight stop loss because of news
tp 1 at m15 zone of interest
tp2 at H1 zone of interest
tp3 at H4 zone of interest
entries must be observed from lower time frame structure make sure entry models like lower lows, engulfing candle formations etc. are criteria for entries
