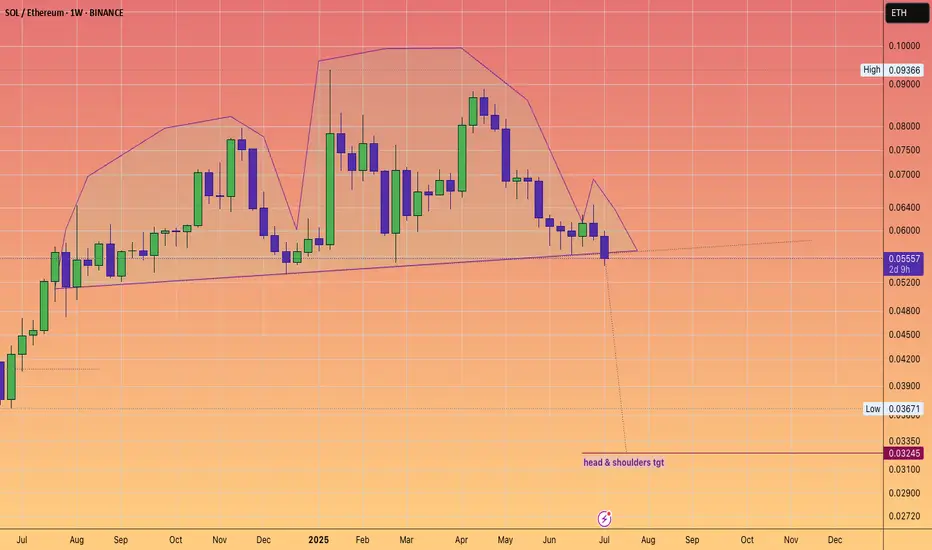
Boomers buying Ethereum not SolanaRatio has broken a head and shoulders
Stablecoin supercycle
Tom Lee
SBET
ETH treasury #fomo
Head and Shoulders
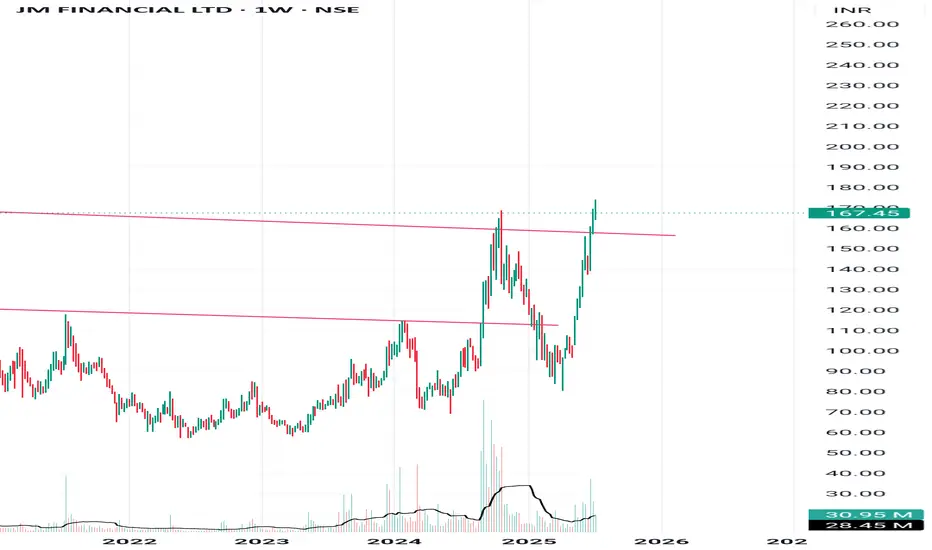
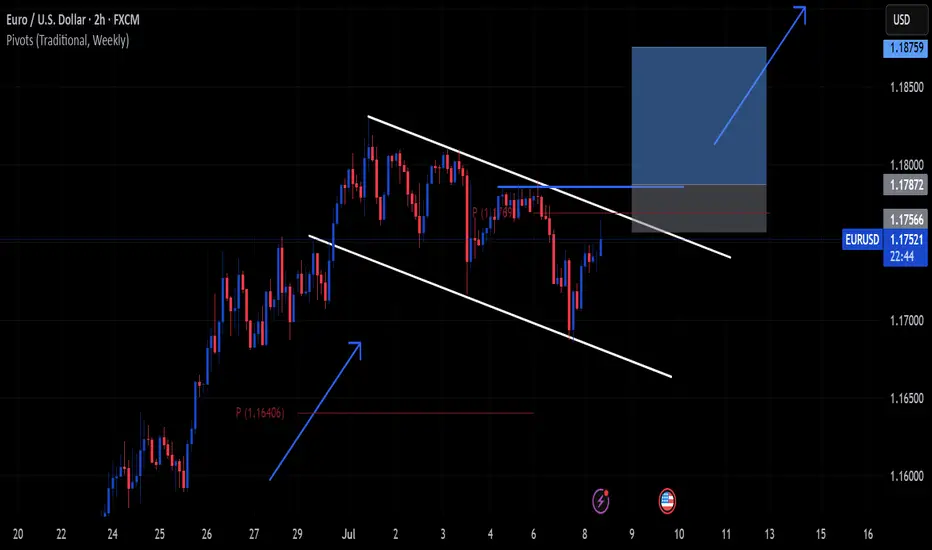
Clear breakout Clear trendline breakout and good to go long. Check volume and do your own analysis too. This is only for educational purposes.
Educational: how to spot bitcoin tops before they happenBitcoin is rising, but how far can it go? In this video, I walk through key tools to spot local tops, including funding rates, Twitter sentiment, and pattern targets. We also discuss setups in XRP and Solana, and what to watch ahead of the US crypto regulation update on July 22.

ZEN/USDT Daily Chart: Accumulation Before the Big Move? Hey traders! Let’s dive into this daily ZENUSDT chart. Horizon is in a sideways accumulation phase, forming an Expanding Wedge right after a massive bullish Falling Wedge breakout.
We’re also seeing a small inverted head and shoulders at the bottom support range of $7.08-$10.08 , with the neckline at $10.08 . ZEN recently revisited this level, and a confirmed breakout could propel it toward $18.08-$28.94 , with a major target at $41.15 .
If the breakout fails, we might see a pullback to the neckline at $10.08 or the shoulder support at $8.28 .
Key Levels to Watch:
Resistance: $18.08, $28.94, $41.15
Support: $8.28
Breakout Target: $41.15
Breakdown Risk: $8.28
Is ZEN about to skyrocket, or will this breakout fail? Let’s hear your thoughts below!

STNG | Inverted H&S Breakout –Target +44% at 65 Major resistance📍 Ticker: NYSE:STNG (Scorpio Tankers Inc. – NYSE)
📆 Timeframe: 1D (Daily)
📉 Price: $45.62
📈 Pattern: Inverted Head & Shoulders + Breakout from Long-Term Falling Resistance
📊 Breakout Probability (estimated): 93% breakout success, 83% to measured target
🔍 Technical Setup:
STNG has completed a confirmed breakout from a textbook Inverted Head and Shoulders pattern, reinforced by a multi-month descending trendline break. This aligns with a multi-technical confluence zone, with the neckline holding as support.
✅ Classic reversal structure
📈 Strong breakout candle with volume > 2x average
🟢 RSI above 64 and no bearish divergence
📐 Measured move projection suggests two major upside targets
📏 Target Projections (from breakout at $41):
🎯 Target Price Return
Target 1 $51.98 +22.5%
Target 2 $65.83 +44.0%
📌 Both targets align with prior horizontal resistance and upper descending trendline intersections
🧠 Trade Plan:
📥 Entry Zone: $44.50 – $46.00 (post-breakout, wait for confirmed structure)
⛔ Stop-Loss (Trailing): Start below $40.00 → trail as price confirms above $48.00
🔁 Partial stop logic: Use under neckline, then adjust dynamically with trend support
📊 Estimated Probabilities:
📐 Pattern: Inverted Head & Shoulders
🔺 Breakout success rate: 93%
🎯 Target met probability: 83%
🔁 Throwback chance: 68% → ideal entry if price retests $41
⚠️ Technical Signals to Monitor:
🔎 Volume remains elevated → confirms institutional interest
✅ RSI trending above 60 → bullish momentum intact
📉 Wide base and upward neckline = higher success probability
📈 Price now in upward sloping channel → bias continues up unless trendline fails
💬 STNG is delivering a clean multi-pattern breakout, backed by volume, RSI confirmation, and a textbook technical structure. If momentum holds, this setup may be one of the highest-probability mid-term swing plays on the NYSE right now.
Follow @TargetTraders for high-probability technical trades
#STNG #TechnicalBreakout #InvertedHeadAndShoulders #PatternTrading #ChartPatterns #NYSEStocks #VolumeBreakout #SwingSetup #BreakoutTrade #SwingTrade #TargetTraders

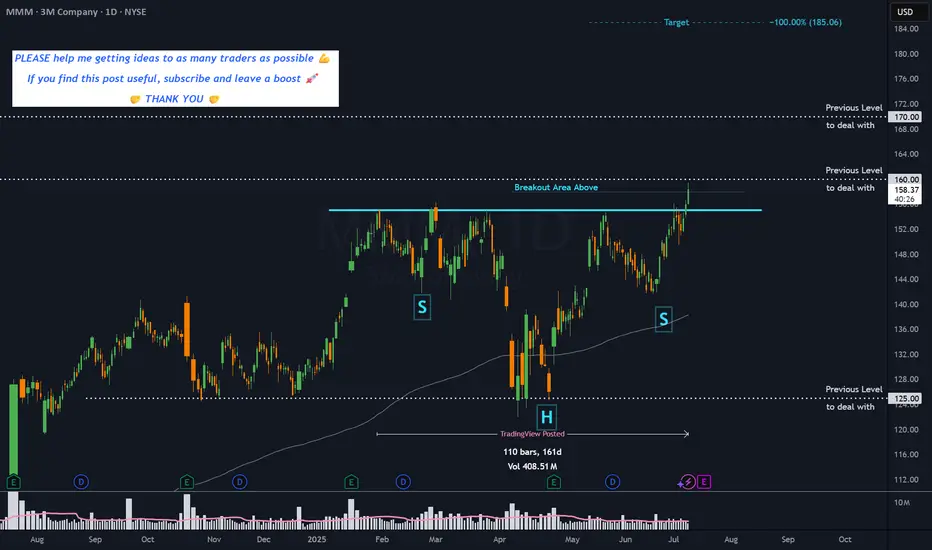
MMM - 5 months HEAD & SHOULDERS CONTINUATION══════════════════════════════
Since 2014, my markets approach is to spot
trading opportunities based solely on the
development of
CLASSICAL CHART PATTERNS
🤝Let’s learn and grow together 🤝
══════════════════════════════
Hello Traders ✌
After a careful consideration I came to the conclusion that:
- it is crucial to be quick in alerting you with all the opportunities I spot and often I don't post a good pattern because I don't have the opportunity to write down a proper didactical comment;
- since my parameters to identify a Classical Pattern and its scenario are very well defined, many of my comments were and would be redundant;
- the information that I think is important is very simple and can easily be understood just by looking at charts;
For these reasons and hoping to give you a better help, I decided to write comments only when something very specific or interesting shows up, otherwise all the information is shown on the chart.
Thank you all for your support
🔎🔎🔎 ALWAYS REMEMBER
"A pattern IS NOT a Pattern until the breakout is completed. Before that moment it is just a bunch of colorful candlesticks on a chart of your watchlist"
═════════════════════════════
⚠ DISCLAIMER ⚠
Breakout Area, Target, Levels, each line drawn on this chart and any other content represent just The Art Of Charting’s personal opinion and it is posted purely for educational purposes. Therefore it must not be taken as a direct or indirect investing recommendations or advices. Entry Point, Initial Stop Loss and Targets depend on your personal and unique Trading Plan Tactics and Money Management rules, Any action taken upon these information is at your own risk.
═════════════════════════════
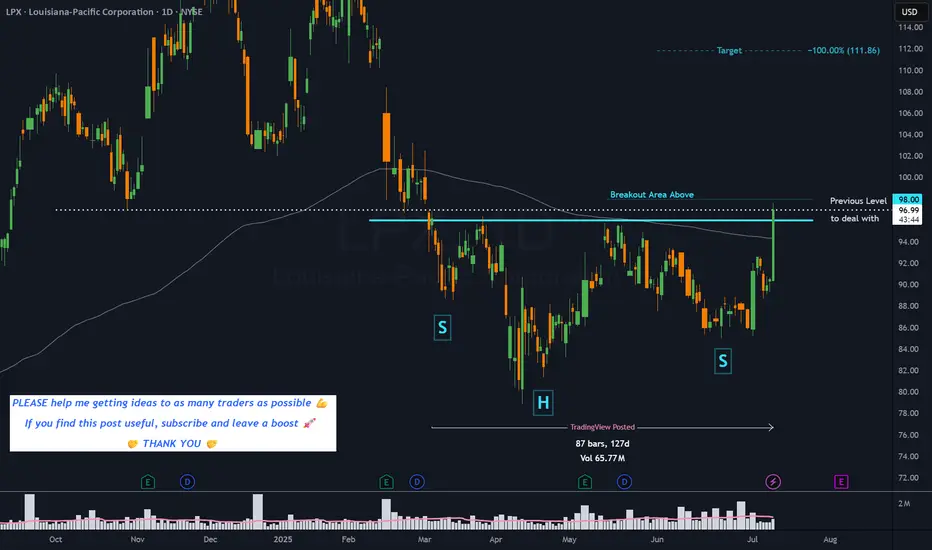
LPX - 4 months HEAD & SHOULDERS══════════════════════════════
Since 2014, my markets approach is to spot
trading opportunities based solely on the
development of
CLASSICAL CHART PATTERNS
🤝Let’s learn and grow together 🤝
══════════════════════════════
Hello Traders ✌
After a careful consideration I came to the conclusion that:
- it is crucial to be quick in alerting you with all the opportunities I spot and often I don't post a good pattern because I don't have the opportunity to write down a proper didactical comment;
- since my parameters to identify a Classical Pattern and its scenario are very well defined, many of my comments were and would be redundant;
- the information that I think is important is very simple and can easily be understood just by looking at charts;
For these reasons and hoping to give you a better help, I decided to write comments only when something very specific or interesting shows up, otherwise all the information is shown on the chart.
Thank you all for your support
🔎🔎🔎 ALWAYS REMEMBER
"A pattern IS NOT a Pattern until the breakout is completed. Before that moment it is just a bunch of colorful candlesticks on a chart of your watchlist"
═════════════════════════════
⚠ DISCLAIMER ⚠
Breakout Area, Target, Levels, each line drawn on this chart and any other content represent just The Art Of Charting’s personal opinion and it is posted purely for educational purposes. Therefore it must not be taken as a direct or indirect investing recommendations or advices. Entry Point, Initial Stop Loss and Targets depend on your personal and unique Trading Plan Tactics and Money Management rules, Any action taken upon these information is at your own risk.
═════════════════════════════
CHAINLINK (LINKUSD): Very Bullish Outlook
I see 2 strong bullish confirmations on LinkUSD on a daily time frame.
The price violated 2 significant structures: a vertical falling resistance - a trend line
and a neckline of an inverted head & shoulders pattern.
With a high probability, the market will rise more.
Next resistance - 15.38
❤️Please, support my work with like, thank you!❤️

NATURAL GAS formed Head and Shoulders patternCAPITALCOM:NATURALGAS
🔍 From a longer-term perspective, I noticed that a Head and Shoulders pattern 🪖🩻 is about to form. This pattern has been forming since December 2024 and in the long term 🕰️ means no good for those who play long here 📉.
🙋♂️ Personally, I will stay aside for now and observe 👀. The asset may head towards the 3.0000 support level 🪙, where I expect a potential rebound 🔄, possibly even a retest of the trendline from below ↩️.
⏳ In the long term, the asset may even move towards the 2.0000 support level 🚨, but I will need more observation and data to be sure 🧪.
🕊️ Time will show. Thank you for the attention! 🙏

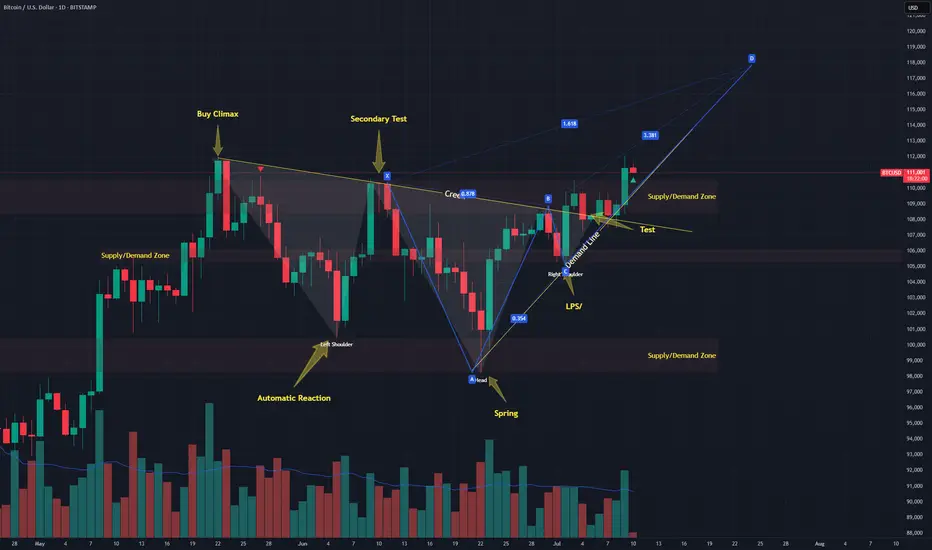
Bitcoin forming a possible deep crabLast week I published a thesis that #Bitcoin might be in a #Wyckoff re-accumulation pattern and we had an ugly ass inverse head and shoulders forming as a part of it.
Well know that test on the creek formed a BC leg of a possible Deep crab. 1.618 is ~117k. Lots of confluence
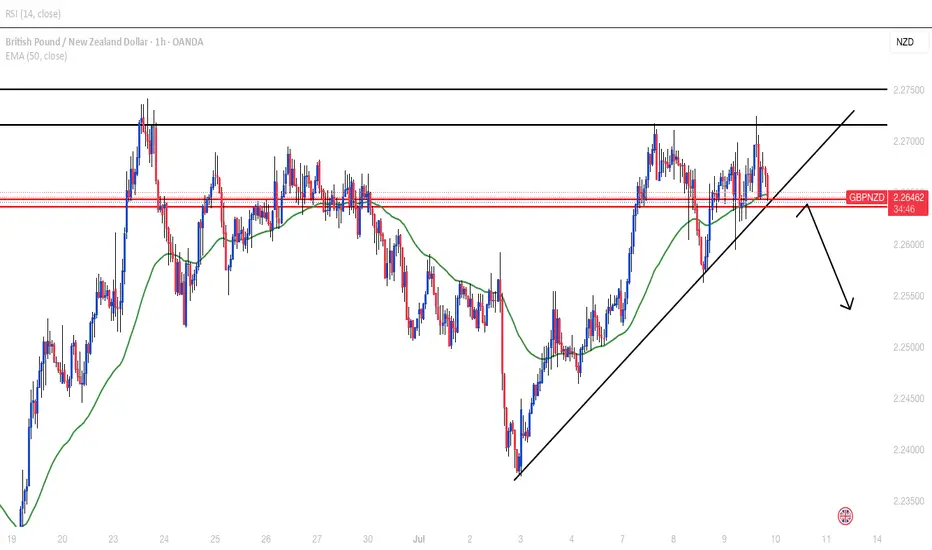
GBPNZD RANGEDaily and H4 range. Price at resistance zone with possible H4 double top forming. Clear head and shoulder on M15. waiting for break below neckline to look for selling signals.
TOM LEE leading the charge in this new BULL MarketThank you for providing excellent analysis,
being on the right side of the trade
and helping retail with your public speaking on your own channel, podcasts, and of course CNBC.
I wish you continued success in you Granny shots ETF which is already over $1.5 Billion in AUM!

XRP breaks out: 19% rally in sightXRP has just broken out of an inverse head and shoulders pattern, a classic bullish setup that points to a potential 19% rally. The breakout comes at a time when the US is expected to deliver key crypto regulation updates by July 22. If the legal outcome is positive, it could fuel further upside not only in XRP but across the broader crypto market. This setup offers a strong risk-to-reward profile, especially if Bitcoin also breaks out of its current rectangle pattern.
This content is not directed to residents of the EU or UK. Any opinions, news, research, analyses, prices or other information contained on this website is provided as general market commentary and does not constitute investment advice. ThinkMarkets will not accept liability for any loss or damage including, without limitation, to any loss of profit which may arise directly or indirectly from use of or reliance on such information.

AUDJPY 1D: breakout toward 100–105AUDJPY has confirmed an inverse head and shoulders breakout on the daily chart, with a strong move above the neckline. All key moving averages, including MA50 and MA200, remain below the current price — confirming bullish momentum. Volume increased on the breakout, and price has held above the 95.6 neckline zone. As long as that level holds, the setup remains valid. Targets are set at 100.36 (1.618 Fibo) and 105.19 (2.0 Fibo).

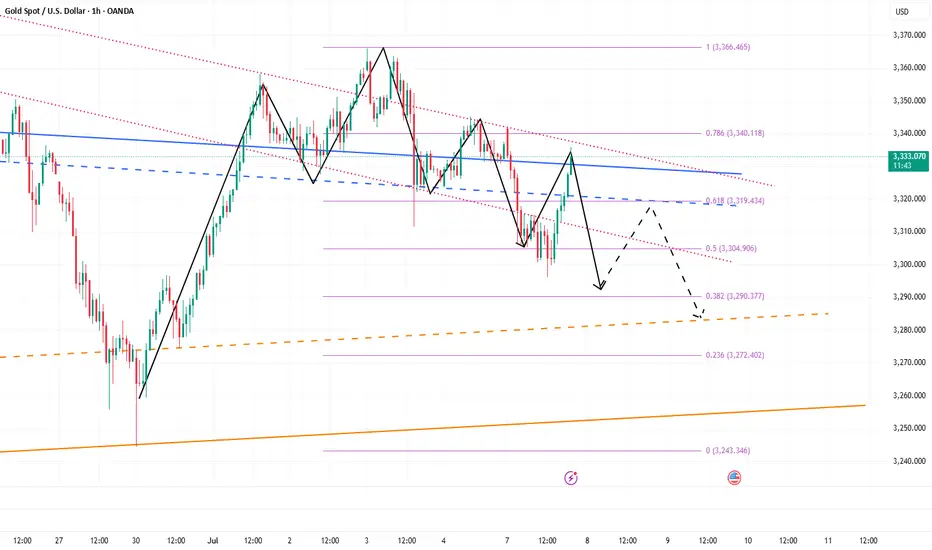
7/8: Inverse Head and Shoulders Pattern, Support at 3321–3312Good morning, everyone!
Yesterday, gold broke below the 3321 support during the session, dropped to around 3296, then staged a strong rebound back toward the opening price—forming a classic deep V-shaped reversal and regaining support above the MA60 on the daily chart.
The market remains in a consolidation phase between the MA20 and MA60 on the 1D chart, with no clear directional breakout yet.
On the 30-minute chart, the previous head-and-shoulders top pattern has been completed with the recent decline. The current structure can be tentatively viewed as the formation of a head-and-shoulders bottom.
If this bullish reversal pattern holds:
The 3321 level must act as valid support during any pullback; deeper confirmation may come from 3312, which corresponds to the previous left shoulder low. Although this was partially driven by a data-related spike, most candle bodies remained around 3321—so 3321 is the primary support, and 3312 is the backup.
If confirmed, the price may advance toward the 3360 target zone.
If the pattern fails, watch for the development of a double bottom formation, with MA60 on the daily chart remaining a key support level.
📌 For today, focus on trading within the 3312–3352 range, using a buy-low/sell-high approach, and stay flexible in response to evolving chart patterns.

BTC , 4hr , BearishBTC is Forming a Pattern and it is at the top of the Another Pattern and It is facing rejection 3 Times from Above and now it is forming another pattern inside and Ready for Break Down of the Pattern , if it breaks the Pattern Down then it will be bearish almost 90% it will move to down side , if it has not given Breakdown and moving inside the small pattern then wait patiently and observe carefully .
Then it may also give Breakout for up side .
Follow Risk Management Properly
Follow for More Swing Ideas Like this .

Inverse Head and Shoulders Already Completed Toward a New ATHThe price has completed the formation of an inverse head and shoulders pattern, with the final breakout occurring last week.
Volume confirms the validity of the pattern.
The distance from the head to the neckline projects a target toward a new all-time high (ATH).
As often happens after a breakout, a retest of the neckline may occur, which could present a good entry or accumulation opportunity

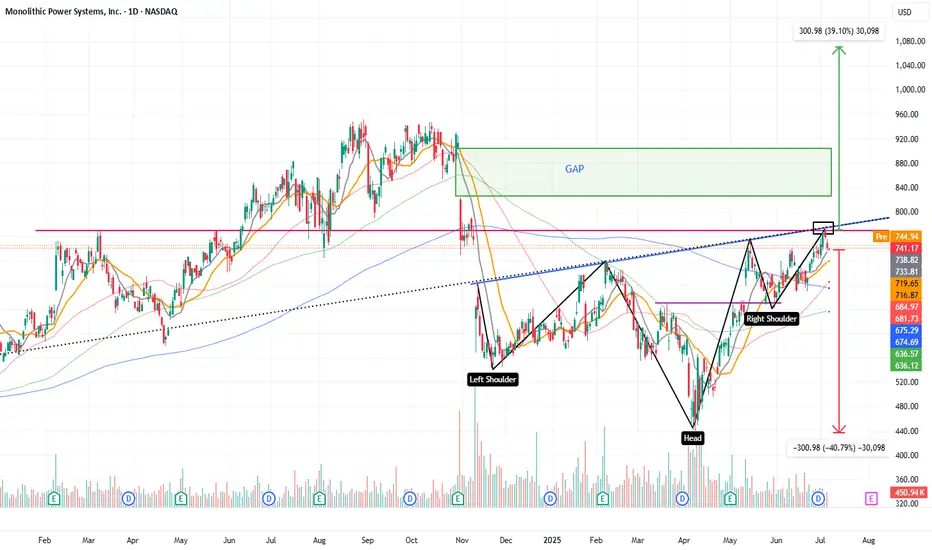
Inverse head and shoulders with a gap to close towards 1070$The price is completing the formation of an inverse head and shoulders pattern, with a head-to-neckline distance of approximately $300.
This suggests a potential breakout target around $1070.
Along the way, there is also a significant gap that has remained unfilled for several months.
The stock belongs to a company that manufactures power management chips used in all types of electronic devices, with steadily growing revenue
XAUUSD (LONG)
Inverse head and shoulders
Restest of tredline(previous was resistance now support)
Eliiots wave count (ABC done,1-5 in progress)

GBPCAD: Classic Pullback Trade for TodayThe GBPCAD pair formed a head and shoulders pattern at a crucial daily/intraday horizontal support level.
The recent breach of its neckline indicates a notable strength of buyers, suggesting a bullish momentum.
Given this technical setup, I anticipate that the pair could rally and potentially reach the 1.8650 level in the near term.

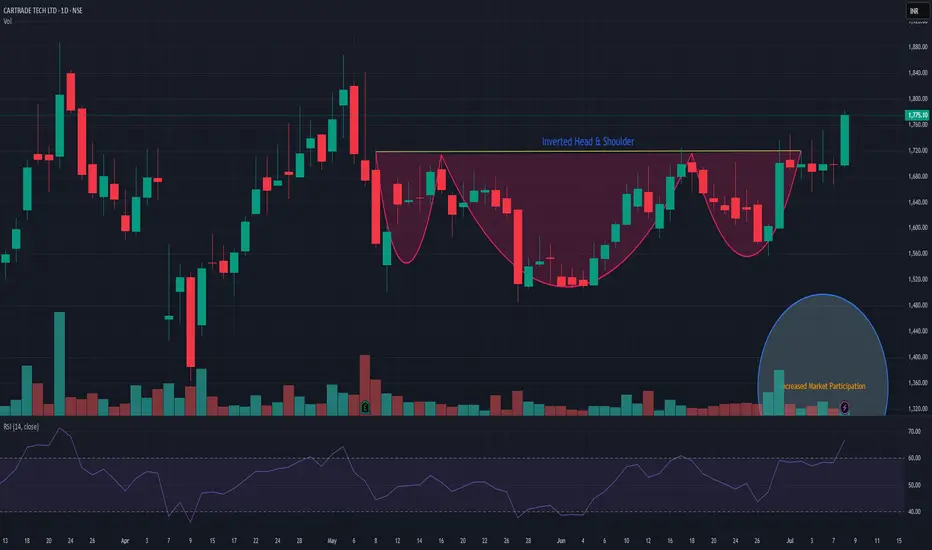
CARTRADECARTRADe is showing strength and has given Inverted head & Shoulder breakout with decent market participation. support is near 1620. It has a potential to go up! Keep it on radar. Closing below 1620 may change my view.
The short position is losing money. What should we do?Gold hit the intraday low of around 3296 and then began to rebound. We can see that the rebound of gold is not strong, but it is relatively sustained, so gold has rebounded to around 3335. To be honest, I did short gold according to my plan and still hold a short position.
Although gold has rebounded to around 3330, I don’t think my short gold trade has failed. As I said in the previous point of view, gold is facing technical suppression of the head and shoulders in the short term, which will suppress the rebound limit within the 3335-3340 area. So before gold stabilizes at 3340, I think the gold shorts still have the upper hand. So as long as gold stays below 3340, I think the gold rebound is a good opportunity to short gold.
At present, gold is facing the resistance area of 3335-3340 and begins to show signs of stagflation. After consuming a certain amount of bullish momentum, the gold shorts may counterattack strongly again and stimulate gold to fall rapidly. Therefore, before gold breaks upward through the 3335-3345 area, we can still consider shorting gold, or continue to hold a short position in gold!