HTF Bullflag, LTF H&SHowdy - Quick idea here for potential short term and long term setups.
We are in a weekly uptrend and recently saw our first signs of weakness by a double top and neckline retest. The next moves will decide whether we continue our bullish performance or continue to see struggle from buyers at this level.
Bullish Bias: On the weekly, we broke out of a strong bull trend line and approached our swing low. We had a strong bounce (indicating strong support and additional liquidity). We are seeing a potential bull-flag and approaching the top of that down-trend line. Even if we don't break out on this attempt, this is still a longer-term possibility. If we break out of resistance line with force, we can see price continue up to retest the 2.000 psychological level.
Bearish Bias: On the MTF (2HR), if we reject the upper trend line, we can see a drop toward 1.7500 liquidity or at minimum a neckline retest. This is where we might see our H&S play out to propel us toward that demand zone.
Headandshouldersformation

EURAUD I Potential upside Hello,Traders!
.
.
.
.
.
EURAUD is trading in an uptrend on the weekly and a downtrend
on the daily. 1.6640 structure daily high was recently broken and created a
new high at 1.6703. The price has pulled back to the neckline area and
showing rejection from 1.6557 support. If this support holds, price will likely
continue to the upside to retest 1.6700 zone. LONG!
Trade safe and good luck!
Like, comment and subscribe to help us grow!
Check out other forecasts below too!

Head & Shoulders Bottom in Dow Jones Futures?Dow Jones index futures has completed head & shoulders bottom formation and is exhibiting a breakout from the resistance zone on the 4h time frame. If the breakout is successful, we can expect the price to hit the previous support/resistance zone of 34800.

SQ-Potential Scenarios to Watch for Over The Next...Head and shoulders pattern identified on the weekly chart.
I will be watching for a break or retest of the 52 week low or a break and hold above 47.50.
A break below the 52 week low would confirm that market participants want to take the stock lower. However, a break and hold above 47.50 would confirm that participants are interested in taking the market higher.
On a lower time frame (specifically the 4H chart), data shows price broke below the .618 fibonacci retracement level and retested (see image below). The stock could potentially move lower being that it retested the .
Furthermore, price rejected the same level three times on the 1H timeframe.
Something else that should be pointed out here is the daily chart shows an increase of sellers over the last three trading sessions.
*Side note -Interestingly, SQ is in the price area it was at the beginning of COVID-19. A break below the 52 week low may cause price to retest the low from April 2020. Should price reach the low from April 2020, we should watch to see if price finds support or breaks down further.

Bullish reversed Head & Shoulders on VIXThe VIX seems to have validated a bullish pattern, the reversed Head & Shoulders with a target around 27 and intermediate resistance with the line linking the tops near 24.
Only a break below the shoulders level around 15 would invalidate this view.

🔥 FTM Head & Shoulders: Peaking Into The AbyssFTM has been one of my favorite tokens during the bull-run, but has lost nearly all of its value over the last two years. In its current state, it's one of the weakest big alts.
In my eyes, there's potential for more bearish price action in the future. I think that FTM can fall as far as 0.03 USD. Consequently, this would be my ideal area to step in for a long-term position.
I'm waiting until the price closes below the neck-line of the pattern before making an entry.

H&S and Dark Cloud Cover indicate short term bearish reversal?Heidelbergcement's future not looking good amid a raising interest rates environment for real estate promoters.
Technical analysis: Bearish
A Head and Shoulders pattern could be underway since Sep 2022 and once the stock has reached a double ceiling level at 77.50€. Besides, a Dark Cloud cover was formed on Friday 29th of September in the right shoulder and today's candle seems to be confirming the candlestick pattern prophecy, which would lead us to first support level ranging from 68.5-70.5€.
Beyond analysis and POV: Bearish and Bullish
The fact that Vonovia has frozen 60.000 apartments that were supposed to be built now also indicates a reduction of materials' demand to build houses and perhaps other real estate promoters have come up with the same decision. This means, less materials needed for now which could potentially affect Heidelbergcement's profits in the near future. However, the ISM Manufacturing PMI came better than expected for September (actual 49, exp. 47.7 prev. 47.6). This means, any short-term bearish reversal could not last long.
Fundamental analysis: All bullish considerations
The debt level is considered satisfactory with a net debt to equity ratio of 32.8%. Earnings Payout to Shareholders is 26%. P/E ratio = 7.5 while industry average is 9.1.

$US500 SP500 forecast.Here's what I'm looking at.
I still think $4100 is on the table for a bottom. Reason being, there's multiple levels of confluence there.
1) If you take the AVWAP from the Jan 2022 highs, it comes to around $4100
2) It's a horizontal level
3) It's roughly the measured objective of the Head and Shoulders break down
4) It's also coming in around the 0.618 fib level.
Of course there will be levels of support along the way, one being the current $4260 area.
This $4260 area is also a confluence of support with
1) It's a horizontal level on the weekly
2) The 200EMA on the Daily chart
3) The AVWAP from the recent March 2023 lows.
Either we see a bounce and recovery from here ($4260 area) or if we break lower we'll see 4100.
For now, I still think $4100 may be the low for this correction.

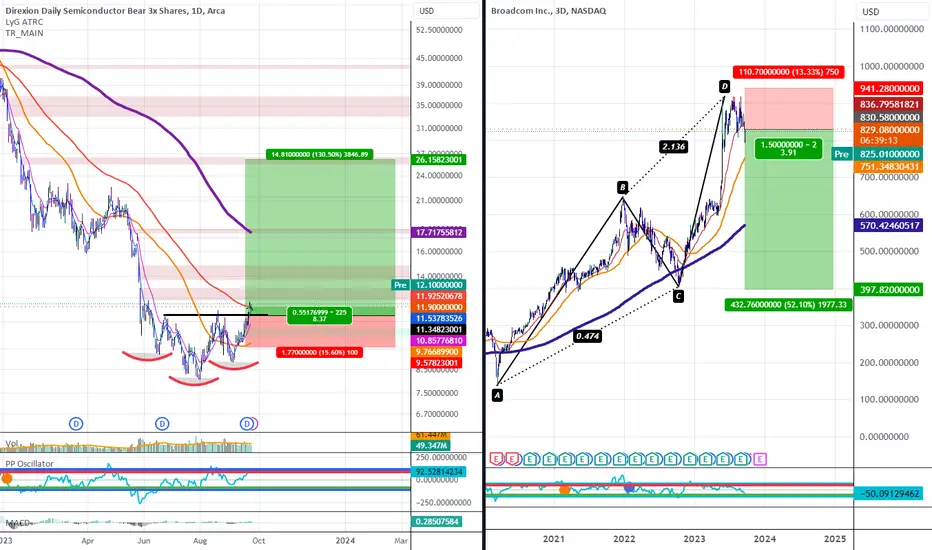
AVGO and SOXS Preparing to Move BigSOXS the 3x Inverse ETF for Semiconductors, has broken out of a Bullish Head and Shoulders and now sits at the 89EMA. If things go as expected, SOXS should be clear to at least give us a 60-150% rally. At the same time, we also have a Bearish AB=CD on AVGO and what looks to simply be filling of a gap it made at $830 after breaking below its own slanted Bearish Head and Shoulders neckline as seen here:
If things go as I expect them to, we will see AVGO open the week to aggressive downside with minimum overall targets as deep as 50% below current prices.
How to Head and ShouldersGreetings, Financial Enthusiasts! 🌟 If you appreciate our charts, give us a quick 💜💜
The Head and Shoulders pattern is a well-known chart formation in technical analysis. It indicates a reversal from a bullish to a bearish trend, usually at the end of an upward trend.
Key Points:
- Head and Shoulders: Chart pattern signaling trend reversal.
- Formation: Three peaks on a baseline - two lower outer peaks and a higher middle peak.
- Bullish to Bearish: Suggests a shift from an upward trend to a downward one.
- Applicability: Seen on all timeframes, suitable for various traders and investors.
- Entry Levels: Easily identifiable, aiding in trade implementation.
Why It Matters:
The Head and Shoulders pattern provides traders with a visual representation of a trend reversal. It's widely used due to its simplicity and applicability across different timeframes.
The Pattern:
- Formation (Market Tops):
1. Left Shoulder: Price rises, forms a peak, then falls.
2. Head: Price rises again, forming a higher peak.
3. Right Shoulder: Price falls again, then rises but forms a lower peak than the head.
- Formation (Market Bottoms):
1. Left Shoulder: Price falls, forms a trough, then rises.
2. Head: Price falls again, forming a lower trough.
3. Right Shoulder: Price rises again, then falls, forming a higher trough than the head.
Neckline:
- For Market Tops: Connect the low after the left shoulder to the low following the head to create the neckline.
- For Market Bottoms: Connect the high after the left shoulder to the high after the head to form the neckline.
Trading the Pattern:
- Wait for the pattern to complete before trading.
- Entry when price breaks below the neckline (tops) or above it (bottoms).
- Stops placed above the right shoulder (tops) or below it (bottoms).
- Profit targets calculated based on the head-to-shoulder difference and added (bottoms) or subtracted (tops) from the breakout level.
Why It Works:
- Sellers enter as price falls from its peak, reducing aggressive buying.
- The neckline marks a point where traders exit positions, driving price toward the target.
- A lower right shoulder (tops) or higher right shoulder (bottoms) signals a trend shift.
- Profit target assumes forced exits by those in losing positions.
- The neckline prompts many traders to exit, pushing price towards the target.
- Volume analysis helps confirm patterns; expanding volume (bottoms) shows increased buying interest.
Pitfalls:
- Waiting for pattern completion may require patience.
- Not all patterns lead to successful trades.
- Profit targets aren't always reached.
- External events can disrupt patterns.
- Patterns can be subjective; traders should define their criteria.
The Head and Shoulders pattern, though not foolproof, provides a structured approach to identify and act on trend reversals.

GBP/USD - Clear Head and Shoulder Long or Short term playTime Frame:
- Weekly & Daily for analysis
- 4 Hour for execution
Trend: Currently in a LTF uptrend within a HTF pullback
- Weekly = Down
- Daily = Up
This one is fairly simple and straight forward but what makes it such a good opportunity is its’ potential of being the reversal pattern in a massive trend reversal.
As I mentioned in more detail in my last post, we have extremely strong Points of Interest (POI) below that will be acting as demand once price reaches them. We’ve been in a strong uptrend (pullback of a higher time frame downtrend) and this blue trend line has acted as strong support, 3 times now, directing the pullback rally.
Important: Each of these points of support are also holding massive amounts of liquidity that buyers and sellers both want to take advantage of. Meaning, both sides would have a field day an opportunity to take control and make large moves if we reached these levels (likely sellers would be more in control as they would be continuing the overall HTF trend). Because of this it is extremely important to take profits as you cannot be sure which demand zone could hold a reaction.
If this H&S on the 4 hr/daily chart can bring us out of this trend line, there is a ton of liquidity for a larger H&S to form (meaning this H&S I highlighted would be just the head of this larger H&S). In that case, there is a ton of liquidity on the already built left shoulder to take us down to mitigate the demand below.
Trade Plan:
Stop Loss: Above neckline (for shorter term play), above right shoulder (for longer term play)
Take Profit 1: Closest unmitigated demand zone below = 2.06 R:R
Take Profit 2 & 3: Lower demand zones – only with larger H&S formation = 6.5+ R:R
Thank everyone who views this and takes any benefit from it. I am on a journey to becoming the best 4X trader I can become and love to bring my fellow traders along for the ride. As always, feel free to like, comment, and message with any questions, comments, feedback, concerns, or GOOD VIBES!
Happy Trading!
FourXTrader

AAPL in a box/H&S patternApple has been trading in a box and now a Head and Shoulders pattern has developed. To avoid further downfall, we need to close about 180. If we close below 174, the bearish Head and Shoulders pattern will be complete and we will trade lower.
+180 go long
Sub 174 go short

HPQ: Bearish Head and Shoulders, Diamond, Dragon, and BAMM ComboHewlett-Packard, after making five macro waves up, has formed a Bearish Structure that can only be described as being a hybrid between a Diamond and a Head and Shoulders pattern, and along with that, it is also a combination of a Bearish Dragon and Bearish BAMM.
All of this is happening after HPQ faced rejection off of the PCZ of a Bearish Crab going into its 5th wave.
Here is a screenshot of the zoomed out chart that showed the biggest macro wave structure that is on the chart and where all of this is happening:

GBPUSD 13 Sep 2023 Outlook. Today, GBP is bearish due to it's news perform L.H and LL last few days.
We should wait for a good entry point after the market is exhausted. Another important factor to consider is the CPI for USD, which will also impact the market.
Next Liq Zone. 1.23952
Price create this level as support 05 to 07 June.
Price test this support to move further upside.
Price Formed H & S.
Find short Setup in coming Days.
Target is. 1.23952

🔥 Bitcoin Head & Shoulders Forming? Patience For BearsAfter bouncing off the bottom support, Bitcoin seems to have regained short-term bullish momentum. In this analysis I want to discuss the potential H&S pattern that BTC is forming in the near term. My longer-term view is still bearish, but that doesn't mean we can't get a bounce here and there.
In my eyes, there is a potential for BTC to move further up. The odds are against the bulls at this point, but there's still a chance that this pattern will play out.
The 30k-31k area is going to be key. Not only because of the number, but also because it's the April'23 high. Would be a perfect bearish entry.
Do you think this pattern will play out? Share your thoughts in the comments 🙏

How to trade head and shoulder pattern? As a forex trader, it's essential to have a robust arsenal of technical analysis tools at your disposal. One of the most powerful and reliable chart patterns you can use is the "Head and Shoulders" pattern. This pattern is prized for its ability to signal potential trend reversals, allowing traders to make informed decisions and capitalize on market opportunities. In this comprehensive guide, we'll delve deep into the Head and Shoulders pattern, breaking down its components, identifying its variations, and learning how to trade it effectively.
Understanding the Head and Shoulders Pattern
The Head and Shoulders pattern is a classic reversal pattern that forms after an extended uptrend, signaling a potential change in market direction from bullish to bearish. It consists of three peaks, with the middle peak (the "head") being higher than the other two peaks (the "shoulders"). The pattern typically unfolds as follows:
1. The Left Shoulder
- The left shoulder represents the first peak after a strong uptrend.
- This peak is typically followed by a minor retracement, creating the first trough.
2. The Head
- The head forms after a brief rally from the left shoulder's low point.
- It represents the highest peak in the pattern and usually exceeds the previous peak.
- After reaching this peak, the price retraces again, forming the second trough.
3. The Right Shoulder
- The right shoulder is the third and final peak in the pattern.
- Like the left shoulder, it is lower than the head and forms after a minor rally.
- The right shoulder's high is followed by a retracement, creating the third trough.
Key Characteristics of the Head and Shoulders Pattern
To effectively identify and trade the Head and Shoulders pattern, it's crucial to understand its key characteristics:
1. Symmetry
- The left and right shoulders should be roughly symmetrical in terms of height and width.
- The head should be the highest point in the pattern.
2. Volume
- Volume plays a vital role in confirming the pattern.
- Volume should generally decline as the pattern forms and then increase as the price breaks below the neckline (more on this later).
3. Neckline
- The neckline is a trendline drawn horizontally connecting the low points of the left and right troughs (the shoulders).
- The neckline serves as a critical level of support. A breach of this level confirms the pattern.
Trading the Head and Shoulders Pattern
Trading the Head and Shoulders pattern involves two main steps: identification and execution.
Identification:
1. potting the Pattern: Begin by identifying a well-defined Head and Shoulders pattern on your forex chart.
2. Volume Confirmation: Ensure that volume decreases as the pattern forms and increases upon breaking the neckline.
3. Neckline: Draw a neckline connecting the lows of the left and right shoulders.
Execution:
1. Entry Point: Place a short trade when the price breaks below the neckline. This serves as a signal that the pattern has confirmed.
2. Stop-Loss and Take-Profit: Set a stop-loss order above the right shoulder and a take-profit order based on your risk-reward ratio.
3. Risk Management: Be mindful of risk management, and never risk more than you can afford to lose on a single trade.
Variations of the Head and Shoulders Pattern
While the classic Head and Shoulders pattern is powerful, variations can offer additional insights:
Inverse Head and Shoulders:
- An inverse Head and Shoulders pattern signals a potential bullish reversal.
- It comprises three troughs with the head being lower than the shoulders.
- The pattern is confirmed when the price breaks above the neckline.
Complex Head and Shoulders:
- Complex variations may have multiple heads or shoulders, making them harder to spot.
- Despite their complexity, they follow the same principles of confirmation through neckline breaches.
Conclusion
The Head and Shoulders pattern is a valuable tool in the forex trader's toolkit. By mastering its identification and execution, you can gain a competitive edge in the market. Remember that no pattern is foolproof, and risk management remains paramount in forex trading. As with any technical analysis tool, it's essential to combine the Head and Shoulders pattern with other indicators and analysis methods for a well-rounded trading strategy. So, start practicing, keep refining your skills, and always stay informed about the latest market developments to become a successful forex trader.

Confirmation & Time to enter for reversal! (Update to last post)Time Frame:
- 4HR analysis
- 15min Confirmation for Entry
As mentioned in my previous post titled “Clear Head and Shoulders Long or Short term play”, we were waiting for an entry signal into our H&S trade. This signal could come in many ways but in my strategy, once a larger time frame (2Hr-1day) supply zone is hit, I then turn to the lower time frame and wait for a bearish signal (typically a CHoCH (major or minor)) and thereafter identify the LTF supply zone that caused that CHoCH. Reaching that supply zone is our signal to enter and we therefore have a tight and calculated stop loss with a stronger R:R.
We have now broken previous structure and are considered in a LTF downtrend (with a lower high and lower low) and can begin our descent toward breaking through the H&S neckline and the important trend line that is holding us up.
My trade plan is as follows:
Stop Loss – Above LTF Supply zone (higher R:R), Above right shoulder/previous higher high (lower R:R)
Take Profit 1 – Neckline of H&S = 8.32 R:R
Take Profit 2 – Trendline bounce/break = 12.5 R:R (or 6.6 with higher stop loss)

Setup for Head and shoulders pattern on the Daily. #BearishWe have a retest of the left shoulder. Using Fibonacci to get a targeted entry for the sell. Will scalp lower timeframes 5-15M. Looking for price to reenter the .618 level before looking for sells.
This is more of a long-term play. Be caution here.
The purpose of these posts are for educational purposes only. Nothing associated with this profile or post should be taken as advice to buy/sell any specific financial market. I nor anyone associated with this profile will accept any liability for any financial losses related to any content posted here. Trading is risky, so seek professional trading advice before taking any specific trades/investments.

🔥 XMR Bullish Head & Shoulders: Watch This Pattern! 🚨XMR appears to have formed a clear inverse head & shoulders pattern, which is the direct opposite of a normal H&S pattern. Classically, this pattern appears at important areas of trend-reversal.
I'm going to wait for the neckline to break. Once the price has closed above the neckline, it will be my entry signal. Stop below the right shoulder, target at the 2023 highs.
Note: I'm not counting the August 17th wick because it was a stop-loss cascade wick.

SHCOMP ~ Snapshot TA / Bearish H&S Development (TBC) / WeeklyChina's Economy is dangerously on the ropes...things have gotten so bad, CCP had to make an announcement on a Sunday night (AEST/UC+10) that they're going to intervene in their domestic market with a raft of "measures" in hopes of boosting market confidence:
- Halve stamp duty on stock trading
- Tighten pace of IPO listings
- Cut margin financing requirements
- Restrict listed companies' refinancing
- Restrict share reductions by major shareholders
My gut instinct tells me this will be a financial disaster...luckily we've got charts to tell us what's really going on.
Taking a (Snapshot TA) look, SSE:000001 appears to be developing a Bearish H&S. Extrapolating Head-to-Neckline indicates price could be heading towards a pretty interesting Confluence Zone :
- Gap fill (weekly)
- Retrace to previous 2014 break-out (aka Return to Scene of Crime)
- Key demand/support zone
- Multi-decade trend line
Note: While chart patterns (ie H&S) are great at spotting trends, etc. it's important to focus on associated demand/supply zones & how price interacts with key levels to determine when & where to scale in/out of positions.
All (technical) signs point to SHCOMP in process of capitulating...problem with Govt interventions is it becomes a momentum play in either direction & technicals take a back seat.
We'll just have to take note of critical levels, set alerts & wait for the dust to settle..
Boost/Follow appreciated, cheers :)
CFD/INDEX: PEPPERSTONE:CN50 PEPPERSTONE:HK50
US: NASDAQ:AIA AMEX:FXI AMEX:EEM AMEX:CQQQ AMEX:KWEB
ASX: ASX:IAA ASX:IZZ ASX:IEM ASX:CNEW ASX:ASIA

Expecting a shift to the down side | GBPUSDGBPUSD have been ascending to the upside in 4H time frame taking the resent high as liquidity in to the supply zone (sell zone), regretless, the supply zone still holds since the daily time frame is bearish i am expecting a shift to the down side to take out the recent low at 1.27037 or the next at 1.26866 my expected target is 1.26624

Netflix. Time to Chill.Today, Netflix's (NFLX) price plunged below the Head & Shoulders neckline, with a pronounced downward move. This breach substantially elevates the likelihood of an extended bearish phase, potentially materializing as a significant sell-off leading into the forthcoming fall season.
Projections indicate a retracement towards the 0.5 Fib Extension level, where the price could test support at the mean price of $323.86.
This mean price represents the average of the comprehensive bull run, which initiated from the May 2022 low of $162.73 and culminated at a peak of $485, the recent July 2023 top. However, the price could find support at the bottom parallel of the uptrend channel around $370 first before reaching the mean average price target.
The RSI has plenty of downside room heading into the next several weeks heading into oversold territory.
Moreover, the recent FOMC minutes revealed the Fed's continued hawkish view on inflation and the possibility of further rate hikes.
We can also expect more fiscal tightening and an inflation resurgence to fuel the coming downtrends across most of the equities markets, especially big tech and crypto. This is particularly noteworthy as the economy could begin to contract due to overly tightened fiscal conditions, along with the looming threat of another Government shutdown in October. Additionally, credit usage, debt levels, and debt interest amounts are all increasing at a faster pace as we progress under these economic conditions.

Netflix. Time to Chill.Today, Netflix's (NFLX) price plunged below the Head & Shoulders neckline, with a pronounced downward move. This breach substantially elevates the likelihood of an extended bearish phase, potentially materializing as a significant sell-off leading into the forthcoming fall season.
Projections indicate a retracement towards the 0.5 Fib Extension level, where the price could test support at the mean price of $323.87. This mean price represents the average of the comprehensive bull run, which initiated from the May 2022 low of $162.73 and culminated at a peak of $485, the recent July 2023 top. However, the price could find support at the bottom parallel of the uptrend channel around $370 first before reaching the mean average price target.
Moreover, the recent FOMC minutes revealed the Fed's continued hawkish view on inflation and the possibility of further rate hikes.
We can also expect more fiscal tightening and an inflation resurgence to fuel the coming downtrends across most of the equities markets, especially big tech and crypto. This is particularly noteworthy as the economy could begin to contract due to overly tightened fiscal conditions, along with the looming threat of another Government shutdown in October. Additionally, credit usage, debt levels, and debt interest amounts are all increasing at a faster pace as we progress under these economic conditions.
