BTC head and shoulderBTC is making a HnS and pointing to a support on our fib map if breakdown we can see 17k to 16.4k easy.
Keep watch and enjoy the profit.
Headandshouldersformation

EUR/JPY - potential head and shoulders Hello traders. This is EUR/JPY, 1hr tf. As you can see we have a potential head and shoulders pattern. We still don’t have the right shoulder, and we may not get it, but in case we do, we need to be prepared because all of this can give a very strong signal to the bulls. If you look at the daily chart, you can see the bullish engulfing pattern and this can be used as a daily confirmation of the trade. Keep in mind that this pair is bullish at all higher time frames, so the recent bearish mood (three red candles) can only be considered as a retracement, which is totally normal for markets. Of course, anything can happen, so trade safe.

Cloud Worries!Reversal pattern in reverse head and shoulders. If price can overcome the cloud resistance we It can go all the way to 1.4000.

POUND - JAPANESE YEN SHORT [GBPJPY]We can see a formation of a head and shoulder pattern which could lead to selling momentum. If the setup fails, we will look out for what price does on the next sone of resistance where we might likely see a double top fromation.

EURGBP: Head & Shoulders Trap 🚨Don't trade the head and shoulders pattern the retail way, trade it the smart money way.
⠀
If price is approaching the neckline to breakout, don't join with the retail sellers, wait for manipulation to join at the appropriate order block or imbalance.
⠀
When price finally breaks out and trappers huge amounts of sellers, look to the left to identify an area of demand to buy from.
⠀
If you locate the correct demand, you can buy into seller stop losses and profit both ways.
⠀
This is a great example of manipulation 👁
I will be joining buyers at the next demand.

BTC has to go further Down 👇👎 Told you in advanceBTC has to Fall Down Further More to the Pointed Position Up Above in the Picture/Chart.
Bitcoin has lost its power.
Told you all so far in the past.
Danyal Hassan Hashmi, Trading Analyst.

BTCUSDT Head and Shoulders weekly ChartI can't say much about it since I'm neither a professional nor otherwise know much about the analysis of charts - I make my graphics rather intuitively.
The head and shoulders course of my chart seems to me to be quite appropriate for these times and I post just for my own practice purposes.
If you want to write something about it, you are very welcome to do so ;) Happy trading

TOTAL 3 TARGET 1 METTarget 2 is about to play out, called this months ago.
Hope this shows you the influencers are mugging you off when they are teaching you how to trade :)
Market Psychology is the most important thing, emotional intelligence.
@mohanee for the great scripts :-)

BEARS vs BULLS Before, I brought up the head and shoulder on the RSI for the 1D candles. Today it’s at 65.05 on the RSI. With super bullish being considered 65+ and the head of the rsi is at 85. There’s still room for it to run before the head and shoulder is out of the picture. There is a lot of hype about the short interest that still could drive in more buyers. With more upside is still in the picture, if the head and shoulder pattern is and option on the RSI, it could head down to 20-30.

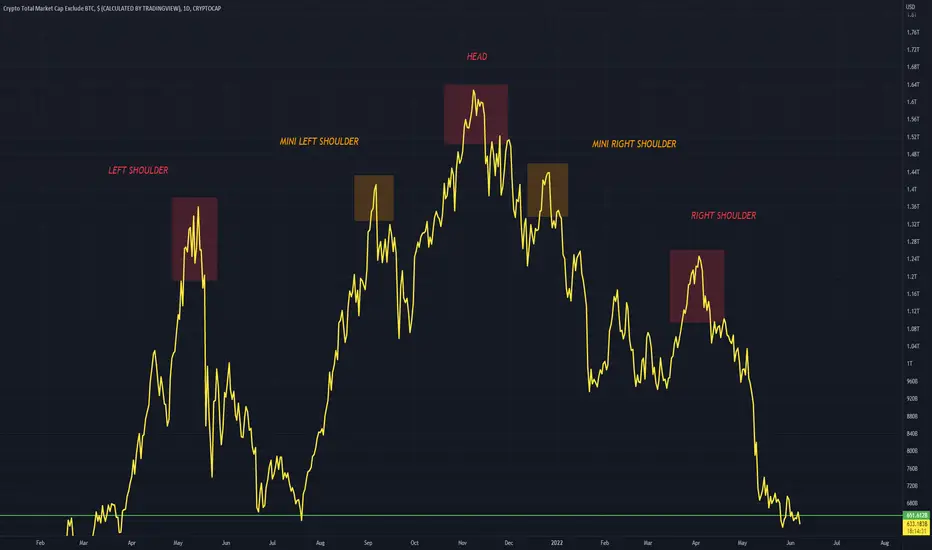
TOTAL2 Completed H&S PatternThe altcoin market (TOTAL2) has completed a H&S pattern
While also including simultaneously a mini left shoulder and a mini right shoulder
A visually appealing pattern to view
EURJPY - Swing Sells ⬇️Price aggressively pushed away from the key round psychological number of 140 and created a head and shoulders formation.
The majority of traders who missed the breakout will have attempted a sell at the EQH's - they have now been liquidated.
The only liquidity that remains is the sellers with stops above the right shoulder.
I am observing price action around this area, depending on the daily close I may initiate a swing sell.
Hopefully, you enjoyed this analysis, give it a thumbs up 🧠

Pidilite.pidilite made an bearish head n shoulder on an hourly charts & negates it by holding neckline of 2194 & breaks above right shoulder, so that makes pidilite a good buy.
Could b bought with mentioned stoploss & targets

NFLX:If it looks like a bottom. . . ?!!Netflix
Short Term - We look to Buy a break of 210.00 (stop at 158.96)
The bullish engulfing candle on the daily chart is positive for sentiment. A bullish reverse Head and Shoulders is forming. This is positive for sentiment and the uptrend has potential to return. Further upside is expected to close the gap between 248.70 and 333.22.
Our profit targets will be 329.00 and 400.00
Resistance: 240.00 / 330.00 / 400.00
Support: 160.00 / 125.00 / 81.00
Please be advised that the information presented on TradingView is provided to Vantage (‘Vantage Global Limited’, ‘we’) by a third-party provider (‘Signal Centre’). Please be reminded that you are solely responsible for the trading decisions on your account. There is a very high degree of risk involved in trading. Any information and/or content is intended entirely for research, educational and informational purposes only and does not constitute investment or consultation advice or investment strategy. The information is not tailored to the investment needs of any specific person and therefore does not involve a consideration of any of the investment objectives, financial situation or needs of any viewer that may receive it. Kindly also note that past performance is not a reliable indicator of future results. Actual results may differ materially from those anticipated in forward-looking or past performance statements. We assume no liability as to the accuracy or completeness of any of the information and/or content provided herein and the Company cannot be held responsible for any omission, mistake nor for any loss or damage including without limitation to any loss of profit which may arise from reliance on any information supplied by Signal Centre.

persistentPersistent made inverse head n shoulder pattern on an hourly charts & trading comfortably above neckline with decent volumes.
Could be bought with mentioned stoploss & targets.

Nobody saw that comingIn the coming months, I expect the following catalysts
1. Oil coming down, already there are discussions about removing Russia from OPEC
2. 10 Yr coming down, currently forming an H&S
3. FED adopt a more conservative strategy for interest rates going into 2023
4. Massive short squeeze on tech, High short interest rate there!
5. Rotation from oil to tech
45% are comparing this to .com and the other 45% to 08. Guess what the market likes to do...
This is not investment advice, do your own research!!!
Look First / Then Leap

USDCHF a short opportunity 🦐USDCHF on the 4h chart is trading at the recent highs.
The price is in a bull trend and creates a possible short opportunity below a monthly resistance.
After the head and shoulders neckline break the price in fact is approaching a minor support area.
How can I approach this scenario?
I will wait for the EU market open and check for a possible break below the support area .
In that case, i will look for the Plancton's strategy to be satisfied and set a nice short order
--––
Follow the Shrimp 🦐
Keep in mind.
🟣 Purple structure -> Monthly structure.
🔴 Red structure -> Weekly structure.
🔵 Blue structure -> Daily structure.
🟡 Yellow structure -> 4h structure.
⚫️ Black structure -> <4h structure.
Here is the Plancton0618 technical analysis , please comment below if you have any question.
The ENTRY in the market will be taken only if the condition of the Plancton0618 strategy will trigger.

CADCHF Sell with X3 Confluences
List of Confluence:
1. Head and Shoulders
2. Trendline Breakout
3. Key Level Breakout
The risk reward for this trade is 1 to 5.86.

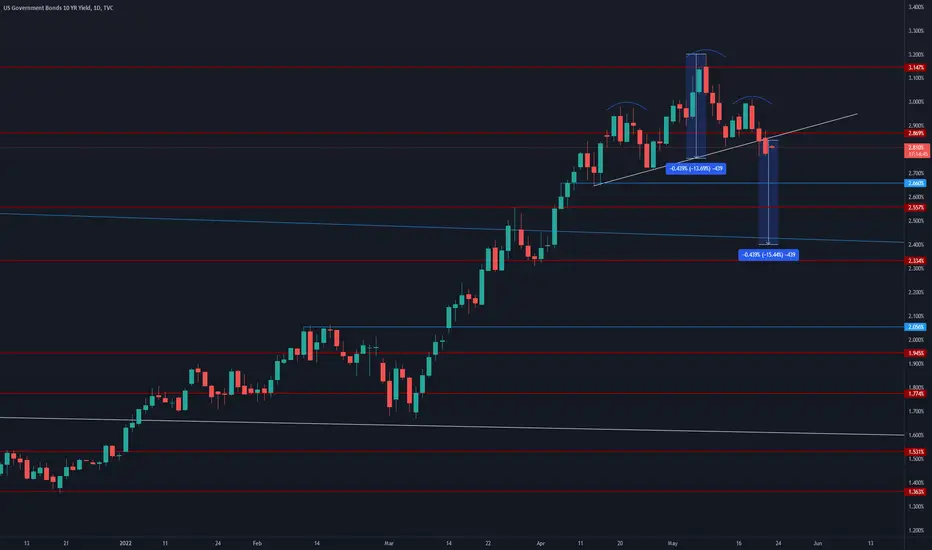
10 year yield broke below the H&S?It seems like the 10 year treasury yield formed a head and shoulders pattern.
It broke below the neck line on Friday May 20th 2022 which confirms the pattern.
Now we'll have to wait and see if it retests the confluence of resistance around the 2.869% area.
A dip in the 10 year yield may cause a rally in the tech sector and also in the general market.
The measured objective of this pattern would be around the 2.4% area over the coming weeks.
However, there are two levels of support in the way.
1) 2.66% which is a short term support level
2) 2.55% which is a historical level of support.
If we close below 2.55% we may be able to expect a further drop in the yields.
NZD/USDHello traders. I hope you are all doing well. Today I will show you my potential trading plan for NZD/USD next week, if things go as I expect. This is a 4h tf and we can see that we have two inverted head and shoulders patterns on it. The first one is almost done, because the minimum target of this small h&s is around 0.6450, and if the price continues to go higher, we can expect the formation of another h&s, the bigger one. In that case, the price could reach 1.618 extensions, which coincides with strong daily support. In this area, we can consider taking a short position. After that, we can wait for the formation of the right shoulder and consider taking a long position if things continue to move towards this scenario. Otherwise, if the price reaches only the minimum taregt of this small H&S, it is an obvious sign of weakness, so the trading plan should be changed in accordance with the factors that occur in that case.

Gu weekly outlook 22/5/22GU daily chart
Looking for the reverse head and shoulder formation to be formed.
MON-TUE I'm looking on the lower time frames for support to be formed in or above the green one to take buys to swing target.
If support fails or daily breaks and closes below green zone, trade will not be valid.

BTCUSDT Key level to SHORTCorrection in progress. Retest @ neckline w/ optional TP1. Head and Shoulders in validation, highly reliable. Timeframe predicting with applyed Fibonacci spiral. 70.7% Fibonacci retracement as an average good turning point from expected micro pullback. Expecting a slowing downward. Oscillators: Fisher Transform turning point and trajectory of price action predicted; Ehlers Stochastich Center of Gravity hidden bearish divergence. All reversal signals in confluence withe trendline resistence rejected. NONE bullish.

GBPJPY: Imbalance to ImbalancePrice trapped the head and shoulders sellers and I assume the majority of them are now all liquidated.
Maybe we can expect a sell to the fair value gap before we begin buying again.
What are your thoughts? 🔥

BTCUSDT Key level to SHORTBearish divergence on 15M Ehlers Stochastic CG. Supply. Overbought. Right shoulder to accomplish. Head and shoulder pattern in formation. Peak of a bearish flag.
