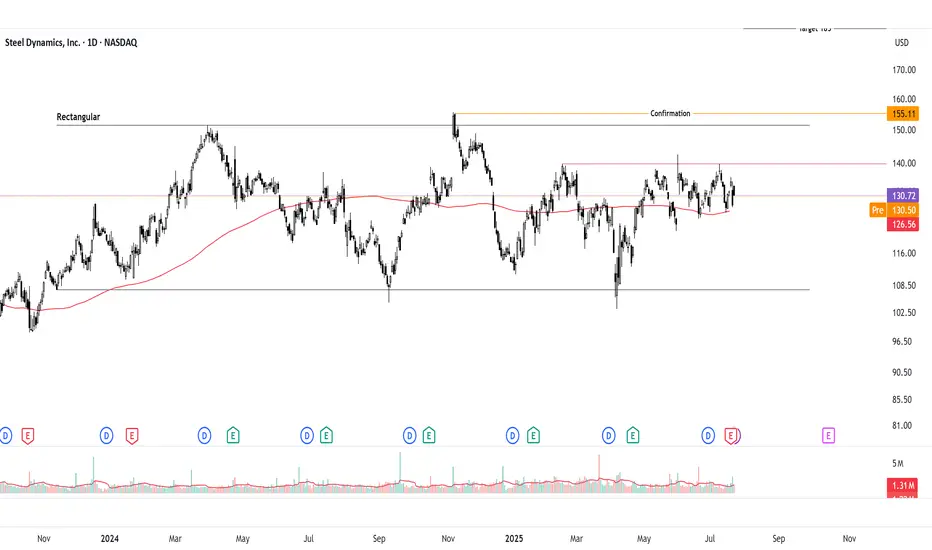
Bullish Breakout Watch on Inverted Head & ShouldersSteel Dynamics ( NASDAQ:STLD ) is consolidating on the daily chart but forming an inverted head and shoulders (IHS) pattern, signaling potential bullish reversal. Neutral until breakout above 140 pivot, but bias leans bullish with supportive steel fundamentals. Long idea on confirmation; current price ~132-135 (as of July 23, 2025). Upside targets offer strong risk-reward if triggered.
Thought Process Walkthrough:
Spotting the Setup: Scanned steel stocks amid sector rebound signals. STLD's daily chart shows a downtrend bottoming at 107, forming IHS: head at 107 support, shoulders higher, neckline ~140. Overlaid rectangular consolidation (107-151.5) adds confluence for breakout potential.
Technical Tools: Used trendlines (descending from highs, capping at 140-151.5), pivot points (140 key reaction level), and classic patterns. No indicators needed—price action clear: volume up on rallies, RSI neutral ~50. IHS target: measure 33-point head-to-neck, add to breakout → ~173 (adjusted to 185 for prior highs). Rectangular height ~44 points → 208 target.
Key Levels:
Support: 107 (IHS head, historical low—break invalidates bull case).
Resistance: 151.5 (rectangular top, past peaks—break above 155 confirms momentum).
These are significant due to repeated price reactions, providing high-probability zones.
Prediction: Consolidation now, but bullish breakout likely if 140 clears on volume, driven by pattern resolution and fundamentals. Without it, range-bound neutrality persists.
Fundamentals Supporting Thesis:
US steel outlook for 2025 shows moderate growth: CAGR ~2.4% through 2030, driven by automotive and construction demand. Economic moderation but robust drivers like infrastructure spending position the sector. For NASDAQ:STLD STLD, Q2 2025 EPS $2.01 missed estimates but operating income rose 39% despite challenges; revenue $4.57B, EBITDA $533M. Management eyes profitability acceleration into 2026 via efficiencies and demand While global capacity rises ~6.7%,US protections and STLD's strong balance sheet support upside.
Headnandshoulders
AT&T I Tipping Point : Short Opportunity with Head & ShouldersHey traders after a previous trade trade on the hood hitting targets of 16.4%. Today I bring you NYSE:T
Technical + Fundamental View
Pro Tip
- Breakdown below the Entry Line will be considered at Trade Initiation. (Risky Traders)
R:R= 5.4
- Rest can follow entry at day close post breakdown SL above Entry Candle.
- The Breakdown Below the Entry Line will confirm the head and shoulder pattern
Entry Line - 26.93
Stoploss - 27.53
Target 1 - 25.59 (Neckline of head and shoulder)
Target 2 - 24.74
Target 3 - 23.68
Technical View
- Head And Shoulder on Daily Time frame
- On the hourly timeframe, the chart looks weak, showing a potential double top pattern where the second peak is lower than the first, indicating growing investor fear.
Fundamental View
- High Debt: Over $140 billion in debt limits investment capacity and consumes significant cash flow.
- Network Issues: Poor service quality and outages risk losing customers to competitors.
- Strong Competition : T-Mobile and Verizon offer better plans, making customer retention harder.
- Market Saturation: The U.S. wireless market is nearly saturated, limiting new customer growth.
- Execution Risks: Growth and debt reduction depend on flawless asset sales and network upgrades; delays could harm finances and stock performance.
Additional Considerations
- AT&T’s valuation is higher than some peers, potentially capping upside.
- Telecom market competitiveness means growth hinges on successful 5G and fiber rollouts.
- Dividend yield (~3.9%) is attractive but lower than some rivals, which may impact income investors.

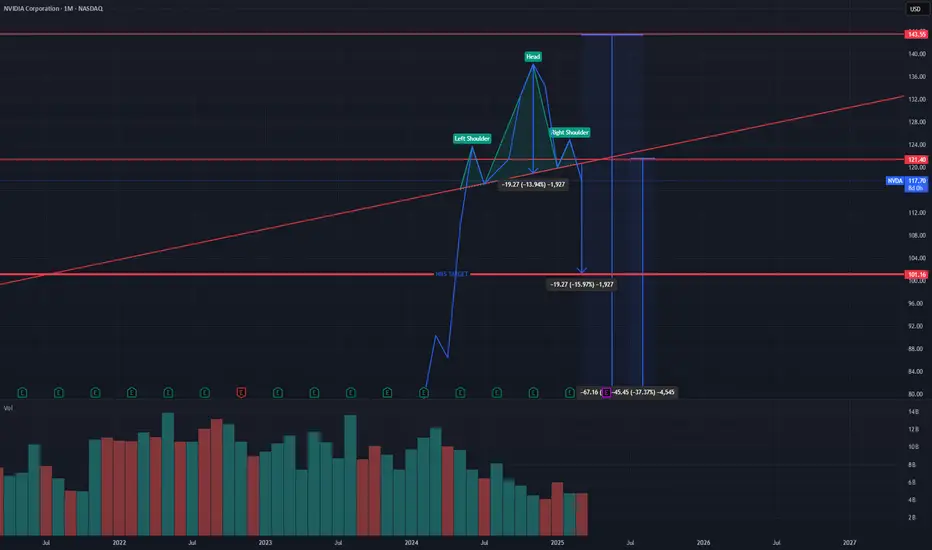
$NVDA H&S on Monthly...Linking previous short of NVDA. The right shoulder is technically not finished forming. However that trendline was tested not long ago.... will it hold? Who knows.
First target would be ~$100. If this plays out there will likely be a larger mark down phase consisting of retail panic selling. This will push toward $80 with a possible shakeout near the low/mid $70s before a long term accumulation process begins by big money.
Just because I am short on the stock does not mean I don't believe in the company or stock longer term. Have money on the sidelines to buy incase this plays out.
DOGE’s Next Move: Key Levels to WatchAfter a remarkable bull run from September to December 2024, DOGE concluded its rally with a rising wedge pattern, a sign of exhaustion. This structure also marked the completion of a 5-wave Elliott structure. The breakdown from the wedge came with a clean retest, followed by a significant drop.
Current Market Outlook
The new year began with a bullish rise, reaching the 0.618 Fibonacci retracement level at $0.364 (drawn from the high at $0.48434 to the low at $0.26216), a great short setup. Presently, DOGE appears to be forming an ABC corrective structure, with wave C in progress.
Additionally, a Head and Shoulders pattern is developing, with the neckline sitting close to the yearly open at $0.316.
Support and Confluence Zones
1.) Fibonacci Level:
The 0.618 Fibonacci Retracement of the 5-wave structure is positioned at $0.2353, which aligns with the Head and Shoulders target for strong confluence.
2.) Fair Value Gap (FVG):
There is an unfilled FVG and November’s untested high at $0.22888, which adds significant support confluence.
3.) Trend-Based Fib Extension:
Using the Trend-Based Fib Extension from wave B, the 0.786 Fib lies near the $0.2353 - $0.22888 range for further alignment.
4.) Monthly Level:
The monthly level at $0.22 strengthens the case for this zone being a critical support area.
5.) Fib Speed Fan:
If price drops to the $0.2353 - $0.22 region between January 17th and the end of the month, the 0.75 Speed Fan Fibonacci will also align with the support zone, further emphasising its importance as the fair value trend line.
Trade Setups
Short Setup:
Entry: Around the $0.397 0.618 Fib Retracement level
Stop Loss: Above $0.43
Take Profit: Targeting around $0.25/24
Risk-to-Reward (R:R): ~5:1
Potential Long Setup:
Entry: Within the $0.2353 - $0.22 support zone (confirmation needed)
Stop Loss: Below $0.22
Take Profit: Targeting around $0.275

VIRTUAL’s Incredible Year: Is a Top in Sight??VIRTUAL has experienced a phenomenal rise in recent months, climbing to rank 36 in the overall crypto market with an impressive $3.7 billion market cap. This meteoric growth is a testament to the strong interest and momentum behind the project. However, as we approach the end of the year, there are signs that a potential top could be forming. Let’s analyse the chart and key scenarios to watch for in the coming weeks.
Key Levels and Observations:
1.) Elliott Wave Analysis:
The price action suggests we are completing the 5th wave of an Elliott Wave cycle, signaling a potential exhaustion of the current uptrend.
Based on the Fibonacci extension of the last corrective wave, the 1.618 level is a critical resistance at $3.8134.
A breakout above $3.8134 could open the doors to test the psychological level of $4. However, failure to break this level might confirm the end of the 5th wave and initiate a correction.
2.) Head and Shoulders Formation (Potential Setup):
There are early signs of a Left Shoulder formation on the chart. If the price rejects at the 1.618 Fibonacci level, we could see the development of a Head and Right Shoulder, forming a bearish reversal pattern.
Confirmation of this pattern would require a clear neckline and increased selling volume, signaling a trend reversal.
3.) Time-Based Correction:
A correction could align with the broader crypto market trends as we head into early 2025. Given the potential for Bitcoin to drop to the 84K support zone, this could trigger a sell-off in altcoins, including VIRTUAL.
4.) Overall Market Sentiment:
While the broader market has been bullish, a Bitcoin-led correction could drag down the entire crypto market.
Altcoins often experience sharper corrections during Bitcoin downturns, which could result in VIRTUAL retracing some of its gains.
Volume Analysis: Monitor volume levels at key resistance points (e.g., $3.8134 and $4) for confirmation of breakout or rejection.
Market Correlation: Keep an eye on Bitcoin’s price action, as any significant movement could directly impact VIRTUAL and other altcoins.
Note: These are my personal thoughts and interpretations of the current market conditions. Please take them with a grain of salt. The crypto market is highly volatile and further data and confirmations are essential before drawing definitive conclusions. Happy trading!

Bearish Breakout: ZEN’s Path to $26 RevealedZEN has broken below both the daily open (dOpen) and weekly open (wOpen), signaling increased bearish momentum. The previous support levels now act as a Support/Resistance Zone, and bullish recovery requires reclaiming both dOpen and wOpen with significant volume. However, the current setup suggests further downside toward the $26–$25 range, which aligns with multiple confluences and the target from the Head & Shoulders (H&S) pattern.
Confluence for $26–$25 Support Zone:
Fibonacci Retracement (0.618): The key retracement level provides a strong support area.
$25 Key Level: A psychological and technical key level with historical significance.
Point of Control (POC): The POC from the previous trading range aligns perfectly with this zone.
Trend-Based Fibonacci Extension (1.272): The projected extension supports the target.
Fibonacci Speed Fan (0.777): Adds further confluence for this price level.
H&S Target: The projected target of the confirmed Head & Shoulders pattern coincides with this zone.
Outlook and Strategy:
Short-Term Bias: The bearish trend remains dominant unless bulls manage to reclaim dOpen and wOpen with strong volume.
Target Area: The $26–$25 range serves as the most probable area for a bounce or reversal due to multiple technical confluences.
Next Steps: If price reaches the support zone, look for a high-probability long setup with confirmation through increased buying volume, bullish candlestick patterns, and alignment with key indicators.

USOUSD Oil Long bets. Moving up slowly but surely. Daily TF.
The intraday chart around the 1hr and 2hr is a tad hectic with double / triple top, so the daily chart here has a triple bottom for structure support and a head'n' shoulders pattern which I dont think has triggered quite yet.
This trade I recommended on Monday for a long position and these price levels are a bit of a bargain.
If you wanted to buy in I would be buying the closing candle at 69.20
1 HR chart below. Price is just a nudge under 69 now

Chart say everything with Elliott wave counts and Chart PatternsChart say everything with Elliott wave counts and Chart Patterns
Looks like Inverted Head n Shoulder chart pattern, yet to Break above Neckline.
Scenario also aligns with Impulse wave counts.
Elliott Wave Counts
Inverted Head n Shoulder Chart Pattern Yet to confirm Breakout
I am not Sebi registered analyst.
My studies are for educational purpose only.
Please Consult your financial advisor before trading or investing.
I am not responsible for any kinds of your profits and your losses.
Most investors treat trading as a hobby because they have a full-time job doing something else.
However, If you treat trading like a business, it will pay you like a business.
If you treat like a hobby, hobbies don't pay, they cost you...!
Hope this post is helpful to community
Thanks
RK💕
Disclaimer and Risk Warning.
The analysis and discussion provided on in.tradingview.com is intended for educational purposes only and should not be relied upon for trading decisions. RK_Charts is not an investment adviser and the information provided here should not be taken as professional investment advice. Before buying or selling any investments, securities, or precious metals, it is recommended that you conduct your own due diligence. RK_Charts does not share in your profits and will not take responsibility for any losses you may incur. So Please Consult your financial advisor before trading or investing.

CROX Daily Head and Shoulders PatternCROX Daily Head and Shoulders Pattern forming with a gap to fill on the downside if neckline breaks.
Price target would be a range from 96 down to 90. If markets get ugly across the board it could see 81, but that's asking a lot from current levels.

Head & Shoulders pattern: 10 year yield could drop to 2.87%The series of tops shaped notorious Head & Shoulders pattern
on 10-Year Treasury yield (TNX).
The tallest peak is the Head and Shoulders are on both sides.
The Neckline is the support that is built through valleys of the Head.
The price has breached the Neckline this summer triggering the pattern bullish scenario.
The target is calculated by subtracting the height of the Head (from top to Neckline) from
breakdown point on the Neckline. It is located around 2.87%.
Almost 1% down from the current level

Trading Lucrative-Heads 'N' Shoulders Patterns : Silver 1 HR
Heads 'N' Shoulders' Patterns can be very lucrative and a pattern to keep in mind every trading day. They work on all time-frames. Often I see market structure price reversals on the 1 minute timeframe all the way down to 10 seconds.
They will be easier to trade on the higher time frames as their price-action can be super-fast on these very low timeframes. Depending on how you apply risk to reward in your trading, they will be more lucrative on the higher timeframes and more reliable because more traders see them on these bigger timeframes right up to weekly and monthly charts.
Here is what you need to know:
* Take advantage of the tradingview 'All Charts' pattern recogniser. This is what most traders including professional-traders would be using because it eliminates subjectivity.
* Draw your neckline from the bottom of left-shoulder across and beyond where the right shoulder comes down (price will be below to the left of the right shoulder & your exact point for the left shoulder will be under & to the right of left shoulder)
* Most often price will in the first instance after the right shoulder is formed, break through the neckline and then retest above the neck line or below the neck line if its a bullish Inverse Head 'N' Shoulders pattern. Seeing this retest occur will give the setup more reliability.
(Note: Price does not always Retest especially if price is selling or buying from a strong resistance or support area, respectively)
* Your trigger to buy or sell is on the retest/retracement above or below neckline, look for an increase in volume and/or a strong reversal candle like a pin-bar or engulfer.
(Your reward is generally the same distance as the neckline below the head)
* I hope this helps in your own trading. Trading is risky. Please don't rely solely on my financial analysis or trade setups.)

Crazy Sell-off in the Palladium Price since 2022. Over 200%. BUY
Why I think our Buy-setup in Palladium today has no much upside.
We have a bullish Head 'n' Shoulders on the 4HR timeframe. Right now price is giving you an even cheaper entry point before this pops!
So, is there demand for Palladium across the world? Take a read of this article from cmegroup.com
Why palladium matters to the growth of the platinum market
By World Platinum Investment Council - WPIC®
16 Jan 2024
Executive summary
Platinum is a critical mineral for the energy transition, and hydrogen-related demand for platinum is forecast to grow substantially through the remainder of the decade and beyond. Platinum catalysts in the electrolysis and fuel cell markets are expected to account for up to 15% of total platinum demand by 2030, reaching as much as 35% of total annual platinum demand by 2040.
The principal use of palladium in 2024 is in fossil fuel and hybrid vehicles, so the health of the automotive industry and the pace of transition to electric vehicles are the key drivers on the demand side.
From what I read, with electric-cars increasing there is not as much demand for catalyic-converters that are derived from palladium. However, there are other uses for palladium than electric cars and supply chains are continually disrupted by wars such as Russia and Ukraine.
All I see is the huge sell-off. I also see a monthly oversold condition for Platinum .

Bullish H n S for Bitcoin. Already retested!. Could POP hard
I was watching this one yesterday for BTCUSD but there was an opposing bearish Head n shoulder's pattern and the Bitcoin price really softened.
Take a look.
Trade entry: Look for increased volume & a bullish candle on approach to neckline.
Good luck,
Chris

Oceania trading week about to commence NZ. USD, Gold, Bitcoin
*
The USD could see some weakness this week, probably not coming until mid-week price possibly propelled by double/bottom structures on mid-timeframes, however the Daily timeframe is indicative of some weakness with price below the moving averages. It's possible later in the trading week the USD could retreat to the 100.60 - 100.85 zone where there is support. Let's see how that play out.
The whole idea is a bit counter-indicative of a short I am expecting on EUR/USD which is very overbought at the moment.
* In other developments, Bitcoin BTCUSD showed some strength during Sunday's session but is since off its' highs in the weekend session. However, BTCUSD is getting support on the 200 EMA on the Daily. I would not be surprised to see some bullishness in Cryptocurrency this week, with the shine perhaps coming off Gold which is overextended and overbought across all timeframes. The Silver price has further to run but will generally follow Gold's lead.
* In precious metals, as I point out above I see a short in XAUUSD very soon probably today, there is more buying demand on the higher timeframe for Platinum XPTUSD, XAGJPY, XAGUSD, XAUJPY whereas XAUGBP, XAUAUD & XAUUSD look over-bought. As I point out above, it's always tricky because I find they all mostly track the gold-price.
Have a good trading week, Oceania trading in NZ commences in 30 minutes (6pm New York time) and the Australian ASX kicks off in just over 2 hours time.
Chris

A risky yet legitimate Head 'N' Shoulders pattern on 4HR FTMUSA
So long as the BTCUSD price holds up during weekend trading this might pop to the upside soon, let's see how it plays out or if I get hammered down. There are opposing sell Head 'N' Shoulders setups on this same trade which complicates things a bit.

ELROND current 1HR timeframe Bullish Head n Shoulders
On the 1HR chart for Elrond, which I must point out is currently very thin volume, but I think this volume will pick up soon, you can see here on the 1HR that the H & S bullish pattern on 1HR price appears to be retracing & retesting the H & S setup zone near neckline.
Possible Trade Idea: Scale in with some Buy small orders just in case it winds back to $25 when I believe it will start to really move up again. But this H & S pattern on the 1HR may be the momentum upwards it needs.

Inverted Head and Shoulders Pattern for BTC/USD, Anyone?BTC/USD bulls have been making a comeback since forming a low of $56,478 and recently completed an inverted head and shoulders pattern (left shoulder: $59,559; head: $56,478; right shoulder: $60,165). Yesterday’s rally ventured through the pattern’s neckline, a descending line extended from the high of $67,273.
What is interesting from a technical standpoint is that the pattern’s profit objective – taken from the value between the head and the neckline and extended from the breakout point – merges with the all-time high of $73,845 at $73,756.

EOSUSDTHi guys
In my opinion, the rising guard of the chart is quite evident.
The condition of the above scenario for us is to maintain the support range of $0.6. Be sure to note that the reviewed process is long-term.
On the 4-hour time frame, we have a head and shoulder pattern at the end of the downward trend. Would you like to check on your chart (;
what do you think!?

Snowman Logistics Breaking Out from H&SIn the above weekly chart of Snowman Logistics NSE:SNOWMAN , we can see H&S (Head and Shoulders) pattern formation over a period of nearly 7 years and now it has broken out from the pattern. Re-test of the neckline also seem to have been done in last few weeks and neckline provided good support.
If we measure the height of pattern, it points to 112 levels which also happen to be very near to next major resistance of 114. It’s currently trading around 80 so this breakout might offer a potential upside of 60% in next few months.
On the flip side, if the stock goes back below neckline and sustains there for couple of days then this view is invalidated.

BTCUSDT📌 To complete the upward trend, it is necessary to see the $33,000 area again.
🔍 If we look carefully, we probably have a head and shoulders pattern.
▪️ The areas that we have identified are strong for supply and from here the possibility that a higher ceiling will be set for us is very, very weak
What do you think?

My investment stockPlease note this stock have my portfolio stock
Very bulish on this stock
Reverse header and shoulder pattern
No recommendation for buy and sell
Fundamentals strong stock

How to Head and ShouldersGreetings, Financial Enthusiasts! 🌟 If you appreciate our charts, give us a quick 💜💜
The Head and Shoulders pattern is a well-known chart formation in technical analysis. It indicates a reversal from a bullish to a bearish trend, usually at the end of an upward trend.
Key Points:
- Head and Shoulders: Chart pattern signaling trend reversal.
- Formation: Three peaks on a baseline - two lower outer peaks and a higher middle peak.
- Bullish to Bearish: Suggests a shift from an upward trend to a downward one.
- Applicability: Seen on all timeframes, suitable for various traders and investors.
- Entry Levels: Easily identifiable, aiding in trade implementation.
Why It Matters:
The Head and Shoulders pattern provides traders with a visual representation of a trend reversal. It's widely used due to its simplicity and applicability across different timeframes.
The Pattern:
- Formation (Market Tops):
1. Left Shoulder: Price rises, forms a peak, then falls.
2. Head: Price rises again, forming a higher peak.
3. Right Shoulder: Price falls again, then rises but forms a lower peak than the head.
- Formation (Market Bottoms):
1. Left Shoulder: Price falls, forms a trough, then rises.
2. Head: Price falls again, forming a lower trough.
3. Right Shoulder: Price rises again, then falls, forming a higher trough than the head.
Neckline:
- For Market Tops: Connect the low after the left shoulder to the low following the head to create the neckline.
- For Market Bottoms: Connect the high after the left shoulder to the high after the head to form the neckline.
Trading the Pattern:
- Wait for the pattern to complete before trading.
- Entry when price breaks below the neckline (tops) or above it (bottoms).
- Stops placed above the right shoulder (tops) or below it (bottoms).
- Profit targets calculated based on the head-to-shoulder difference and added (bottoms) or subtracted (tops) from the breakout level.
Why It Works:
- Sellers enter as price falls from its peak, reducing aggressive buying.
- The neckline marks a point where traders exit positions, driving price toward the target.
- A lower right shoulder (tops) or higher right shoulder (bottoms) signals a trend shift.
- Profit target assumes forced exits by those in losing positions.
- The neckline prompts many traders to exit, pushing price towards the target.
- Volume analysis helps confirm patterns; expanding volume (bottoms) shows increased buying interest.
Pitfalls:
- Waiting for pattern completion may require patience.
- Not all patterns lead to successful trades.
- Profit targets aren't always reached.
- External events can disrupt patterns.
- Patterns can be subjective; traders should define their criteria.
The Head and Shoulders pattern, though not foolproof, provides a structured approach to identify and act on trend reversals.

GBPUSD PRICE ACTION TRADING INV. HEAD & SHOULDERS
Hello traders! Today, we're diving deep into GBPUSD, which is showcasing a promising trading opportunity.
On its daily chart, GBPUSD has carved out a classic price action reversal pattern: the inverse head and shoulders.
Following a decisive break above the neckline at 1.24340, the price retraced to 1.25913. Capitalizing on this momentum, we've placed our long orders at 1.26551, influenced by a diamond bottom formation. With meticulous entry points and tight stop-loss measures, we've set our sights on targets at 38%: 1.32521 and 62%: 1.37530.
For a comprehensive visual representation, check out the charts here:
🔗 View GBPUSD Chart 1
🔗 View GBPUSD Chart 2
🔗 View GBPUSD Chart 3
🔗 View GBPUSD Chart 4
Stay tuned, traders! In the coming days, we'll be unveiling a plethora of setups.
If you find this analysis valuable, please support the idea with a like and consider following for more insights.
Trade Carefully, Profit Wisely (TCPLTP)!
