My investment stockPlease note this stock have my portfolio stock
Very bulish on this stock
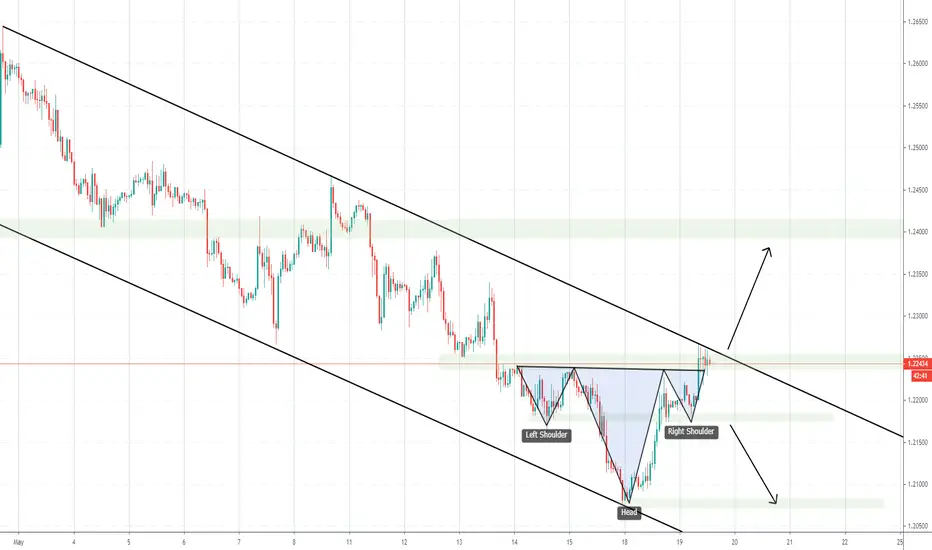
Reverse header and shoulder pattern
No recommendation for buy and sell
Fundamentals strong stock
Headonshoulders

How to trade head and shoulder pattern? As a forex trader, it's essential to have a robust arsenal of technical analysis tools at your disposal. One of the most powerful and reliable chart patterns you can use is the "Head and Shoulders" pattern. This pattern is prized for its ability to signal potential trend reversals, allowing traders to make informed decisions and capitalize on market opportunities. In this comprehensive guide, we'll delve deep into the Head and Shoulders pattern, breaking down its components, identifying its variations, and learning how to trade it effectively.
Understanding the Head and Shoulders Pattern
The Head and Shoulders pattern is a classic reversal pattern that forms after an extended uptrend, signaling a potential change in market direction from bullish to bearish. It consists of three peaks, with the middle peak (the "head") being higher than the other two peaks (the "shoulders"). The pattern typically unfolds as follows:
1. The Left Shoulder
- The left shoulder represents the first peak after a strong uptrend.
- This peak is typically followed by a minor retracement, creating the first trough.
2. The Head
- The head forms after a brief rally from the left shoulder's low point.
- It represents the highest peak in the pattern and usually exceeds the previous peak.
- After reaching this peak, the price retraces again, forming the second trough.
3. The Right Shoulder
- The right shoulder is the third and final peak in the pattern.
- Like the left shoulder, it is lower than the head and forms after a minor rally.
- The right shoulder's high is followed by a retracement, creating the third trough.
Key Characteristics of the Head and Shoulders Pattern
To effectively identify and trade the Head and Shoulders pattern, it's crucial to understand its key characteristics:
1. Symmetry
- The left and right shoulders should be roughly symmetrical in terms of height and width.
- The head should be the highest point in the pattern.
2. Volume
- Volume plays a vital role in confirming the pattern.
- Volume should generally decline as the pattern forms and then increase as the price breaks below the neckline (more on this later).
3. Neckline
- The neckline is a trendline drawn horizontally connecting the low points of the left and right troughs (the shoulders).
- The neckline serves as a critical level of support. A breach of this level confirms the pattern.
Trading the Head and Shoulders Pattern
Trading the Head and Shoulders pattern involves two main steps: identification and execution.
Identification:
1. potting the Pattern: Begin by identifying a well-defined Head and Shoulders pattern on your forex chart.
2. Volume Confirmation: Ensure that volume decreases as the pattern forms and increases upon breaking the neckline.
3. Neckline: Draw a neckline connecting the lows of the left and right shoulders.
Execution:
1. Entry Point: Place a short trade when the price breaks below the neckline. This serves as a signal that the pattern has confirmed.
2. Stop-Loss and Take-Profit: Set a stop-loss order above the right shoulder and a take-profit order based on your risk-reward ratio.
3. Risk Management: Be mindful of risk management, and never risk more than you can afford to lose on a single trade.
Variations of the Head and Shoulders Pattern
While the classic Head and Shoulders pattern is powerful, variations can offer additional insights:
Inverse Head and Shoulders:
- An inverse Head and Shoulders pattern signals a potential bullish reversal.
- It comprises three troughs with the head being lower than the shoulders.
- The pattern is confirmed when the price breaks above the neckline.
Complex Head and Shoulders:
- Complex variations may have multiple heads or shoulders, making them harder to spot.
- Despite their complexity, they follow the same principles of confirmation through neckline breaches.
Conclusion
The Head and Shoulders pattern is a valuable tool in the forex trader's toolkit. By mastering its identification and execution, you can gain a competitive edge in the market. Remember that no pattern is foolproof, and risk management remains paramount in forex trading. As with any technical analysis tool, it's essential to combine the Head and Shoulders pattern with other indicators and analysis methods for a well-rounded trading strategy. So, start practicing, keep refining your skills, and always stay informed about the latest market developments to become a successful forex trader.

Bearish head and shoulder In Indigo 🎨 A very good bearish head&shoulder made in the 1 day chart of Indigo paints soo its a tym to short it or not buy it .
Sell Indigo paints below 1479
Target 1444 1395 1365 1350
Sl 1550

BATUSDTHello again
Currently, we are at the bottom of the long-term ascending channel, the channel has not broken down, the ranges have been maintained in the corrective trends.
As long as the price range of $0.2919 is maintained, there is a possibility of completing the head and shoulder pattern at the end of the downward trend.
Don't forget that in order to form an upward trend, the downward trend line must be broken upwards and the failure must be consolidated.
We would be happy to hear your comments(;

BTC at critical support, but sings point downIn this weekly chart we can more easily see the rising Head and Shoulders pattern, followed by a long flag pattern lasting over two months. The H&S pattern is confirmed by the volume and with the breakout from the flag today (closing price at $35800 at time of writing, or more than 3% previous close), we next must watch the green dotted line support. If the probable break from that support happens, I'm expecting it to tumble to around $29000, presenting the next opportunity for reversal based on standard measurement of a head and shoulders pattern.
Key learnings:
- H&S pattern has higher volume on left shoulder than the head.
- pattern breakout is when closing price is more than 3%. In this case, BTC price close is more than 5% lower than the support trend line of the flag pattern.
- measurement principle for H&S is about half the height from neckline to the top of the head, so expect drop to $29000

NEARUSDT created a head and shoulders.The price created a head and shoulders on 4h and had a breakout from its neckline.
We could see a pullback on the daily resistance on 14.1$.
Big news on NEAR with USN and Liquidity mining, so we could see a false breakout from this area.
How to approach?
We will wait for a clear pullback until the neckline, if the price is going to have a rejection from that area we could wait for a new short position, otherwise, if the price is going to have a breakout from the 16$, we could see a new bullish impulse until the previous ATH
––––
Keep in mind.
🟣 Purple structure -> Monthly structure.
🔴 Red structure -> Weekly structure.
🔵 Blue structure -> Daily structure.
🟡 Yellow structure -> 4h structure.

What is Head and shoulders pattern and how to trade with that?*The Head and Shoulders ( Bearish ) pattern is one of the most popular and best known price patterns in trading.
This is a very accurate trading signal if you know how to use it properly and flexibly.
*What is Head and Shoulders? How to identify and characterize
Head and Shoulders is the name of a special type of price pattern that usually appears at the end of uptrends. This is a signal of future downtrends.
It is called Head and Shoulders because the shape of this pattern on the price chart is similar to that of the human body including Left Shoulder, Head, and Right Shoulder.
The line connecting the two troughs of the shoulders is often called the neckline. In fact, this pattern is perfect when the Neckline is horizontal (the prices of the two lows are approximately the same).
How to trade with this:
ENTRY POINT : Right after the candlestick breaks out of the neckline (or at the Retesting the neckline )
STOP-LOSS : At the peak of the right shoulder.
TARGET : Usually, Head and Shoulders is a pattern for starting a downtrend. Therefore, adjust the first target to the height of the neckline to the top (H) of the pattern and adjust the next targets according to the past price and chart.
This is the academic shape of this pattern, in the future we will publish other types of head and shoulder patterns 📚 . Please follow our page to be informed as soon as the materials are published.
Thank you all for supporting our activity with Likes 👍 and Comments ❤️

Short $SPY CMP $436.58Short $SPY CMP $436.58. Appears to be head and shoulder formation on daily chart. Rejected from long term trendline. Next support ~$420-$425

NZDCAD Weekly Price has formed a powerful head on shoulders reversal pattern here, breaking below support to finish off last week with a bearish engulfing candlestick. In the weeks again, I am anticipating price to make its way towards the neckline, & if that is broken then a completion of the pattern could occur in the near future.

Sweet Goodbye for DXYMonthly is looking weak for DXY.
Bear signals:
1 - Lower High has been made shown by top dotted line Nov-March 2016-17
2 - lower high has created new trend which was respected at Feb-June 2020
3 - Fibonacci 0.618 bounce Jan-April 2018 was textbook for growth but couldn't break the new high, since then we have been falling through the Fibonacci lines and is likely to keep breaking them as we couldn't extend past previous high at 103
4 - Green trend line starting May 2011 was broken at Jul 2020 and tested at Nov 2020 and couldn't break back above which indicated the current leg down
5 - Head and shoulders pattern forming on monthly indicated by light blue line, neck break will be 88 and at which point target will be 79 at the original swing low zone at April 2014
Last line of support for DXY is the 0.618 Fibonacci line at 88.610 which is a major support line. But with the current world status, and with the overview on FIAT currencies, the extreme printing rate of USA and the stimulus checks it is amounting to a weaker DXY over the next 3-4 years.

SXPBTC is creating a massive Inverse head and shoulder 🦐The price is creating an inverse head and shoulder on a daily timeframe, and now the price is testing its neckline. IF the price will have a breakout and flip the current neckline into new support, According to Plancton's strategy (check our Academy), we can set a nice order
–––––
Follow the Shrimp 🦐
Keep in mind.
🟣 Purple structure -> Monthly structure.
🔴 Red structure -> Weekly structure.
🔵 Blue structure -> Daily structure.
🟡 Yellow structure -> 4h structure.
⚫️ Black structure -> <4h structure.
Here is the Plancton0618 technical analysis, please comment below if you have any question.
The ENTRY in the market will be taken only if the condition of the Plancton0618 strategy will trigger.

Usd/chf head and shoulder patternUsd/chf head and shoulder pattern
Waiting for conformation before enter to the sell trade

head and shoulders inside a simmetrical triangleon short terms swing trade there is a chance to head and shoulders pattern.
So it's berish pattern but in medium term and long therm it's still bullish rally.
If you want take some profit and set limit buy order on fibonacci retracement level. No risk of catch falling knives on short term with low leverage below 10x.
Good Luck

NEOUSDT is creating the head and shoulder 🦐$NEO.X is testing the daily dynamic trendline and the price created the head and shoulder. IF the price will lose the dynamic and weekly support (neckline) we can looking for a short position According to Plancton's strategy (check our Academy), we can set a nice order
–––––
Follow the Shrimp 🦐
Keep in mind.
🟣 Purple structure -> Monthly structure.
🔴 Red structure -> Weekly structure.
🔵 Blue structure -> Daily structure.
🟡 Yellow structure -> 4h structure.
⚫️ Black structure -> <4h structure.
Here is the Plancton0618 technical analysis, please comment below if you have any question.
The ENTRY in the market will be taken only if the condition of the Plancton0618 strategy will trigger.

TOMOBTC is creating an inverse head and shoulder 🦐After previous profit , $TOMO.X creates an inverse head and shoulder, and now the price is testing its neckline (weekly resistance) IF the price will have a breakout and flip the weekly resistance into new support, According to Plancton's strategy (check our Academy), we can set a nice order
–––––
Follow the Shrimp 🦐
Keep in mind.
🟣 Purple structure -> Monthly structure.
🔴 Red structure -> Weekly structure.
🔵 Blue structure -> Daily structure.
🟡 Yellow structure -> 4h structure.
⚫️ Black structure -> <4h structure.
Here is the Plancton0618 technical analysis, please comment below if you have any question.
The ENTRY in the market will be taken only if the condition of the Plancton0618 strategy will trigger.

NZDUSD good time for sellNZDUSD , created strong head and shoulder pattern and two indicators saws sell trand of this chart. now you can place the sell order . please if you like my trading ideas like, comment and share

YFII/USDT HEAD AND SHOULDER PATTERN================ BINANCE:YFIUSDT ================
head and shoulder mean bearish TIME
==============================================
Trading Involves High Risk
this is Not Financial Advice
Please use Risk Management
==============================================
If You Like My Ideas
please Supporting My Channel
Through Leaving A Thumbs Up, Comment & Follow
Happy Trading make a profit ! --> Thank You! :)
==============================================

CONCOR - H&SConcor previously had AB=CD and given perfect target, now made Head and Shoulders on Daily Chart. Short Below 361.20 till 345, As 345 has demand zone so it might give a pull back and will try to break neck line of 361.2, Safe Trader can short below 345 if broken with huge volume .

JSWSTEEL - HnSJSWSTEEL formed Head and shoulders as well as triangle breakdown can be clearly seen. Previosuly it has bullish flag at 30 mins TF but now gave triangle breakdown with HnS ... Targets on chart...

EURGBP lost a big support 🦐EURGBP lost a big support and now the price is retesting it.
The price created a big Head and shoulder and breakout the ascending channel.
According to Plancton's strategy, we can set a nice order
–––––
Follow the Shrimp 🦐
Here is the Plancton0618 technical analysis, please comment below if you have any question.
The ENTRY in the market will be taken only if the condition of Plancton0618 strategy will trigger.


GBP/USD for short term buyLong trade only if channel is broken and closed above trendline. Short if price break and close under shoulders and support :)
Trading the Inverse Head And ShoulderAn inverse head and shoulders , also called a "head and shoulders bottom" , is similar to the standard head and shoulders pattern, but inverted: with the head and shoulders top used to predict reversals in downtrends. This pattern is identified when the price action of a security meets the following characteristics: the price falls to a trough and then rises; the price falls below the former trough and then rises again; finally, the price falls again but not as far as the second trough. Once the final trough is made, the price heads upward, toward the resistance found near the top of the previous troughs.
Investors typically enter into a long position when the price rises above the resistance of the neckline. The first and third trough are considered shoulders and the second peak forms the head. A move above the resistance, also known as the neckline, is used as a signal of a sharp move higher. Many traders watch for a large spike in volume to confirm the validity of the breakout. This pattern is the opposite of the popular head and shoulders pattern but is used to predict shifts in a downtrend rather than an uptrend.
A suitable profit target can be ascertained by measuring the distance between the bottom of the head and the neckline of the pattern and using that same distance to project how far price may move in the direction of the breakout. For example, if the distance between the head and neckline is ten points, the profit target is set ten points above the pattern's neckline. An aggressive stop loss order can be placed below the breakout price bar or candle. Alternatively, a conservative stop loss order can be placed below the right shoulder of the inverse head and shoulders pattern.
An inverse head and shoulders pattern is comprised of three component parts:
After long bearish trends, the price falls to a trough and subsequently rises to form a peak.
The price falls again to form a second trough substantially below the initial low and rises yet again.
The price falls for a third time, but only to the level of the first trough, before rising once more and reversing the trend.
Trading an Inverse Head and Shoulders Aggressively
A buy stop order can be placed just above the neckline of the inverse head and shoulders pattern. This ensures the investor enters on the first break of the neckline, catching upward momentum. Disadvantages of this strategy include the possibility of a false breakout and higher slippage in relation to order execution.
Trading an Inverse Head and Shoulders Conservatively
An investor can wait for the price to close above the neckline; this is effectively waiting for confirmation that the breakout is valid. Using this strategy, an investor can enter on the first close above the neckline. Alternatively, a limit order can be placed at or just below the broken neckline, attempting to get an execution on a retrace in price. Waiting for a retrace is likely to result in less slippage; however, there is the possibility of missing the trade if a pullback does not occur.
