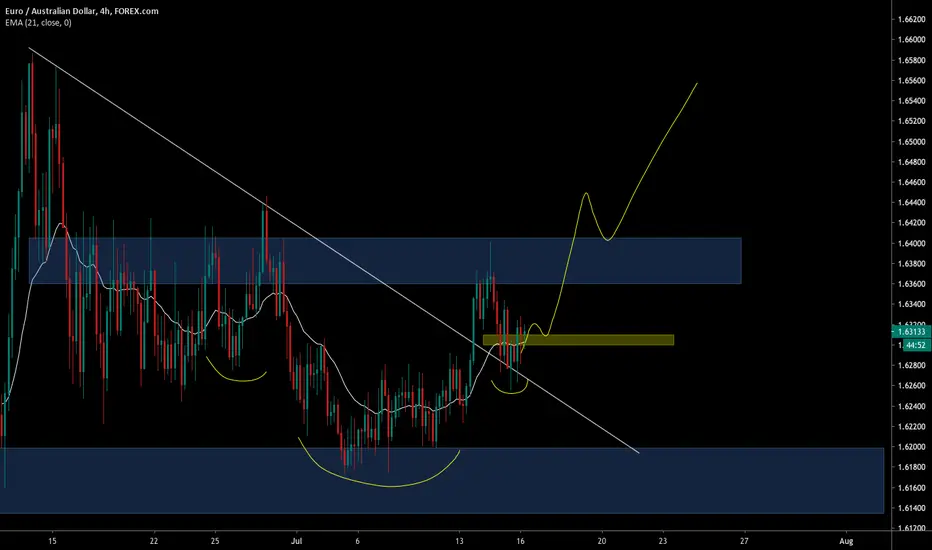
EURAUD broken triangle 🦐EURAUD broken triangle and is creating inverse head and shoulder on 4h structure, According to Plancton's strategy, we can set a nice order
–––––
Follow the Shrimp 🦐
Here is the Plancton0618 technical analysis, please comment below if you have any question.
The ENTRY in the market will be taken only if the condition of Plancton0618 strategy will trigger.
Headshoulders

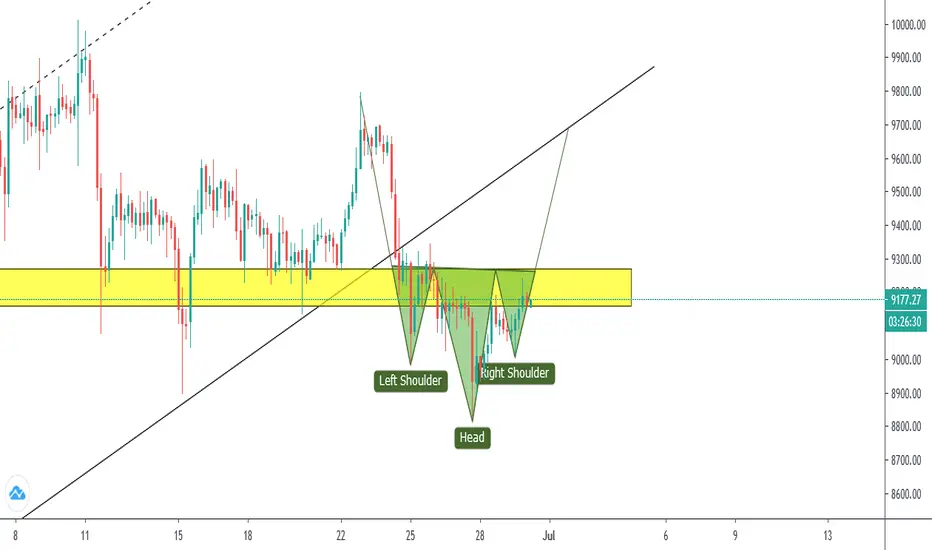
EURGBP lost a big support 🦐EURGBP lost a big support and now the price is retesting it.
The price created a big Head and shoulder and breakout the ascending channel.
According to Plancton's strategy, we can set a nice order
–––––
Follow the Shrimp 🦐
Here is the Plancton0618 technical analysis, please comment below if you have any question.
The ENTRY in the market will be taken only if the condition of Plancton0618 strategy will trigger.

𝐒𝐄𝐋𝐋 𝐄𝐔𝐑𝐆𝐁𝐏 𝐍𝐨𝐰! (𝙁𝙤𝙧𝙚𝙭 𝙨𝙞𝙢𝙥𝙡𝙞𝙛𝙞𝙚𝙙)EURGBP has currently broken below the neckline of its Heads and Shoulders pattern. its next stop would be the 0.89200 support region......GOODLUCK.


EURUSD SHORTPretty new to trading but I kinda like this idea.
Might bounce back up at support but i think it will continue the downtrend.

BTCUSD REVERSE HEAD & SHOULDERS Abtin00Hello guys
Thanks for supportin us , liking us and following us
In here we have reverse head & shoulders ( it seems ) , According to market that can do anything we are put SL
Put SL with your own capital management guys it better than use our SL
Good Luck
Abtin

EURUSD Head & Shoulders Pattern Abtin00Hello again guys
We are seeing head and shoulders pattern in EURUSD we that can reach the target we shown on chart but the market can do anything because of that you should put STOPLOSS
Be patient and take proft guys
We are working on a VIP GROUP for our users and followers to take our analysis and tutorial for analysis every markets
Good Luck
Abtin

2X H+S Still in PlayContinuation of last BTC Chart - Latest ES/SPX dump has our 2X H+S (and 2 year triangle) back on the table after a feet dragging melt-up fake out. Fed sugar high wear off, nagging Covid hangover, and poor macro fundamentals (eg unemployment) leading us back down to the neckline. MACD looking bearish for now as well, watching and waiting.

Expecting a super cool BUY on GOLD. H&S seems visible in FlagGOLD struggle to reach demand zone and therefore expecting a breakout at the supply zone and if it happen there will be a huge boom for GOLD. Keep an eye and only BUY if a breakout is fully confirmed.
Manage risk and open trades at your own risk as I am not an expert in the prediction. Market are meant to be move on emotions!
Any thoughts are welcome :)

GBPUSD Head & Shoulders ReversalLooking for a reversal trade as we come into tomorrow's session. GBPUSD had a decent run today, but now looking overextended and exhausted. However, we can still see some upside potential as we haven't, as yet had any confirmation of a reversal. I've marked out a range that i will be looking at and one idea will be a break and retest to the downside on the 5min chart. Currently we are seeing a right shoulder forming giving us a potential head and shoulders pattern. Let's see what the London session brings.

Trading the Inverse Head And ShoulderAn inverse head and shoulders , also called a "head and shoulders bottom" , is similar to the standard head and shoulders pattern, but inverted: with the head and shoulders top used to predict reversals in downtrends. This pattern is identified when the price action of a security meets the following characteristics: the price falls to a trough and then rises; the price falls below the former trough and then rises again; finally, the price falls again but not as far as the second trough. Once the final trough is made, the price heads upward, toward the resistance found near the top of the previous troughs.
Investors typically enter into a long position when the price rises above the resistance of the neckline. The first and third trough are considered shoulders and the second peak forms the head. A move above the resistance, also known as the neckline, is used as a signal of a sharp move higher. Many traders watch for a large spike in volume to confirm the validity of the breakout. This pattern is the opposite of the popular head and shoulders pattern but is used to predict shifts in a downtrend rather than an uptrend.
A suitable profit target can be ascertained by measuring the distance between the bottom of the head and the neckline of the pattern and using that same distance to project how far price may move in the direction of the breakout. For example, if the distance between the head and neckline is ten points, the profit target is set ten points above the pattern's neckline. An aggressive stop loss order can be placed below the breakout price bar or candle. Alternatively, a conservative stop loss order can be placed below the right shoulder of the inverse head and shoulders pattern.
An inverse head and shoulders pattern is comprised of three component parts:
After long bearish trends, the price falls to a trough and subsequently rises to form a peak.
The price falls again to form a second trough substantially below the initial low and rises yet again.
The price falls for a third time, but only to the level of the first trough, before rising once more and reversing the trend.
Trading an Inverse Head and Shoulders Aggressively
A buy stop order can be placed just above the neckline of the inverse head and shoulders pattern. This ensures the investor enters on the first break of the neckline, catching upward momentum. Disadvantages of this strategy include the possibility of a false breakout and higher slippage in relation to order execution.
Trading an Inverse Head and Shoulders Conservatively
An investor can wait for the price to close above the neckline; this is effectively waiting for confirmation that the breakout is valid. Using this strategy, an investor can enter on the first close above the neckline. Alternatively, a limit order can be placed at or just below the broken neckline, attempting to get an execution on a retrace in price. Waiting for a retrace is likely to result in less slippage; however, there is the possibility of missing the trade if a pullback does not occur.


Gold - GC1 - Potential Reversal pattern - Head and Shoulders topIt might be a Reversal Pattern Head and Shoulders.
Volumes do not confirm this pattern and it should be read as warning for us traders.
Personally I would not invest in the GOLD Market.
For a short term trading the market seems to be bullish.


ESNT more like, DSNTLooks like break of a neckline on a weekly and daily chart. A sloppy head and shoulders. Symmetry support held at $48.15 this morning after earnings, but my dowsing suggests selling rallies with a trend reversal, and that ESSENT is in DESCENT.
2 Bar daily squeeze likely to fire short, and I expect downward pressure on indexes, so this looks like the beginning of a downtrend.
I wouldn't want to see it close above it's 20 period daily MA (now at 51.30), but stop at $52.
Entry anywhere under there.
Hold ~9 weeks. Target $34.38 area

Inverse Head & Shoulders Us30Price hasnt broken the support level, possiblity to form inverse head & shoulder on H4.
Right shoulder to be completed for a full H&S.

Review of Execution of GJ Signal: Inv. H&S for +157 pipsThis is reviewing an actual entry I took for GJ which resulted in far more than my target being hit. As you can see, paying attention to-- being aware at all times of a dynamic market-- and being ready to spot an inverse or a regular head and shoulder pattern can pay out big time. They are my favorite patterns to trade, because if done RIGHT, they have a very high probability of success and continuation probability (allowing for tight stops, and RRs of 1:4+)

CADJPY Broader Head and Shoulders PatternLike what I see here on the CADJPY.
We had our downtrend, and now have made a reversal pattern here. Today's daily candle closed higher above previous highs and had quite the strong break, although I would have preferred if it close above the wicks.
This trade is valid above the 83.00 higher low level. That is the swing we are working with.
Would be looking at 85.00 for take profit. Cad could also coincide with the Oil break we have had.
