HBAR Game Plan: Short the Bounce, Long the Liquidity GrabHBAR has been moving strongly and is currently offering both short and long trade opportunities based on a clean potential ABC corrective pattern, key fib levels, volume profile, and anchored VWAP. Let’s break down the setup.
🧩 Technical Breakdown
Higher Timeframe Confluence:
0.618 fib retracement from the macro move
1.618 trend-based fib extension
1.272 VWAP band resistance
Point of Control (POC) from the visible range profile
This is marked as a major take profit/short opportunity zone.
For extra confluence, the negative fib extension golden pocket (-0.618 to -0.666) also aligns right at this resistance zone
Current Structure:
We’re potentially completing wave B of an ABC corrective move
Price has retraced into a high-probability short zone
🔴 Short Setup
Entry Zone:
Between the 0.702 and 0.786 fib retracement levels
Why Here?
0.702–0.786 fib retracement → short zone for reversals
Potential wave B top → setting up for a C leg down
Target (TP):
Around $0.25–$0.24, near the expected wave C completion
🟢 Long Setup
Entry Zone:
~$0.25–$0.24 area.
Why Here?
This zone is a strong confluence area:
➡️ 0.786 fib retracement
➡️ 1.0 trend-based fib extension of ABC
➡️ Anchored VWAP from the entire trend, offering dynamic support
➡️ Liquidity pool
➡️ Previous weekly Open
Plan:
Wait for price to complete wave C into this zone, then look for bullish reaction signs to enter long.
💡 Educational Insight
Why the 0.702–0.786 short zone?
These fib levels are often overlooked but are key “hidden” zones where wave B tops out before C waves.
Why anchored VWAP?
Anchored VWAP gives you dynamic institutional support/resistance, especially when aligned with fibs and liquidity.
Why wait for confirmation?
Blindly longing or shorting levels can trap you. Wait for SFPs, wick rejections, or lower timeframe structure flips to boost trade probability.
Final Thoughts
HBAR is in a highly interesting zone, offering both:
A short setup into the C wave,
And a long setup at the C wave completion, backed by multiple confluence factors.
Let the levels come to you and wait for confirmation!
_________________________________
💬 If you found this helpful, drop a like and comment!
Want breakdowns of other charts? Leave your requests below.
Hederahashgraph

Hedera Update · Keep Holding · No Selling, YetHedera (HBAR) looks awesome. The action and chart right now is one of the best in the market. I love the fact that the candles are moving straight up. This can be equated to how FUN Token (FUN) has been performing in the past month. What one does, the rest follows.
The most interesting signal comes from MA200. Trading is happening above this level and that's all we need to know. When HBARUSDT broke above it, any bullish potential and bullish signals become fully confirmed. It is not a question of "if" anymore but instead a done deal. Growth is expected to happen for a period ranging between 3-6 months once this signal shows up.
This means you can see a strong retrace in a month and still, you remain calm and hold because you know higher prices are still possible. This means that if you see a correction after three months, you can take profits of course but still know that the top is not in. It will take a while before the entire bullish process is complete.
The top is not only calculated based on time duration but also on price levels and marketwide action. Depending on how the rest of the market is doing; looking at Bitcoin and at what price the pair in question is trading can help us confirm if the top is in. For now you just keep on holding.
Each chart/project/pair needs to be considered individually. If your technical analysis ability is lacking, you can always contact me and I will publish an update for you. If you publish news articles, videos, trade-signals or even TA, you can come to me for confirmation, ideas or just inspiration and I will take care of the rest. Once you have your update you can decide what actions to take. It is still early in this game.
The initial portion of the bull market is long gone. Here it started in November 2024, you can see it as the "market bottom." We are on the second portion now in 2025. The year started with a correction and the correction ended in April-June with a very strong higher low. Projects like this one reveal super-strength compared to the rest of the market, it happens with the top 100.
If you consider some of the smaller projects I've been sharing, you see double-bottoms compared to 2024, 2023 and even 2022 and even new all-time lows. Here the low in 2025 is far away from November 2024 and this is good news. That is why I say that each chart/pair needs to be considered individually because conditions are not the same for each project. The market has now thousands of good projects and tens of thousands of trading pairs. It is impossible to say how one will move based on the other because they are just too many and too far away.
The bigger picture and the general bias, yes, bullish all across. Exact resistance and support levels, where to sell, where to buy; should I continue to hold? This is what needs to be considered individually.
Your support is appreciated.
If you enjoyed, please follow.
Namaste.

Hbar breaking upwar from fallingwedge/pennantAlso in a smaller double bottom setup here. *not financial advice*

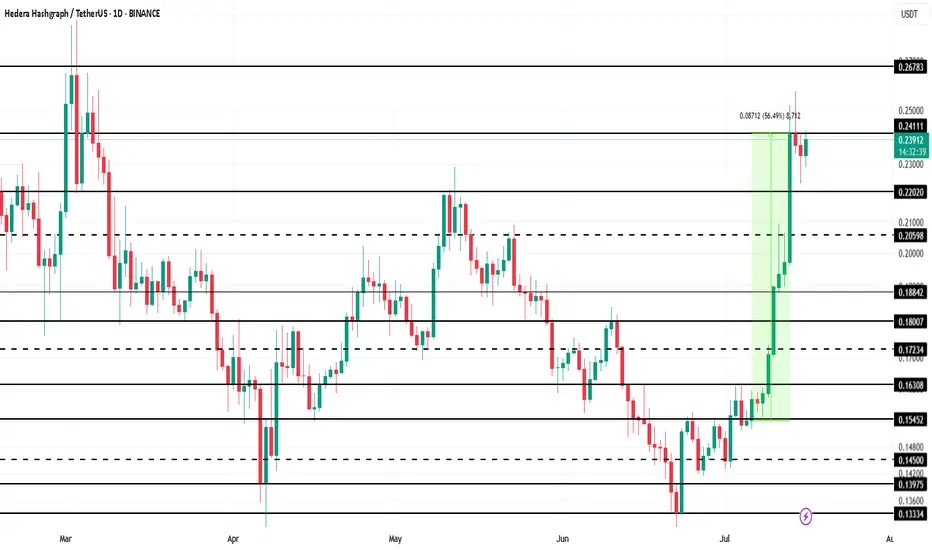
HBAR Price Drop To $0.20 Likely; $53 Million Liquidation AheadBINANCE:HBARUSDT price currently sits at $0.235, encountering resistance at $0.241. Despite its recent rally, the broader market conditions are pulling it down, and the next major support level is at $0.220 . If the altcoin fails to hold above this level, it could slide towards $0.200.
Looking at the liquidation map, there is a real possibility of significant losses for $BINANCE:HBARUSDTtraders. The map shows that if the price drops to $0.20 or lower, approximately $53 million worth of long positions would be liquidated . This would create a wave of selling pressure and potentially drive the price down further.
In the event of a surge in bearish sentiment or increased selling pressure, BINANCE:HBARUSDT could fall below $0.220 , hitting the psychological support level at $0.200. A drop below this critical level would likely trigger the $53 million worth of liquidations, further exacerbating the decline.
However, if BINANCE:HBARUSDT manages to hold above $0.220 and successfully breaches the $0.241 resistance, there could be an opportunity for a rally. A successful bounce off $0.220 could push HBAR towards $0.267 , providing some relief to traders and reinforcing its bullish outlook.
I have been waiting to get my signal on HBAR and finally got it!Trading Fam,
I know my crypto portfolio is getting destroyed as I prepare for a future altcoin run towards the latter half of this year. And it sucks. Bitcoin hodl'ers definitely look like the true champions at this point outpacing us altcoin traders by a huge margin. However, I've been through this before. Multiple times. And I know that when they run, altcoins will more than make up for our losses and pay massive dividends. We simply have to remain patient and stick to our strategy which is to continue to look for those great entries into some of our larger cap altcoins. So, that is what I'll do until one of two things occurs: A) either my portfolio dies completely or B) I am able to prove that altcoin traders can eventually beat the Bitcoin hodl'ers. It will be option "B". That's my final answer.
You get to watch all this unfold. And fortunately for you, I am the guinea pig. If you want to join me in these trades, you have that option. If you want to sit by and watch this entertainment, which admittedly hasn't been pretty as of late, you can do that too. But, in my heart of hearts, I believe our strategy will eventually pay off.
With that said, I've long been waiting for my indicator to give me the signal on this outstanding altcoin, HBAR. I mean, it's been months. The last time it flashed green for me we went from 12 cents to 24 cents. Unfortunately, my cash reserves were locked up in other trades. Today is different.
I've entered this trade at around 15 cents. My first target will be 17 cents. My final target will be 23 cents giving us more than 50% profit if achieved.
On the technical side, you can see that we have entered a beautiful area of large liquidity. This is where buyers typically step in. My bet is that they will do so again to break us to the upside of that descending trendline taking us at least to our VRVP point of control on this chart (yellow line).
I know that it is not easy trading alts in this volatile political/geopolitical global environment we have somehow sadly inherited. But I have to remain optimistic that the collective good in man will eventually prevail over the corrupt and mostly misanthropic characters we call "leaders". Once these tides begin to shift and show, massive energy will propel us onward and upward into the future. I believe cryptocurrency will help in this shift. What we will then witness will be like nothing we've seen before. This remains my hope as I continue to tread these perilous trading waters.
✌️ Stew

A linear Chart version of the current HBAR bull patternsIt just dawned on me that I had my chart on logarithmic for the previous 2 posts I amde about HBARUSD. As usual, the chart patterns on the log chart tend to have much higher breakout targets than the version of the chart patterns that appear on the linear chart. As soon as I realized this I went back in and adjusted the patterns to their linear chart erosions. The inverse head and shoulders remained mostly the same but the bullflag/desceding channel has now morphed into a falling wedge/bullish pennant. As you can see the breakout target for all 3 patterns is a much lower price than what the price targets were on the logarithmic chart. That’s not to say that the logarithmic targets are invalid, I think what will most likely occur Ike usually is both chart’s targets will be validated, it will likely just take much longer for the logarithmic chart’s targets to be reached as is how things usually pan out. *not financial advice*
Weekly timeframe version of previous HBARUSD postWanted to show my previous hbar idea which was on the daily time frame on the weekly as well so I could fit the pole of the bullflag in the frame here. I will put a link below to my daily time frame version of this post which goes into slight more detail about each pattern and also the Nvidia hbar news. *not financial advice*

HBARUSD has 3 bullish patterns stacked on top of eachotherThe inverse head and shoulders in the light blue, the light tan is the bull flag, and the pink is the double bottom. Currently price is above the Bullflag and the Inverse head and shoulders pattern. The bullflag also counts as a descending channel pattern as well. We just recently retested the neckline of the inverse head and shoulders as exact wick support which is a good sign. All 3 should provide eachother with the bullish confluence needed for them to be validated, but in addition to this technical bullishness we have some fundamental bullishness occurring just recently too as NVIDIA just announced their new Blackwell chips — claiming them to be the future backbone of AI infrastructure — which are integrating verifiable compute which has its fundamental trust layer built on Hedera. This also provides great bullish confluence and heightens the probability these 3 chart patterns will all be validated and reach their full targets. I will keep updating this post as they do so. *not financial advice*

HBAR (Local) Elliot Wave ii UnderwayHBAR appears to have completed a leading diagonal for wave 1 after finding a bottom at the major support high volume node (HVN).
Wave 2 has retraced the expected 61.8% Fibonacci but alt coins have their own Golden Pocket at the 78.6% retracement which aligns with the S1 pivot and high volume node.
The descending resistance line has been tested as support leaving a doji but does not look strong enough to be the bottom yet.
Wave 3 should be a powerful move up.
This analysis is invalidated below macro wave 4 -$0.12556
Safe trading

HBAR Masterclass: Fib Precision + ConfluenceHBAR has been a dream to chart lately — beautifully technical, clean reactions, and a strong respect for structure. When a chart follows fibs this precisely, charting becomes fun — like solving a puzzle that pays. You stop forcing trades and start enjoying the process.
Let’s break down where the next high-probability trade setup lies — and why.
Elliott Wave Context
HBAR recently completed a 5-wave impulse structure and is now unfolding a ABC correction:
✅ Wave A: Broke below Wave 4's low
✅ Wave B: Rejected cleanly at the 0.618 retracement of Wave A
🔄 Wave C: Currently unfolding, with price structure hinting at a Head & Shoulders forming to the downside
Interestingly, HBAR has been bouncing between golden ratios like a Fibonacci pinball machine. — reinforcing how well this asset respects technical structure.
🟢 Long Opportunity: The Golden Pocket Zone
By pulling Fibonacci retracement from the entire 5-wave leg (from $0.16941 to $0.22885), we uncover the golden pocket:
0.618 Fib → $0.19212
0.666 Fib → $0.18926
But what really strengthens this zone is the confluence:
📍 21-Day EMA → $0.19361
📍 21-Day SMA → $0.19229
📍 Anchored VWAP from the $0.15396 low → ~$0.19135
📍 4/1 Gann Fan support (if reached between May 15–17)
Together, they form a tight support band between:
🎯 $0.195 – $0.18926
📐 How We Projected the 1.618 Target
Here’s where the magic of planning comes in.
If Wave C finishes within this golden pocket, we can anticipate the next move by applying a trend-based Fibonacci extension. This gives us a realistic projection for the next impulsive move:
📈 1.618 extension lands at → $0.28654
This level also aligns with the yearly level and previous key high — forming an ideal final target
📘 Educational Insight: Why Golden Pockets Matter
In trading, the “golden pocket” — the 0.618-0.666 Fibonacci retracement zone — is often where high-probability reversals take place. It’s a zone where buyers (or sellers) return with conviction after a correction. When this area also aligns with EMAs, anchored VWAPs, Gann levels etc. and previous structure, it becomes more than just a level — it becomes a decision zone.
This is where confluence transforms a trade idea into a trade setup.
🟢 Long Trade Setup:
Entry: Laddered between $0.195 – $0.18926
Stop-Loss: Below $0.185
Take-Profit: $0.28654
R:R: ~10:1
Potential Gain: ~+50%
🔴 Short Setup (If Rejected at Extension):
If price hits $0.28654 and shows exhaustion or bearish reversal patterns (SFP, engulfing candle, volume spike), a short could be considered:
Entry: ~$0.286
Stop-Loss: $0.2967 (better above $0.3)
Target: $0.2622
R:R: ~2:1
HBAR is giving us a textbook case of structure, rhythm, and precision. Whether it’s the golden pocket, the 1.618 extension, or the alignment of multiple tools — this is how clean setups are built.
Set your alerts. Trust the plan. Let the chart come to you.
In trading, silence is a skill — knowing when not to act is as powerful as knowing when to strike.
____________________________________
If you found this helpful, leave a like and comment below! Got requests for the next technical analysis? Let me know.

Master HBAR with Fibonacci: The Golden Pocket BlueprintSince topping out at $0.20151, HBAR has spent the last nine days in a corrective pullback. Digging into a rich confluence of supports that offers a long trade setup. Here’s how to spot the high‑probability entries, manage your risk, and scale out for maximum reward.
Current Context
Two days ago, price was firmly rejected at the weekly open ($0.19029) right alongside the anchored VWAP drawn from the $0.28781 swing high.
HBAR now trades below the monthly open ($0.18210), the weekly open ($0.19029), and the daily open ($0.18024), sitting at about $0.177.
Just beneath today’s level lies the swing low at $0.17543. Breaching this could flush out stops before any meaningful bounce.
The Golden Support Zone
All signals converge between $0.170 and $0.1725:
The anchored VWAP from the $0.12488 low sits at around $0.17.
The 0.618 fib retracement of the $0.15396→$0.20239 move falls at $0.17246. Just under the swing low where the liquidity lies.
The secondary 0.666 fib retracement lands at $0.17014, reinforcing that floor.
Volume‑profile analysis of the past 27 days pins its Point of Control right at $0.17, great confluence with the anchored VWAP.
This “golden pocket” is your pivot for a low‑risk, high‑probability long.
Long Trade Setup
Ladder buy orders between the swing low ($0.17543) and the 0.666 fib at $0.17014.
Aim to average in around $0.1725.
Place a single stop‑loss just below $0.17
Scaling Your Exits
First Partial Exit at the monthly open ($0.18210). This offers roughly a 2:1 R:R.
Second Exit Zone around the weekly open and VWAP resistance (~$0.19) for about a 3:1 R:R.
Final Target at the 0.618 fib retracement of the entire down‑wave (from $0.28781 to $0.12488) near $0.2256. An astounding 10:1 payoff for the patient trader.
Keep in mind a potential false‑break (SFP) at $0.17543: if price briefly dips below then snaps back up, with increased volume.
Short Trade Setup
For traders looking to play the downside from the “golden pocket” flip, here’s a clear short strategy:
Entry Zone: Ladder short entries between the 0.618 fib at $0.22557 and the 0.666 fib at $0.23339.
Confluence: The 0.666 level aligns perfectly with the negative 0.618 fib from the prior swing, creating a resistance zone.
Stop‑Loss: Place your stop just above $0.23339, invalidating the confluence.
Take‑Profit: Target a return to around $0.206, where you can lock in gains as HBAR retests its previous high.
By scaling into shorts across that fib band, you balance your risk and capture the high‑odds reversal offered by stacked Fibonacci confluence. Let the golden pocket guide both your longs and shorts!
Key Takeaways
Confluence is king: VWAPs, Fibonacci retracements, Liquidity and volume‑profile all align in the $0.170–$0.175 zone.
Risk control: One stop‑loss under $0.17 protects the entire laddered entry.
Tiered targets: Small wins at $0.182, larger as you clear $0.19, and a big payoff if HBAR rallies toward $0.225. Trail your SL accordingly.
Patience pays: Wait for price to enter the golden pocket, avoid chasing!
With these confluences lining up and clear levels to work from, HBAR’s next high‑probability long setup is staring you in the face. Trade smart, size appropriately, and let the market reward your discipline.
Happy Trading!
___________________________________
If you found this helpful, leave a like and comment below! Got requests for the next technical analysis? Let me know.

Price Takes a Breath Before the Next RunBINANCE:HBARUSDT has been moving in a smooth uptrend, followed by a brief consolidation — forming a classic bullish pennant pattern. This indicates a temporary pause before a potential continuation toward the main target zone at 0.21182 – 0.21855.
A breakout above 0.19195 confirms the validity of the pennant pattern, especially after the price successfully held above the demand zone at 0.18907 – 0.18633. The next key level to watch is the prior high of the pennant (highlighted with a red arrow).
For a solid bullish continuation, ensure the breakout is clean — no fakeouts or re-entries back into the pennant. If a false breakout occurs, it's wise to either trim your position or set a break-even stop to protect your capital.
Note: Manage risk with proper stop loss just below the demand zone.

HBAR/USDT Analysis – A Solid Reversal PointThis coin has a strong volume zone between $0.155–$0.1485, where signs of a large player have been observed multiple times.
On a broader scale, we’ve already broken the short trend, so we may now continue moving toward new highs.
We’re considering a long position upon a test and reaction from the mentioned zone, with an initial target of $0.17.
This post is not financial advice.

Hedera Hashgraph: 23% Drop to Monthly Support, Target 0.15Hello and greetings to all the crypto enthusiasts, ✌
All previous targets were nailed ✅! Now, let’s dive into a full analysis of the upcoming price potential for Hedera Hashgraph 🔍📈.
Hedera Hashgraph is forming a new parallel channel, with an expected decline of at least 23%, bringing the price to the monthly support level. A retest of this support is likely, providing a potential entry point. My price target is set at 0.15 following this phase.📚🙌
🧨 Our team's main opinion is: 🧨
Hedera Hashgraph is set to drop 23%, reaching monthly support, with a potential retest and a target of 0.15.📚🎇
Give me some energy !!
✨We invest hours crafting valuable ideas, and your support means everything—feel free to ask questions in the comments! 😊💬
Cheers, Mad Whale. 🐋

Hedera Hashgraph: Balancing ActHedera Hashgraph’s HBAR continues to hover just above the $0.17 support level, moving within an increasingly narrow sideways range. If the price breaks sustainably below this red line (38% probable), the green corrective wave alt. will establish a new low. Our primary assumption, however, remains that the green wave was already completed with the late February low, at the upper boundary of our now grayed-out Target Zone. If this assumption holds and buying pressure returns soon, HBAR should rally above the $0.39 resistance during the green impulse wave .

HBAR... make a decision already. HBAR is in a weird spot it either is going to make a complete 3-wave retracement through the volume gap, or get over-bought and move up. Regardless, of the way the chart looks it is most likely going to get a lower high without more volume. Spot is your friend.

HBAR ETF FILING WITH NASDAQ: SPOT LONG HBAR!For people who follow me for a while, know that I'm bullish on HBAR as it's simply the most secure, fastest, cheapest and most energy efficient Layer 1 in the crypto space.
The HBAR ETF has been in the air since december leading to roughly a 8x in price for HBAR. Now, we have an ammended filed (a few changes after comments from the SEC) and a listing proposal for the Nasdaq. So it's about to get real!
DO NOT USE LEVERAGE, YOU WILL GET REKT, JUST BUT ON SPOT - NFA
According to Bloomberg ETF analyst Eric Balchunas the HBAR and Litecoin ETF's will be listed this year. With the ammended filing, HBAR is now in pole position to be the first altcoin ETF after BTC & ETH. Tie that up with massive institutional backing HBAR has from the likes of Google, Tata, IBM, Dell and many more, you can expect some fireworks.
This is the part of the cycle where winners will be chosen, and I believe HBAR is one of them!
First target is $0.30, then $0.40, if $0.40 is broken, we can run to $1 or more...

Hedera Hashgraph: Target Zone AwaitsFollowing the recent sharp sell-off and the immediate rebound, Hedera Hashgraph’s HBAR has stabilized just above $0.20. Currently, the coin is attempting a small breakout to the upside. If HBAR manages to surpass the $0.39 resistance at this stage, the next impulsive move of the green wave alt. will begin earlier than primarily expected (33% likely). In our primary scenario, however, the price should still drop into our beige long-entry Target Zone between $0.17 and $0.08. There, the low of the green correction wave should be settled before wave can advance beyond $0.39.

HBAR’s Next Support and Resistance TargetsHBAR hit a key high at $0.3922 but faced rejection, suggesting the formation of a trading range or a potential ABC corrective structure. A developing head and shoulders pattern further signals possible bearish momentum in the short term.
Key levels and trade setups:
Short Setup:
Entry: Around the 0.618 Fibonacci retracement of the current wave
Stop Loss: Above the $0.3922 key high
Take Profit: Targeting the Fib Retracement 0.382 at $0.34356
R:R: A favorable 5:1 if taken from the 0.618 retracement or 2:1 when entering after losing the dOpen
Support Zone:
Anchored VWAP, weekly level and Fibonacci speed fan 0.618, depending on timing, align near $0.34356–$0.33284. This confluence provides a robust area for potential price bounces.
Long Setup:
Entry: Within the support zone, contingent on bullish confirmation
Stop Loss: Below the support zone

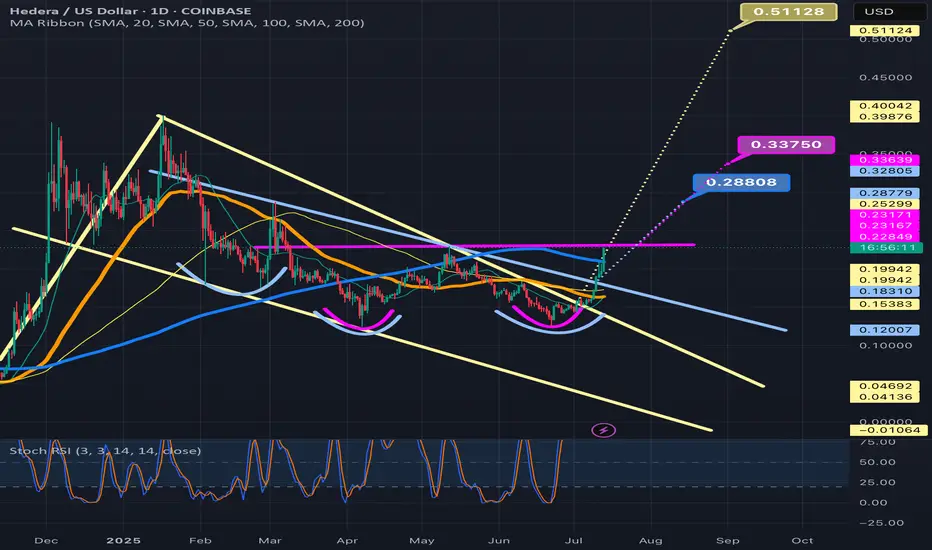
Hedera (HBAR): Bullish Channel Targets $0.45+📈 Hedera (HBAR): Eyeing a Breakout – Here’s What to Watch 🚀📊
Hedera Hashgraph (HBAR) is holding strong within a bullish channel on the 12H chart, with the price consolidating near a critical level. The key resistance at $0.45 could be the gateway for a breakout toward higher levels, while a pullback to support zones remains a possibility.
Technical Setup:
Bullish Channel Formation: HBAR is steadily trending upward, respecting the mid-line of its channel.
Key Resistance: A breakout above $0.45 could lead to the next major target at $0.62.
Pullback Potential: Failure to break through might lead to a retest of $0.20, offering another buying opportunity.
Why Hedera is Thriving Fundamentally:
Institutional Backing: Grayscale’s interest in HBAR hints at growing institutional adoption.
Ecosystem Growth: With over 30 billion transactions, Hedera showcases unmatched scalability and real-world utility.
DeFi Advancements: Collaborations like Chainlink’s Proof of Reserve integration position Hedera as a leader in decentralized finance.
ETF Speculation: Rumors of an HBAR ETF are fueling excitement, adding bullish sentiment to the market outlook.
Hedera is carving its space as a powerful force in blockchain and Web3. With both technical and fundamental signals aligning, this could be a big year for HBAR! What’s your outlook on Hedera’s future? Share your thoughts below. 👇
One Love,
The FXPROFESSOR 💙

$HBAR just broke the bullish price patternJust like my signal call during the SHIBA INU price pattern. This time a good call for accumulation for $HBAR. Aside from good technical formation, this project is packed with fundamental goodness. I should say, by 1st quarter of 2025 it will make unchartered all-time-high of at least $3-$5. Just a matter of time.. NAFA DYOR
#hederaHashgraph #hbar #helloFuture

HBAR on the Edge: Key Levels You Can't Miss!HBAR has been range-bound for over 40 days, trading between $0.3922 and $0.2341, following a rejection from the golden pocket zone. Let’s dive into the key resistance and support zones to identify potential trade setups.
Support Zone Analysis
Taking the entire bullish run from November, we observe the 0.5 Fibonacci Retracement at $0.2169, which aligns perfectly with the anchored VWAP from the November lows, providing a strong support confluence. Adding to this, the negative Fibonacci extension of the current downside wave places the -0.666 Fibonacci level at $0.21778, further reinforcing this zone.
Additionally, the lows around this area contain significant liquidity, likely targeting long-leverage positions, which increases the conviction for this support zone. The monthly level at $0.2217 also aligns with this area, making $0.217-$0.222 a highly reliable support zone for potential trade setups.
Resistance Zone Analysis
HBAR has recently broken below the yearly open level at $0.269, which now acts as a resistance.
For those who missed the previous short entry, price action near $0.269 presents another opportunity for a short trade if price rises to this level, confirming its resistance.
Chart Pattern & Volume Analysis
The structure shows an inverted cup and handle pattern. Volume has been in steady decline throughout this trading range, indicating a pause in bullish momentum.
Trade Setups
Short Trade
Entry: Around $0.269 (yearly open and key resistance zone)
Stop-Loss: Above $0.285
Target: Support zone at $0.217-$0.222
Long Trade
Entry: Around $0.217-$0.222
Stop-Loss: Below $0.210.
Target: Retest of the previous lows at $0.235
R:R: 2:1, making it a decent trade.

HBAR likely to break outta flag as it breaks stochrsi resistanceNotice the yellow descending trendline on the stoch rsi indicator, we can see this line held resistance fr quite some time but stochrsi is now finally braking above t while price action has simultaneously closed the previous candle with the body poking above the top trendline and now the current daily candle looks like it will hold that trendline as solid support and potential even act as the breakout confirmation candle. Probability is high the breakout will be confirmed in the next few days *not financial advice*
