HBARUSD LongBuy and Hold Hedera Hashgraph ... Current price is $0.870 , Today we have strong bullish signal on daily chart, Target is $0.30 level, potential profit +250%...
Hederahashgraph

$suku first buy single on the 4h in a week$suku volume rising and the first buy signal on the 4 hour in over week just went up. i see $suku moving upwards regularly over the next few weeks with huge pumps of random volume

$HBAR - where does this dip? What a beautiful chart. Can easily see red getting tagged.
Where do you think this dips to?

Hbar bullish trajectory scheme Tomorrow Hbar have a test net schedule, considering lately market condition if bullish imminent hit our target amid bitcoin rally, this trajectory could be our basis backed strategy for Hbar price prediction. This is just trajectory for bullish scheme. Not financial advise but this is just insight.
Keep Do Your Own Research but Hbar adoption could be massive because tracking capabillity.

HBAR Long Nice! Leveraged Hbar at 0.37 and has reached my short term target - Left 30% of my position running as Davos 2023 is fast approaching and could trigger a rally for Hbar.
HBAR - ALBT are my favourites for the new year - STACK YOUR BAGS

HBAR | Will History Repeat itself?#HBAR Pretty Solid Downtrend Breakout ✅
Will History Repeat itself ?
Please like the idea for Support & Subscribe for More ideas like this and share your ideas and charts in Comments Section..!!
Thanks for Your Love & Support..!!

HBAR - updaterange bound for now. looks highly likely that a restest of .03 happenes as theres still a bunch of liquidity down there from the last run to highs. once that liquidity is grabbed, assuming the asset isnt complete garbage it should turn around and if we see a strong momentum flip then targets would be above. would look to accumulate in the lower range of .038 - .034 personally. good luck out there traders

HBAR Pattern ComparisonComparing the pattern prior to the previous run-up vs. where we are now, this is the 3-day chart we're viewing. I've copied and stretched it out in order to re-size our old pattern vs. today's pattern.
HBAR likes to repeat similar patterns, let's see if it happens once again.
Related ideas linked below under Links to Related Ideas.

Expanded Flat Correction Soon or Longer Accum Phase FirstThere have been two bull runs so far for HBAR, each forming higher levels of support above its previous lows. It appears to be consolidating above the area of the first run; similar to how it consolidated above its original lows before the 2nd run. Trend-based fib extension also has the chart consolidating above the 1.618 fib of what could be an expanded flat correction, which I've posted about previously (linked below under related ideas).
This chart shows two theories about that:
1.) a bull run soon from a typical expanded flat correction - everything appears lined up for that, and it has broken its 3-day downtrend, but is still missing the volume spike needed for that run
2.) without that volume spike soon, there may be a 3rd and longer accumulation phase that drags out to some date prior to the 2024 btc halving
Note that the last two runs also had long and longer accum phases as well. Either is possible, and there still hasn't been a strong test of support since initially getting here, which could also be a possible trigger for the spike that is needed.

Hedera Hashgraph (HBAR) formed Gartley for upto 17.50% pumpHi, friends, hope you are well and welcome to the new trade setup of the Hedera Hashgraph (HBAR) coin with US Dollar pair.
Previously I shared the below long-term trade setup for HBAR, which is still in play:
Now on a daily time frame, HBAR has formed a bullish Gartley pattern.
Note: Above idea is for educational purpose only. It is advised to diversify and strictly follow the stop loss, and don't get stuck with trade

HBAR S&R zones#HBAR/USDT
$HBAR hold above support zone and now is on a rally toward descending resistance line.
🐮 break out from descending resistance will increase price to touch resistance zone between $0.078 and $0.087.
🐻 rejection from descending resistance, will drop price toward support zone again.
#women_life_freedom

Hedera HBAR Bear Market RallyFriday the S&P hit a new 52 week low, being oversold right now.
I expect a bounce in the stock market next week, which will determine a bear market rally in the crypto space too!
Hedera HBAR is one of the cryptocurrencies that have a lot of potential for a bull run.
HBAR/USDT
Entry Range: $0.052 0.059
Price Target 1: $0.065
Price Target 2: $0.073
Price Target 3: $0.082
Stop Loss: $0.045

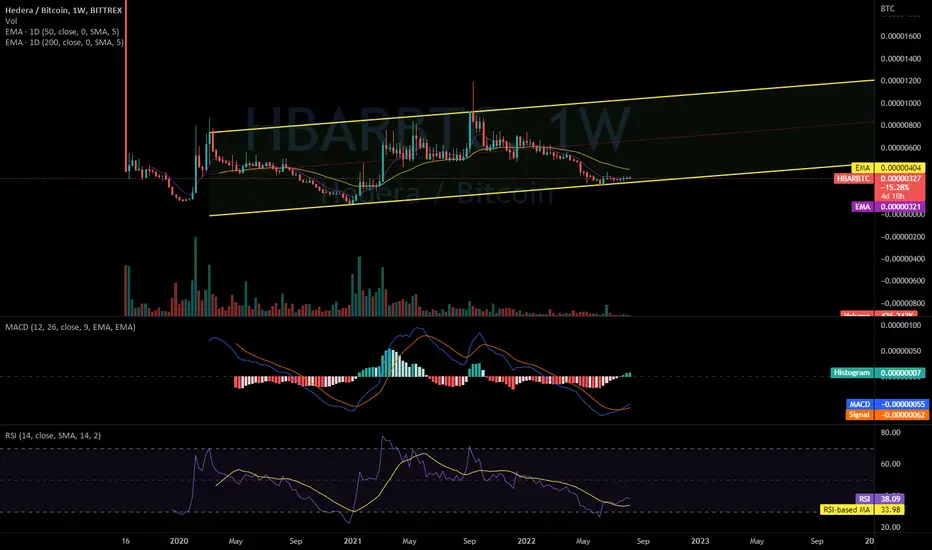
HBAR / BTC in a Parallel Uptrend?Quick chart here. Is HBAR / BTC in a parallel uptrend? We still need 3 touches at top and bottom to confirm this. If this is correct, we're at the bottom of the trend now and should see another trip to the top.
Should we do that and stop at the top, expect to see a third trip to the bottom as well. MACD and RSI are also pointing to a reversal here, as confluence.
An alternative possibility, if we hold channel bottom and then break channel top, this could turn into a giant inverted head/shoulders and become much more bullish sooner.
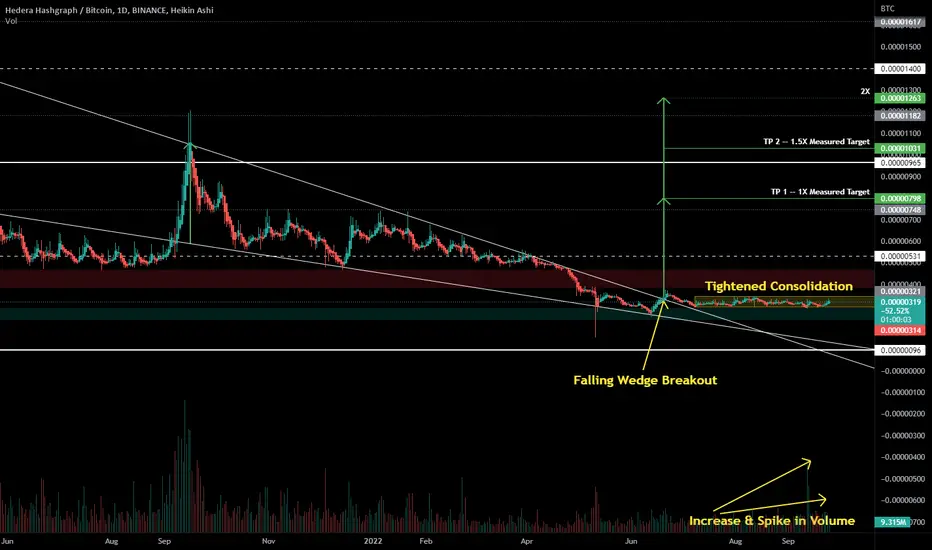
Signs of an Impending Move for Hedera vs. BitcoinAround June 19th, we broke out of a daily falling wedge (shown above), and again around end of July we broke out of a weekly falling wedge (not shown). Since then Hedera has started a pattern of consolidation within a very tight range, just above support, and below resistance. Measured wedge targets take us right at previous ATH (candle close), and a more liberal 2X target takes us above our all-time highest wick.
Each of these provide confluence that Hedera is gearing up for a move.
So, look for us to break out of the small range that we've been in for the last several weeks.
And, even if that becomes a break below the consolidation range before it breaks above, it could still act as a fulcrum for pivoting to a significant move up.
What we don't want to see is a loss of support (green box) that holds.
HBAR to Make Major Moves vs. ETHBroke out of two falling wedges. Measured targets for the smaller wedge line up closely with the first measured target for the larger wedge. Fib levels also show confluence with these levels.
HBAR charts vs. USD and BTC pairs are linked below under Links to Related Ideas

HBar under $0.18 is a bargainHBar is likely to move up to test higher price levels soon, we have a high likelihood of testing the 0.236 during during indicated zones.

Hedera HBAR updateIF HBAR makes contact with the 0.236 fib retracement zone at $0.18 during 2022 we could see price for HBAR soar above $0.30 by mid 2023

HBAR Ready to Rise for the 3rd TimeHBAR broke out of a falling wedge on its weekly chart a couple of months ago. It has since held above weekly support, and well above the wedge. If there is another dip prior to continuation, I could see it test the top of the wedge, near the bottom of support. However, if we lose support and close below the top of the wedge, this idea becomes invalidated.
Measured targets / fib levels:
-- TP 1 - 599-605 sats
-- TP 2 - 734-744 sats
Some confluence to support this idea:
-- Chart VWAP, with the full chart in view, wants average price to be near the top of the resistance area shown.
-- Zooming in to view the falling wedge moves the chart VWAP to line up with TP 1 as well (see chart snapshot below).
-- TP 1 lines up closely with our 0.618 fib (within 6 sats), where fibs are based on the previous move from trough to peak.
-- TP 2 also lines up closely with our 0.786 fib (within 10 sats)
-- RSI has bottomed out, slightly higher than our previous bottom, and it shows similar movement to the last two moves from bottom, theorizing that each in a series of 3 (assuming we've begun our 3rd move) has a consolidation period that begins closer to its initial impulse, and consolidates for a longer period each time.
-- Stoch RSI has also bottomed out and then reached top, also showing similar movement, and also theorizing that each in a series of 3 (again, assuming our 3rd move has begun) has a longer consolidation period between peak 1 and 2.
Zoomed in view of falling wedge and Chart VWAP lining up with TP 1:
Thanks for hearing my thoughts, please leave your own in the comments below. If this move does play out, I think it'll become highly likely that we see a new ATH before seeing any long-term bearish movement again. There is a linked idea for the HBAR/USD pair below under Link to Related Ideas, or here:
-dudebruh

HBAR - Top Is In AugustThe TOP will likely be in August.
For now, the levels I've identified as possible reversals are 0.089 and 0.109.
Good luck

HBAR $2.50 (£2.06) BY 2025/2026!- As we can see hbar did really well in the 2021 bullrun!
- 4,000% increase in 2021!
- If HBAR was to do another 4,000% increase by 2026 then we could see £2-3 HBAR
- POTENTIAL 30-45 X
- NOT FINANCIAL ADVICE!

Potential BreakoutHBAR is inside a channel and besides the hidden bearish divergence looks like it could breakout. I don't see any edge to go long here, but I will be keeping an eye on Hedera because the weekly chart looks great here.

HBAR - Longterm View!Hello Kucoin S Family / Fellow Traders. This is Richard, as known as theSignalyst.
WEEKLY: Left Chart
HBAR is approaching a strong support and demand zone so we will be looking for buy setups on lower timeframes.
H4: Right Chart
HBAR formed a valid double bottom. For the bulls to take over, we need a break above the necklinemarked in gray.
Trigger => Waiting for a momentum candle close above the last high in gray to buy.
Meanwhile, until the buy is activated, HBAR can still trade lower inside the blue demand zone .
Always follow your trading plan regarding entry, risk management, and trade management.
Good luck!
All Strategies Are Good; If Managed Properly!
~Rich

HBAR - Possible Expanded Flat Correction HereHBAR dropped a bit lower than the typical expanded flat target @ 1.618 of its trend-based fib (which is around 9 cents as shown, and where I initially drew the green arrowed line for our reversal). Instead, we fell a bit lower to strong support at the area of the green box around 5-6 cents, but also held the daily and weekly trends. Weekly was nearly lost but was quickly reclaimed.
We also have strong bull divs showing on most of the major indicators, and OBV (not shown) has continued to rise throughout the downtrend, plus our 50 weekly MA wants price to break back above the daily trend and get us back to an area around 24 cents. Good confluence from indicators here on a lot of different fronts.
With all this in mind, if we can first break and hold above our weekly, and then daily trends, I'd suggest we're in a full fledged reversal and may see the expanded flat correction play out, taking us to a new ATH. Keep in mind this may take some time to come to fruition (months, not days or weeks), but we should start seeing signs of the reversal fairly soon if we continue to hold support at the green box.
It is still possible that we drop all the way down to 3 cents before reversing, should support not hold, but that could still keep everything above in play as long as we don't lose the weekly/daily trend bottoms w/out quickly reclaiming them again.
Here was my original post, prior to moving lower towards support:
