EURUSD - The Forex GambitOver the last few months, I have come up with a mathematical system to maintain control of the points that matter with different hedge techniques. Little Late getting the chart made and posted, and been away for a while deep in R&D. Now I trade from the end to the start with reverse engineering, and mathematical balance.... I'll demonstrate
Current set up was structured to go short, and just continue the range but the end of the week had a clean break from the range. Additional positions have been put on at the top for price to come back to break even on position spread, just at the retest area for the range that we've been working in for the last month.
Overall, looking at a long bias, very strong break out Friday clearing the old highs that breached the range before, and looking at the bottoms, there is a gradual build of Long side Pressure. The range is about 90 pips wide, so should the price work back into the area, I will have to monitor the E 1 point to see if it looks to hold, otherwise I'll wait for E2 to cut the sell hedge I'll have below the target for the shorts at S1.
An equal Buy Stop order is in place, and it has 2 use cases, one now, one later.
Should it get hit as is, no problem, still closing the sells around the key area around the breakout support and resistance, and will add in 0.04 lots at that level. Then Hold and trail with sell stop up past breakeven for an upwards push to the next level at the top of the path arrow.
Should it not be hit, the sell hedge will continue down until it does get hit, sell targets still will not change, and the position will be holding a surplus, I'll make a decision thne to cut or hold.
Should the target get reached, sells will all close, hedge will be removed, and 0.04 will be entered for long at the major level...
Either way it wants to go, looking for a target/Long Side entry at around 1.062-1.063 on a basic retest entry and then look for the next level pat the high of the breakout for the target on this one, with additional add in on the way to compound in to a max size gradually. A sell hedge will be placed around 1.059, and wait for E 1 or 2 if things don't leave upwards on the demand zone created by the breakout level and just above in the small consolidation just before the big push. Experience tells me 1.062 will happen though, and E 1 could end up being a spring type move to fake short then turn, because the pattern shows a lot of upside strength over the month of October being built in all month.
Currently holding .1 in total short, and only -$19 off the starting balance, with the hedge buy stop making the lockout around -$29 (First attempt being open ended to try and gain back some of the positional spreads).
I almost want the hedge hit (and I would say 90% sure it will be in a liquidity run here soon) so I get my margin back to place at 1.062, but very minimal risk at the current time if I am not able to trail it down any still.
Most Likely outcome is a bounce to return long from the lower 1.06 range, and the trade management will work towards that Idea, as this long term action typically does result in some sort of retest, let's see how much it comes back, but I do believe it will be doing that from the current level of 1.073, or close by as price does seem a little exhausted from the end of the week momentum.
The main reason is just a simple market commonality of "Quick gains given are quickly taken back", then it goes where it was going again usually....
Hedging

Key Hedging LevelI'm watching this key level in USDJPY. This is potentially a good hedging level, but the interest rate differential is still high, in the long direction, so I'm going to be cautious and not stay in positions for too long because it could head higher.
Not advice, do your own research.

New Year with GazpromGazprom is always a good hedging opportunity. We are looking forward to develop a strategy to hedge risks with this stock to invest in their peers and relatives for the balanced stock portfolio. Our favourite volatility indicators show quite harbour for the Gazprom Stock and ask for help about whether Gazprom will or will not be outrun Company to develop a good risk/opportunity profile to win the Santa-Claus Rally 2023. Wee see Gazprom Stock in the corridor of 189,7 Rubles as upper case and 150,6 as a lower cage. We wish you happy holidays and a good deed.

Myth-busting: top 6 misconceptions about commoditiesWisdomTree has long-standing expertise in commodities, and this asset class constitutes a core part of our business. We aim to debunk several myths that surround commodity investing1.
Myth 1: Commodities are only a tactical instrument
Some believe that commodities trade in a range and do not outperform over the long term. Furthermore, they think commodities only outperform in an ‘up’ phase of a commodity ‘super-cycle’.
Physical commodities are the fundamental building blocks of our society. Therefore, it is no surprise that their price movements largely explain inflation and tend to at least match inflation over the long term.
Furthermore, commodity investors most often invest in futures contracts, not physical commodities. Futures contracts have been designed as hedging tools to allow commodity producers and miners to hedge their production forward, making their businesses sustainable and allowing them to invest because they are insulated from the commodity prices’ short-term volatility.
Producers are willing to pay for this hedge, just as they would pay for insurance. Therefore, investors who provide this hedge by buying futures contracts receive an insurance premium that allows them to beat inflation over the long term. This ‘insurance’ is a permanent feature of commodity futures and doesn’t fall away through economic cycles. Thus, commodity futures are suitable for consideration as a strategic investment, not just tactical investments.
Commodities futures provide a positive risk premium, driven by their intrinsic link to inflation and embedded ‘insurance premium’. While upward phases of commodities’ super-cycle are historically advantageous for commodity investors, future-based broad commodity investments can deliver a risk premium in any part of a super-cycle.
Myth 2: Losses are guaranteed when commodities are in contango
Contango (negative roll yield) and backwardation (positive roll yield)2 are used to describe the state of the futures curve. It describes the relative position of the current spot price and the futures contract price. Drivers of roll yield include storage costs, financing costs, and convenience yield. Backwardation is often associated with demand strength when people are willing to pay more for immediate delivery than lock into a contract for later delivery at a cheaper price. Some believe that, because contango is the opposite state of backwardation, losses are guaranteed as a corollary.
The fact that Keynes’ theory is called ‘normal backwardation’ has caused some terminology confusion. However, what is described by Keynes is that futures contracts are generally priced at a discount to the expected spot price at expiry. It has nothing to do with the current spot price. In other words, the curve can be in contango, and the future price can still be at a discount to the expected spot price at maturity, that is, be in normal backwardation as well.
Using a numerical example, let’s say that WTI Crude Oil is worth $50 today. The market expects WTI Oil to trade at $55 in a month (expected spot price) because of storage and other costs. Keynes’ theory hypothesis is that the 1-month futures contract will be priced at a discount to $55, let’s say $54, to incentivise speculators to provide the hedge to producers. In this situation, the curve is in contango ($54>$50), and the expected risk premium is still positive at $1.
So, a curve in contango and a positive risk premium can coexist.
While the shape of the curve has an impact on the performance, it is not a good predictor of future performance.
Myth 3: Commodities are riskier and more volatile than equities.
There is a common perception that commodities are riskier than equities.
Equities and commodities are similar asset classes statistically. Their historic returns and volatility are quite close. Historically, commodities have exhibited higher volatility than equities in 42% of the 3Y periods since 1960. However, in a larger number of periods (58%) equities have shown higher volatility.
More importantly, the two assets’ distributions differ from a normal distribution with a significantly higher skew. But commodities have the advantage. They exhibit a positive skew (a tendency for higher-than-expected positive returns), when equities are known for their negative skew (their tendency to surprise on the downside).
Commodities have exhibited lower volatility than equities in 58% of the time rolling 3-year periods we studied and benefit from positive skew.
Myth 4: Commodities stopped being an effective diversifier after the 2008 Global Financial Crisis presented a structural break in commodity price relationships
Markets are becoming more and more efficient. With those changes, assets have become more correlated. It is clear that commodities have been more correlated to equities in the last 10-20 years than before. However, this is true of most asset pairs as well. US equities are more correlated to global equities. Equities are more correlated to high yield bonds. In a globalised world where correlations are more elevated, commodities still stand out for their lower level of correlation.
Note, commodities have continued to provide a cushion against equity and other asset crises in recent periods. For example, in 2022, commodities rose 16%, while US equities3 fell 18% and bonds4 fell 16%.
While 2008 marked an all-time high for the correlation between equities and commodities, their correlation has always oscillated. There have been earlier spikes of similar magnitude in the 1960s and 1980s. In 2020, we saw a similar spike in correlation, but correlations have more than halved since in 2023.
Commodity vs equity correlation tends to oscillate and has remained within normal historical ranges.
Myth 5: Inflation linked bonds are better than commodities at inflation-hedging
Some assets are often considered good inflation hedges, such as inflation-linked bonds (TIPS) or real estate. However, it is surprising that more people don’t recognise the superior inflation-hedging properties of commodities.
The beta to inflation (US Consumer Price Index (CPI)) of inflation-linked bonds and real estate, historically, is significantly lower than that of commodities (2.45): US TIPS (0), US Equity Real Estate Sector (1), House Prices (0.4). Furthermore, while broad commodities’ average monthly performance tends to increase when the CPI increases, this is not the case for other assets. The performance of TIPS appears to be relatively unrelated to the level of CPI. The performance of real estate, being equities or real assets, seems to worsen when the CPI increases.
Real estate suffers from the fact that, while rental incomes are linked to inflation (rents are part of the CPI basket, for example), the capital values themselves are not, and yet have a larger impact on the asset's price. Similarly, inflation-linked bonds are linked to inflation, but their price is also tied to real yields changes (through a duration multiplier) which tends to dilute the relationship to inflation itself.
Historically, commodities have been a better hedge to inflation than TIPS or real estate assets.
Myth 6: Futures are the best way to access gold for institutional investors
Futures markets tend to be extremely liquid and offer very low transaction costs. Therefore, investors assume that, if they can, it is always the most efficient way to implement a trade.
However, futures markets respond to their own constraints where banks tend to provide most of the hedging. Recently, banks have suffered from increasing regulation and operating costs that they have translated into their pricing of futures contracts, leading to significant tracking differences with the physical asset. Sometimes futures contracts are the only way to access a commodity, but for precious metals this is not the case.
For gold, this cost has, historically, represented 0.9%6 per year on average compared to owning gold bullion. Physically backed exchange-traded commodities (ETCs) have many advantages: limited operational burden, reduced tracking difference, cheap and liquid.
It is clear that commodities are a frequently misunderstood asset class, and many misconceptions remain today. For a fuller description of the fundamentals of commodity investing, please see The Case for Investing in Broad Commodities.
Sources
1 These myths were all addressed in The Case for Investing in Broad Commodities, November 2021, which takes a deep dive into commodity investing. This blog summarises and updates data addressing several of the ‘misconceptions’ listed in the piece.
2 For more information on contango and backwardation, see our educational ETPedia hub (specifically the ‘Costs and Performance’ tab).
3 S&P 500 TR.
4 Bloomberg GlobalAgg Index (government, corporate and securitised bonds, multicurrency across developed and emerging markets).
5 Source: WisdomTree, Bloomberg, S&P, Kenneth French Data Library. From January 1960 to July 2023. Calculations are based on monthly returns in USD. Broad commodities (Bloomberg commodity total return index) data started in Jan 1960. US TIPS (Bloomberg US Treasury Inflation-linked total return bond index – Series L index) data started in March 1997. US Equity Real Estate (S&P 500 Real Estate sector total return index) data started in October 2001. US House Price (S&P Corelogic Case-Schiller US National Home Price seasonally adjusted index) data started in January 1987. Historical performance is not an indication of future performance and any investments may go down in value
6 Source: WisdomTree, Bloomberg. From 4 June 2007 to 31 July 2023. The Performance of the physical Gold was observed at 1.30 PM Eastern Time to match the BCOM sub-index calculation time. You cannot invest in an Index. Historical performance is not an indication of future performance and any investments may go down in value.
This material is prepared by WisdomTree and its affiliates and is not intended to be relied upon as a forecast, research or investment advice, and is not a recommendation, offer or solicitation to buy or sell any securities or to adopt any investment strategy. The opinions expressed are as of the date of production and may change as subsequent conditions vary. The information and opinions contained in this material are derived from proprietary and non-proprietary sources. As such, no warranty of accuracy or reliability is given and no responsibility arising in any other way for errors and omissions (including responsibility to any person by reason of negligence) is accepted by WisdomTree, nor any affiliate, nor any of their officers, employees or agents. Reliance upon information in this material is at the sole discretion of the reader. Past performance is not a reliable indicator of future performance.

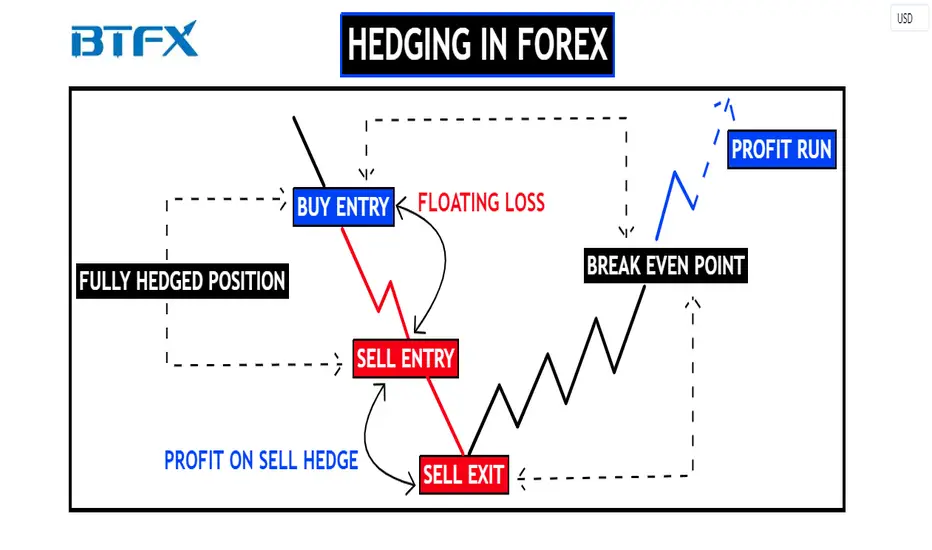
Hedging in Forex
When done correctly, hedging is a great method to help protect your position(s) against big price fluctuations. This post will delve further into hedging and discuss how you can use it to not only protect your position(s) but also how to potentially use it to your advantage in turning losing positions into profit-taking opportunities.
What is hedging in Forex?
Hedging implies protection against the risk of future price fluctuations for assets arranged in advance. It is a financial strategy used to protect a trader from losing trades resulting from adverse moves in currency pairs. Hedging is used in almost all types of financial industries; however, it has a more specific form in the foreign exchange market.
Direct Hedging
Direct hedging in forex normally takes place by the trader opening a position in the opposite direction of an existing trade. This is done in order to reduce the risk exposure of the existing position. Normally, the trader or investor carries out his or her risk analysis and quantifies the risk levels involved before instituting both the original and hedged trades. They would subsequently be responsible for controlling the level of change in their positions that takes place due to the ensuing price volatility of the market instrument(s) being traded.
For example, let's assume you open a sell position on GBPUSD, and while your position is running, the market suddenly goes up, so now your open P&L (profit and loss) number is going down. Let's continue to assume that you are still confident in the original sell position; however, you are wary that the market is likely to experience adverse price movements. To prepare for this, you open a buy position to fully hedge the trade. In a fully hedged trade, the P&L number will not move because there is both a buy and sell position open. Now that the trade is fully hedged, if the market continues to go up, the trade's buy position will continue to profit while the sell position will continue to take a loss. However, if the market reaches a resistance level, you can exit the buy position at a profit and hold the original sell position while the market comes back to your original entry point. While many traders would close out the initial position and accept any losses, a direct hedge would allow you to profit from the second trade, which would avoid the loss.
To get a further understanding, let's see this in the example below.
Hedging with multiple currencies
Another strategy would be for a trader to utilise two different currency pairs that are highly correlated, either in a positive sense or a negative sense. For example, a long trade can be opened for the USDJPY currency pair, and a short trade can be opened for its USDCHF counterpart. Because it is highly likely that both pairs move in the same direction due to the USD factor, any drawdown or loss on one of the trades would be made up for by gains and profits in the other trade.
Though the risk is usually mitigated with this hedging strategy, for this method to work successfully with different currency pairs, it is essential that the trader does his or her research on both pairs involved in the potential hedge to ensure that the correlation is high between them through their respective movements in the market. This is to guarantee that when market volatility does ensue, whether it is based on a news update such as a major central bank meeting or some other unexpected event, then the two current pairs in question will move as expected in the market.
Hedging with commodities
Commodities are popular to hedge with because they are usually seen as safe haven products.
Gold is usually the go-to product hedge for traders who especially want to protect themselves from rising inflation. When inflation becomes uncontrollable, gold prices tend to rise. Gold, in contrast, is a hedge against a lower US currency. In other words, gold prices and the US dollar tend to have an opposite relationship. When gold prices rise, the US dollar tends to fall, and vice versa. Gold has long been seen as a form of currency, which is why it's a strong hedge against a dollar crash or hyperinflation.
Another popular commodity to hedge with is oil. Some currencies are particularly vulnerable to the impact of oil prices (these forex pairs are commonly known as 'commodity pairs'). Both the Canadian dollar and the Australian dollar are notable examples. The price of oil and the exchange values of the Canadian dollar and Australian dollar usually have an inverse relationship. When the price of oil rises, the USD/CAD and AUD/USD exchange rates tend to fall, and vice versa.
You can use the oil hedging approach to hedge your USD/CAD and AUD/USD trade risk in this scenario. For example, you can go short AUD/USD and long oil as a hedging position, and vice versa.
Advantages and Disadvantages
There are significant advantages and disadvantages to engaging in hedging activities in forex:
Advantages
The biggest advantage is that it protects the trader against unpredictable price movements. If your account experiences high volatility or unexpected price swings, your hedged position may be able to help protect the total worth of your account by generating a profit on that position, which can help stabilise your account balance until the other position gains value. In other words, hedging gives the opportunity to profit on a position that would maintain the account balance during a volatile or unexpected price swing before a reversal takes place, leading to other positions going back to their original value.
When hedging is incorporated properly, your risk-reward ratio is better within your control. This is because a hedge acts as a helpful counterbalance to your other position(s), thus providing support in the form of price gains even when your other position(s) are moving in the opposite direction.
Hedging can broaden your portfolio's diversification. If you are hedging multiple products, this can spread out your open positions to reduce the chance of a single variable or event wiping out all of your positions.
Disadvantages
On the other hand, a hedge can also very likely reduce the potential for profit. If a trader has an open position in profit and the price continues to move in a certain direction after the trader implements a hedged trade in the opposite direction, then the hedged trade would be at a loss, nullifying the gains made by the original trade after the hedged trade was opened. Additionally, traders must be aware of additional trading costs such as commissions and overnight swap charges (if the hedge is held overnight).
To add, hedging is not an ideal practice for beginners in trading, as it requires the proper practice and education needed to handle opposing trades at the same time in what could be an unfamiliar market, reflecting both the numerical and positional complexities of the hedging mechanic. There is also the risk of hedging, resulting in increased losses to the trader's account due to some hedged trades not being correlated directly to initial positions; this could be because of leverage, margin, or other reasons. This has the potential for huge drawdowns in the overall position when price volatility ensues.
Another disadvantage is that, unfortunately, not all forex brokers or trading providers offer the hedging function to their traders, so traders will usually have to inquire if this function is possible before proceeding to trade with the respective broker or provider.
While you can make money from hedging, it is very important to note that before that, forex hedging should first be about mitigating risks. A trader's primary aim when hedging should always be to protect their capital against adverse moves in the currency markets. Hedging can also be very complex and costly, especially if the trader does not have much experience with this trading method, so it is not recommended to use this method in a live trading environment until you understand the mechanics of hedging, as it requires a great deal of planning and understanding.
BluetonaFX
NEW YORK SUGAR still showing bullish tendencyNEW YORK SUGAR continues performing as anticipated. After the completion of the wave 4 correction, the market resumed rally to complete the wave 5 of the same degree.

AMRX Post Earnings High Flyer - a hedge tradefor the next phase of the price action - the details are on the chart. Please comment
if you would like further details.

Harvesting Risk Hedged Treasury YieldEver heard of risk-free rates? Risk free rates are commonly understood to refer to interest rates on 10-year US treasuries. These are considered risk-free as the likelihood of the US government defaulting is considered extremely unlikely.
Treasuries pay out a fixed interest and can be redeemed for their face value at maturity. Fixed returns and negligible default risk make treasuries a critical addition to any decent investment portfolio.
With inflation on the downtrend and Fed’s hiking cycle nearing its apex, long term treasuries provide a fixed income-generating asset with no reinvestment risk.
Little default risk does not mean zero market risk. As highlighted in our previous paper , bond prices are materially exposed to interest rate risk. CME Group’s treasury futures allow investors to hedge that risk.
This paper has been split into two parts – the first provides an overview of treasury futures and their nuances while the second walks through the trade setup required to harness risk-hedged yield.
TREASURY FUTURES
Treasury futures enable investors to express views on a bond’s future price movement. Investors can also hedge against interest rate risk by locking in a coupon rate. CME treasury futures are deliverable with eligible treasury securities which ensures price integrity.
QUOTING
Treasuries are quoted in fractional notation as a percent of their par value. For instance, a bond quoted at 111’272 suggests that it is trading 11 + 27.2/32 (11.85%) above its par value. This allows standardized quotation of bonds with different coupon rates.
Note that notion of quotes in cash markets may be different from futures.
AUCTION SCHEDULE
Treasuries are auctioned periodically depending on their maturity duration.
• Treasury Bills with maturity between 4 to 26 weeks are auctioned every week while T-Bills with maturity of 1-year are auctioned every four weeks.
• Treasury Notes with maturity of 2, 3, 5, and 7 years are auctioned every month while T-Notes with maturity of 10-years are auctioned every quarter.
• Treasury Bonds are auctioned every quarter.
The auctions for each type of security are staggered to reduce their market impact.
CONVERSION FACTOR
It is possible for a large range of “eligible” treasuries to be available for deliveries against standardised futures contract as new treasuries are regularly auctioned at changing rates. The most recently auctioned securities that are eligible for delivery are called “on the run” securities.
To standardize the delivery process for varying securities, a conversion factor unique to each bond is used. The buyer of the futures contract would pay the Principal Invoice Price to the seller. The Principal Invoice Price is the “Clean Price” of the security and is calculated by applying the Conversion Factor to the settlement price.
When the Conversion Factor is less than 1, the buyer pays less than the settlement price and when it is higher than 1 the buyer pays more.
ACCRUED INTEREST
In addition to the adjustment for the quality of the bond being delivered, the buyer must also compensate the seller for any interest the bond would accrue between the last payment and the settlement date.
The final cost to deliver the treasury futures contract would be the Clean Price + Accrued Interest.
CHEAPEST TO DELIVER
Due to the Conversion Factor, which is unique to each bond, some bonds appear to stand out as cheaper alternative for the seller to deliver. So, if a seller has multiple treasury securities, a rational seller will choose to deliver the one that best optimizes the Principal Invoice Price.
As a result, futures price most closely tracks the Cheapest-to-Deliver ("CTD”) securities.
This also provides an arbitrage opportunity for basis traders. In this case, the basis is the relationship between the cash price of the security and its clean price on the futures market. Small discrepancies in these may be profited upon.
Notably, specialized contracts such as CME Ultra 10-year Treasury Note futures with selective eligibility requirements diminish the effects of CTD by reducing the range of deliverable treasuries.
HEDGING BOND PRICE RISK WITH TREASURY FUTURES
Treasury securities are a crucial and substantial addition to any well diversified portfolio, offering income generation, diversification, and safety.
With interest rates elevated and inflation heading lower, coupon rates for long-term US treasuries are yielding positive real returns. Moreover, 10Y yield is hovering at its highest level in 13-years suggesting a strong entry point.
Since the coupon rate of the security is fixed and they can be redeemed at face value upon maturity, the present higher yielding treasuries are a great long-term income generating investment.
Despite the inverted yield curve, which suggests yields on longer-term securities are lower, a position in long-term bonds protects against reinvestment risk. Reinvestment risk refers to the risk that when the bond matures, rates may be lower.
With Fed at the apex of its hiking cycle, rates will likely not go any higher. So, a position in long term T-bond, locked in at the current decade-high rates, offers a lucrative opportunity. The position also benefits in the uncertain scenario of a recession as bond prices rise during recessions.
This investment fundamentally represents a long treasury bond position which profits in two ways: (a) Rising bond prices when interest rates decline, and (b) Coupon payments.
If the coupon payout is unimportant, fluctuations in the bond price can be profited upon in a margin efficient manner using CME futures. This does not require owning treasuries as the majority of the treasury futures are cash settled with just 5% reaching delivery.
In the fixed income case, the bond is held until maturity which leads to opportunity costs from bond price fluctuations.
CME futures can be used to harvest a fixed yield from treasuries and remain agnostic to rate changes, by hedging the long treasury position with a short treasury futures position.
This position is directionally neutral as losses on one of the legs are offset by profits on the other. The payoff can be improved by entering the short leg after bond prices are higher.
To hedge treasury exposure using CME futures the Basis Point Value (BPV) needs to be calculated. BPV, also known as DV01, measures the dollar value of a one basis point (0.01%) change in bond yield. BPV depends upon the bond’s yield to maturity, coupon rate, credit rating and face value.
Notably, BPV for longer maturity bonds is higher as their future cashflows are affected more by changes in yield.
Another commonly used term is modified duration which determines the changes in a bond’s duration or price basis of a 1% change in yield. Importantly, the modified duration of the bond is lower than 100 BPV’s since the bond price relationship to yield is non-linear.
BPV can be calculated by averaging the absolute change in the bond’s yield-to-maturity, its value when held until maturity, from a 0.01% increase and decrease in yield. Where there are multiple bonds in a portfolio, the BPV for a unit exposure will have to be multiplied by the number of units.
On the futures side, BPV can be calculated as the BPV of the cheapest to deliver security for that contract divided by its conversion factor.
By matching the BPV’s on both legs, the hedge ratio can be calculated. This represents the number of contracts needed to entirely hedge the cash position.
SUMMARY OVERVIEW OF CME TREASURY FUTURES
CME suite of treasury futures allow investors to gain exposure to treasury securities across a range of expiries in a deeply liquid market.
Each futures contract provides exposure to face value of USD 100,000.
The 2-Year, 5-Year, and 10-Year contract are particularly liquid.
Micro Treasury Futures are more intuitive as they are quoted in yields and are cash settled. Each basis point change in yield represents a USD 10 change in notional value.
These products reference yields of on-the-run treasuries and settled daily to BrokerTec US Treasury benchmarks ensuring price integrity and consistency.
Micro Treasury Futures are available for 2Y, 5Y, 10Y, and 30Y maturities enabling traders to take positions across the yield curve with low margin requirements.
TRADE SETUP TO HARVEST RISK HEDGED TREASURY YIELDS
A long position in the on-the-run 10Y treasury notes and a short position in CME Ultra 10Y futures allows investors to benefit from the treasury bond’s high coupon payment while remaining hedged against interest rate risk.
Hedge ratios can be calculated using analytical information from CME’s Treasury Analytics Tool to obtain the BPV of each of the legs:
The on-the-run treasury pays a coupon rate of 3.375% pa. and its last quoted cash price was USD 98.04. It has a DV01 of USD 76.8.
Since, each contract of CME Treasury Futures represents face value of USD 100,000, the long-treasury position would need to be in multiples of USD 100,000.
For a face value of USD 500,000 (USD 100,000 x 5) this represents a notional value of USD 490,000 (Face Value x Cash Price) .
The long-treasury position's DV01 = USD 76.8 x 5 = USD 385.
The cheapest-to-deliver security has a DV01 of USD 92.2 and a conversion factor of 0.8244.
The futures leg thus has a BPV = Cash DV01/Conversion Factor = USD 92.2/0.8244 = USD 111.8.
The hedge ratio = BPV of Long Treasury/BPV of Short Futures = USD 385/USD 111 = ~4 (3.4)
So, four (4) lots of futures would be required to hedge the cash position which would require a margin of USD 2,800 x 4 = USD 11,200.
Though the notional on the two legs does not match, the position is hedged against interest rate risk and pays out 3.375% per annum in coupon payments.
MARKET DATA
CME Real-time Market Data helps identify trading set-ups and express market views better. If you have futures in your trading portfolio, you can check out on CME Group data plans available that suit your trading needs www.tradingview.com
DISCLAIMER
This case study is for educational purposes only and does not constitute investment recommendations or advice. Nor are they used to promote any specific products, or services.
Trading or investment ideas cited here are for illustration only, as an integral part of a case study to demonstrate the fundamental concepts in risk management or trading under the market scenarios being discussed. Please read the FULL DISCLAIMER the link to which is provided in our profile description.

EURJPY Grid Hedging 60 Pips (Type A)0.02 lot size.
I am applying Grid Hedging (Type A) trading management to EURJPY.
I will enter buy and sell trades. Close trade when the trade is in 60 pips profit and open another 2 buy and sell trades.
(Exit A) When buy trades more than sell trades, if last buy trade is 60 pips profit, I will close all trades.
(Exit B) When sell trades more than buy trades, if last sell trade is 60 pips profit, I will close all trades.
(Exit C) I will close all trades when total profit/loss of opened and closed trades has hit $72.

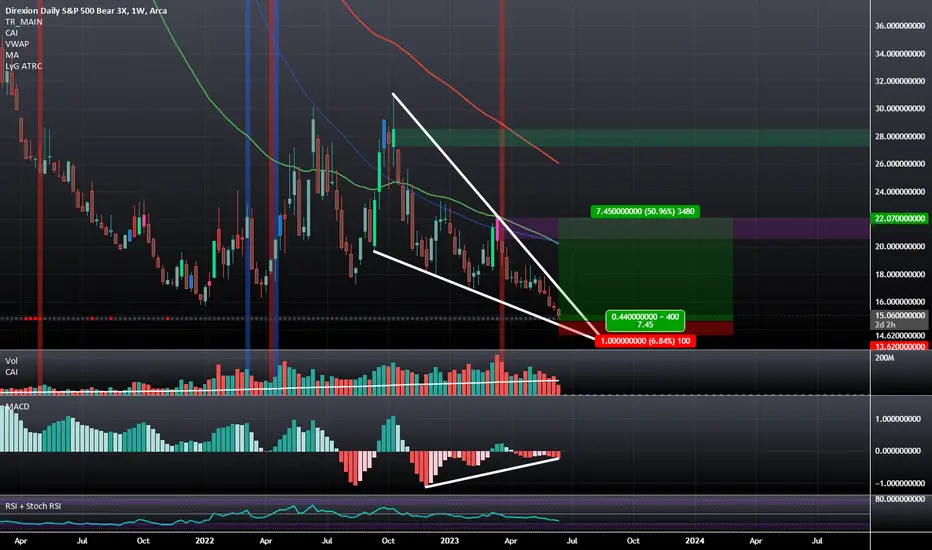
SPX 3x Short ETF Hedge PlayThe SPX looks like it is ready to give us a moderate pullback so I will be playing this via multi-week call options on this 3x-Short SPX Bear ETF
CHFJPY Grid Hedging 50 Pips (Type A)0.02 lot size.
I am applying Grid Hedging (Type A) trading management to CHFJPY.
I will enter buy and sell trades. Close trade when the trade is in 50 pips profit and open another 2 buy and sell trades.
(Exit A) When buy trades more than sell trades, if last buy trade is 50 pips profit, I will close all trades.
(Exit B) When sell trades more than buy trades, if last sell trade is 50 pips profit, I will close all trades.
(Exit C) I will close all trades when total profit/loss of opened and closed trades has hit $60.

AUDCAD Grid Hedging 40 Pips (Type A)0.02 lot size.
I am applying Grid Hedging (Type A) trading management to AUDCAD.
I will enter buy and sell trades. Close trade when the trade is in 40 pips profit and open another 2 buy and sell trades.
When buy trades more than sell trades, if last buy trade is 40 pips profit, I will close all trades.
When sell trades more than buy trades, if last sell trade is 40 pips profit, I will close all trades.
I will close all trades when total profit/loss of opened and closed trades has hit $48.

NZDCAD Grid Hedging 50 Pips (Type A)0.02 lot size.
I am applying Grid Hedging (Type A) trading management to NZDCAD.
I will enter buy and sell trades. Close trade when the trade is in 50 pips profit and open another 2 buy and sell trades.
When buy trades more than sell trades, if last buy trade is 50 pips profit, I will close all trades.
When sell trades more than buy trades, if last sell trade is 50 pips profit, I will close all trades.
I will close all trades when total profit/loss of opened and closed trades has hit $60.

Preserving Your Capital Like A ChampIn the world of trading, effective trading capital management can mean the difference between success and failure. We cannot stress enough how critical this aspect is to long-term success. Today we will delve into the importance of managing your trading capital, the various strategies employed by many successful traders, and how you can implement these techniques to safeguard your investment and maximize profits.
Understanding the Importance of Trading Capital Management
Trading capital refers to the amount of money allotted for the purpose of trading your desired market. Proper management of trading capital is crucial for traders, as it helps them minimize losses and in turn, maximize profits. In essence, trading capital management is all about striking the right balance between taking risks and preserving your hard-earned money.
One key aspect that differentiates successful traders from gamblers is their mindset. Gamblers tend to chase big wins, hoping for a life-changing payout, while traders focus on consistently generating small, predictable returns over the long term. Don’t get us wrong, big wins can and do happen, and they feel great when they do. Think of trading as a really long boxing match. It's rare and impractical for a boxer to believe they can knock out their opponent by flying out of a corner with no defense and going straight for a haymaker each time. The foundation for success takes many consistent jabs, and an unwavering defense, much like trading. Traders who want to be long-term successful will prioritize risk management and capital preservation, ensuring that they can continue trading even after incurring losses so they can pursue consistent profits.
The Struggle is Real For New Traders
New traders often find difficulty in managing their trading capital effectively. This is primarily due to their focus on making profits rather than minimizing risks. The desire to make money can lead to taking unnecessary risks, which can result in significant losses. It is crucial to remember that every loss must be recovered through a profitable trade to regain lost ground. So why not implement strategies that mitigate that lost ground in the first place?
Strategies To Adopt for Long-Term Success
So, what are some of the techniques that successful traders use to optimize their chances of consistent profits in the markets? Here are a few suggestions to improve your trading capital management:
Implementing Stop-Loss Orders
Always trade with a stop-loss. There are countless ways to implement a stop-loss, and we covered this in great detail in a previous article that is linked below. A stop-loss order allows you to specify a price at which your trade will be automatically closed if the market moves against you. This is the most practical and easily enactable capital management technique you can use. Some would consider trading without a stop-loss to be one of the cardinal sins of trading, as it prevents you from managing risk effectively.
Utilizing Reward Risk Ratios (RRR)
Every trade carries the risk of making a loss. Successful traders assess their potential trade risk and potential reward before entering a position. Utilizing reward-to-risk ratios may seem complicated, but it doesn't have to be. Many traders will often aim for a reward that is twice their risk or a ratio of 2 to 1. So in theory for every $1 you risk you aim to make $2 in profit. Your RRR can also help you understand what your theoretical minimum win rate would need to be a profitable trader.
Utilizing this information is very handy when backtesting and forward-testing your strategy. In the early stages of a trader's journey, we highly recommend to keep a trading journal to keep track of these metrics. Keeping track of your wins and losses and keeping your RRR consistent offers deep insight into whether you are on the right path to consistency.
Managing Your Money
How much capital are you risking per trade? It's difficult to predict which trades will be profitable, but it's essential to risk a consistent amount on every trade. Coupled with an appropriate risk-to-reward ratio, this approach can help protect your trading account. For example, consider risking only 1-2% of your total trading portfolio on each individual trade with a maximum overall of 10% among your trades. This may not seem like much, but if you can remain disciplined with your stop losses and RRR you greatly increase the odds of success. If you have a small account don’t sweat it. It will help you grow that account size and compound those gains in a stable fashion that would outlast the method of throwing your entire account into each trade.
Hedging
Holding long and short positions on various assets in different sectors can help protect against any aggressive moves that affect the market as a whole. For instance, if there was a sudden 'flash crash,' the traders who solely went long would experience a loss or a potentially significant loss without proper risk mitigation. However, if you held both long and short positions, you could have made profits to offset the losses. Obviously, market events are hard to account for, but hedging can be a useful capital preservation strategy.
Focusing on a Single Asset to Limit Risk Exposure
Some traders prefer to concentrate on trading one asset to minimize risk exposure. This can be effective, especially when the trader has in-depth knowledge of the specific asset being traded. The potential downside is that this can limit your trading opportunities, but we highly advise this approach for new traders. Focusing on one asset can help you grow your experience and hone your strategy through a rigorously disciplined approach.
Consistency in Risk and Money Management
There is no one-size-fits-all approach to trading, and that's part of the beauty of it all. A strategy that works for one trader may not work for another. The key to improving your trading strategy is to adopt a disciplined approach to risk and money management. While this approach may not be as flashy as some in the trading community portray, consistently minimizing risk is an essential aspect of enhancing overall profitability and is a massive attribute to long-term success.
Final Thoughts on Trading Capital Management
Effective trading capital management is crucial for success in the world of trading. By adopting a disciplined approach to risk and money management, traders can minimize losses, maximize profits, and safeguard their investments. The techniques discussed – implementing stop-loss orders, utilizing reward-to-risk ratios, managing money, and diversifying trades – are all essential components of a successful trading capital management strategy.
Remember, the key to success in trading lies not in chasing the knockouts but rather by consistently landing the jabs while maintaining a stout defense. By following these strategies adopted by long-term, successful traders and focusing on preserving capital, you can improve your chances of obtaining that same long-term success in the markets.

Are we approaching the last cycle expansion phase?The last cycle expansion phase or the euphoric stage, has already occurred between 2020 and 2021.
Sir John Templeton said: “Bull markets are born on pessimism, grown on skepticism, mature on optimism, and die on euphoria.”
Reference of Nasdaq:
E-mini Nasdaq-100 & Opt
Minimum fluctuation
0.25 index points = $5.00
Micro E-mini Nasdaq-100 Index & Opt
Minimum fluctuation
0.25 index points = $0.50
Disclaimer:
• What presented here is not a recommendation, please consult your licensed broker.
• Our mission is to create lateral thinking skills for every investor and trader, knowing when to take a calculated risk with market uncertainty and a bolder risk when opportunity arises.
CME Real-time Market Data help identify trading set-ups in real-time and express my market views. If you have futures in your trading portfolio, you can check out on CME Group data plans available that suit your trading needs www.tradingview.com

GBP - Try again to fix the hedgeNo particular plan right now, Just observe the channel and see what breaks.
-If we have a strong run out and up, the hedge buy target becomes a focus, and then match sell from that level.
-If we have a strong run out down, the hedge sell, or breakeven(depending where it break) will be the focus, then match buy from that level.
No targets as of right now, just alerts and observations. Pretty sure I just got suckered by the supply zone break, but, this is where it is now lol. Should've taken the 23 pip loss on the sells yesterday when I had the chance, but tried to hold out for the plan, and didn't think much about flexing at the time from all the stop running and just general chaos in the movements.
This time, I stay flexible!
Neutral, though still feel short is probably the right way, just trying to manage a breakdown of the channel and trade to the goal of getting out of these positions at this point.

JPY TroublesThe Situation-
It was going GREAT.... Until it wasn't...
I mis read the trade, and got it wrong with a bad entry, then another, then another.
I made that entry worse trying to move out of the position at breakeven before close of the week
Managed to recover half of the drawdown amount through scalps, then after some "analysis fatigue" it got a bit worse, so I hedged out to go through the weekend and observe the open for a possible outcome:
The Plan:
I've selected a few levels and target points for few different outcomes, but with an overall short Bias.
Plan A, & Plan A Alternative:
Should price open and move up, I will look to close the buys (3 separate units, Blue Arrows) around Point 2, making a net profit of 84 pips. Point 2 has some support and resistance within a short span of time, so it's a little questionable, but I will be waiting for some rejection before entering a second sell from this level (3 units), as I already have a slightly higher order count than I should have because of some scalps that didn't fully work out, so make sure before entry.
If there is no rejection, or not much rejection, I will re-hedge up to the next level at Point 5, where there looks to be significant resistance. This will also secure another 270 pips (90 x 3 units) of profit if it makes it, otherwise will watch to see if it will reverse before to close premature, but the safest play would be go to the level or close the additional hedge at break even.
I expect the price to likely follow the idea of coming up to Point 2, get some volatility, then drop, clearing the sell trades at breakeven, and then look for a new fresh opportunity.
Plan B:
Price naturally opens down with the trend outlook in play, dropping all the way to Point 1 below at a key level. At that point, I will liquidate the sells for a net gain of roughly 360 Pips (120 x 3 units)
I will then immediately enter a buy sell from this level, Looking to close back above revisiting the level around Point 4 with a pullback. Just above halfway between Point 1 to Point 4, so any natural retracement should be able to clear out the buys near breakeven or small loss, before turning back down. Once the Buys get cleared (Breakeven or slightly better, as I'm expecting price to continue running down fairly quickly (just my experience of the nature of the JPY)
Hedge Protection for any new positions:
Fixed around 25 Pips beyond any buy or sell in the opposite direction, with major levels as targets for new hedges. This will allow enough space for the hedge to benefit the equity in an advantageous way to cover any new positions of correction with boosted free margin, and give plenty of possibility for meeting in the middle of a level quickly to breakout of some positions without much loss, but preferable and most likely for break even for either set of directions, with significant gain if major levels make it into the outcome. Plan B will give the most gain, but I am not looking to force the market, only make a success with what is presented while protecting the account from further mistakes on this trade setup.

GOLD : What Drives the Price of Gold ?OANDA:XAUUSD
Gold is highly sought after, not just for investment purposes and to make jewelry but also for use in the manufacturing of certain electronic and medical devices. As of February 2023, the price of gold was more than $1,870 an ounce. While down around $100 from a high posted in April 2022, it is still up considerably from levels under $100 seen 50 years ago.
But what factors drive the price of this precious metal higher over time ?
KEY TAKEAWAYS
1 Investors have long been enamored by gold, and the price of the metal has increased substantially over the past 50 years.
2 Not only does gold retain additional value, but supply and demand have a huge impact on the price of gold—especially demand from large ETFs.
3 Government vaults and central banks comprise one important source of demand for gold.
4 Gold sometimes moves opposite to the U.S. dollar because the metal is dollar-denominated, making it a hedge against inflation.
5 Supplies of gold are primarily driven by mining production.
Conclusion : Gold Is a high Value Asset , Which Can be Hedge Against Growing Inflation.

Pending Order to the next hoursPending orders in highlighted zones is another way to trade.
Use SL
NFP and unemployment rate will shake de market.... higher than forecasted unemployment rate will trigger alarms about the recession.

Bites Of Trading Knowledge For New TOP Traders #18 (short read)Bites Of Trading Knowledge For New TOP Traders #18
----------------------------------------------------------------
What is the Blockchain? -
The Blockchain is a decentralized ledger that is append-only meaning that data can only be added to it. Once information is added, it is extremely difficult to modify or delete it. The Blockchain enforces this by including a pointer to the previous Block in every subsequent Block.
The pointer is a Hash of the previous block. Hashing involves passing data through a one-way function to produce a unique Fingerprint of the input. If the input is modified even slightly, the Fingerprint will look completely different. Since the Blocks are linked in a Chain, there is no way for someone to edit an old entry without invalidating the Blocks that follow, allowing a secure structure.
What Is a Blockchain Consensus Algorithm? -
A consensus algorithm is a mechanism that allows users or machines to coordinate the agreement of what is a valid block in the Blockchain in a distributed setting. It needs to ensure that all participants in the system can agree on a single source of truth. Types of consensus algorithms include Proof of Work (PoW) and Proof of Stake (PoS).
What is Proof of Work? -
Proof of Work (PoW) is a mechanism for preventing the same bitcoin funds from being spent more than once. Proof of Work consists of a consensus algorithm, which is a protocol that sets out the conditions for what makes a block in the Blockchain valid. It ensures the security and integrity of bitcoin’s distributed ledger.
RISKS AND OPPORTUNITIES FOR CORPORATES AND INDIVIDUAL INVESTORS -
Common application of financial market instruments for managing risk and opportunities.
Hedging Portfolio Risk
Hedging bitcoin exposure with the Bakkt ® Bitcoin (USD) Cash Settled Monthly Futures (BMC) contract is a way to manage portfolio risk by taking a directional position opposite to the underlying asset as protection.
For example, a hedger may have plans to hedge downward price movement in bitcoin using futures contracts based on in-house market and portfolio analytical processes. The market analysis may use common technical analytical techniques such as support and resistance to formulate the trade decision.
If bitcoin is expected to weaken as it nears the resistance area, the hedger may plan to enter into a short futures position using the Bakkt ® Bitcoin (USD) Cash Settled Monthly Futures contract under either price levels of $27,500 or $32,500 to lock in the value of their underlying bitcoin position. Alternatively, if the hedger was in a short bitcoin position and wanted to hedge their position as price rose, entering a long futures position above price levels $12,500 or $16,500 could be considered.
TRADDICTIV · Research Team
--------
Disclaimer:
We do not provide investment advice, nor provide any personalized investment recommendations and/or advice in making a decision to trade. Before you start trading, please make sure you have considered your entire financial situation, including financial commitments and you understand that trading is highly speculative and that you could sustain significant losses.

LAZR Hedged Options StrategyLuminar Technologies, Inc. makes sensor technologies and software for vehicles and is distributed internationally. Laser imaging, detection, ranging sensors, perception and autonomy software are becoming the norm in newer cars. LAZR stock has also made a few headlines this week as a couple of institutions have started or added to their positions, and most analysts have rated it a buy or hold. There's some recent rallying in growth stocks in general. Overall, it seems to be a promising young company making in-demand LiDAR products.
The doubts: Big name analysts (like GS) have cut its target price. Northland downgraded it from outperform to market perform. Fed rate hike next week. Technically, it's testing the lower EMAs and levels with some bullish patterns but who knows with the random gaps up and down these days.
Here's our hedged strategy
Buy 1 $5.00 Call
Buy 1 $7.50 Call
Sell 4 $2.50 Put
All expiring 1/19/24
This strategy can make up to 26% (20% annualized) and protect from a drop of up to 66% (cushion set way down to $2.50) as of 1/19/24.
Capital Required: $999

Hedge 99% of Stop Loss | Will it work? | Why isn't this popular?The explanation is drawn on the chart using text boxes.

SHOP Options StrategyCanadian e-commerce platform Shopify Inc (SHOP) offers 1.7 million online retailers in 175 countries (as of 2021) a range of services including payment, marketing, shipping and customer engagement. After online shopping boomed during the pandemic, it crashed ~80%, laid off 10% of its workers, and acquired Deliverr (product shipping) and Dovetail (influencer marketing). Shopify has also announced expansion into brick-and-mortar with its new product, the POS Go -- a device that allows retailers to provide wireless checkout anywhere in the store and analyzes sales, inventory and other data for merchants. Market cap $35B.
If SHOP has hit its low and is on its way up, here's an options strategy that maintains growth potential of up to 18% (26% annualized) but also allow some downside protection as SHOP is given room to fall 47% before breaking even.
Capital required: $2969.64
Hedged option legs:
Buy 1 $25 call
Sell 1 $30 call
Sell 2 $15 puts
Exp 6/16/23
Win probability: HIGH
