UPDATE: CRO UP 470% after bull signal - What Next?Please Like or Follow if you enjoyed this content.
UPDATE: The price jumped 470+% after the bullish Supertrend Ninja signal in Oct 2021. And 275% in July 2021. The Supertrend Ninja also predicted the heavy drops of April 2021 and Dec 2021.
The price is ranging, which is visible from the sideways movement. RSI is in a range as well. Although CRO got a bullish signal from my indicator Supertrend Ninja. Right now the price is in the middle of two grey blocks. Supports and Resistances are highlighted as grey blocks. Next support around 0.48 USDT. Next resistance around 0.68 USDT.
Profits can be taken at each grey block. Supports and resistances are drawn using the indicator 'Yo Show Me Some Support - and Resistances'. Pun intended.
Thank you for reading.
Namasté 🙏
What Indicators Do I Use:
In the chart I am using my Supertrend Ninja indicator, which is a trend-following indicator (Green and red vertical line with arrows).
When the background of the candlestick closes green (vertical line) with an upwards pointing pink arrow. It indicates a possible bullish (up)trend.
With each trade proper risk management is essential. Either by using my script Trailing Stoploss Bottom Activation indicator, visible as grey dots below the candles. Which sends an alert, when current price goes below the previous candle low. Or using my Heikin Ashi Trailing Stoploss Activation, the indicator below with green and red blocks. Or third option, exit when the Supertrend Ninja indicator displays a vertical red line with a downwards pointing black arrow. Remember, the first stop(loss) is always the cheapest stop.
Disclaimer: Ideas are for entertainment purposes only. Not financial advice. Your own due diligence is highly advised before entering trades. Past performance is no guarantee of future returns.
Heikin

UPDATE: BITCOIN UP 464% after bull signal - 140% more to come?Please Like or Follow if you enjoyed this content.
UPDATE: The price jumped 464+% after the bullish Supertrend Ninja signal. Using fibs, are we in for another 140%? Target at 114000 USDT, if this is the bottom. If we break down here, 42000 USDT is next support. The Supertrend Ninja predicted the drops of March 2020. May 2021 and Nov 2021. RSI is in a accumulation zone though.
2022 hasn't shown a bullish signal yet for the Supertrend Ninja. Only a matter of time. Supports and Resistances are highlighted as grey blocks. Profits can be taken at each grey block.
In the chart I am using the Supertrend Ninja indicator, which is a trend-following indicator (Green and red vertical line with arrows).
When the background of the candlestick closes green (vertical line) with an upwards pointing pink arrow. It indicates a possible bullish (up)trend.
With each trade proper risk management is essential. Either by using my script Trailing Stoploss Bottom Activation indicator, visible as grey dots below the candles. Which sends an alert, when current price goes below the previous candle low. Or using my Heikin Ashi Trailing Stoploss Activation, the indicator below with green and red blocks. Or third option, exit when the Supertrend Ninja indicator displays a vertical red line with a downwards pointing black arrow. Remember, the first stop(loss) is always the cheapest stop.
Thank you for reading.
Namasté
Disclaimer: Ideas are for entertainment purposes only. Not financial advice. Your own due diligence is highly advised before entering trades. Past performance is no guarantee of future returns.

CROUSD Heikin-Ashi turns bullishBoys and girls, the Heikin-Aashi candles turned bullish on the daily's. Does it feel real, or just a error blip in the tape?

BTC : New 12 Month Candle12 month heikin ashi log :
standard log :
heikin ashi linear :
standard linear :
bitstamp
// Durbtrade

The Magic LineHow far above and below will BTC go? Either way, the Magic Line reaches 150k just before December 31st, 2021.

UPDATE: AVAX UP 364% after bullish signal Please Like or Follow if you enjoyed this content.
UPDATE: The price jumped 364+% after the bullish Supertrend Ninja signal. And the third time 126%. Supports and Resistances are highlighted as grey blocks. Profits can be taken at each grey block.
In the chart I am using the Supertrend Ninja indicator, which is a trend-following indicator (Green and red vertical line with arrows).
When the background of the candlestick closes green (vertical line) with an upwards pointing pink arrow. It indicates a possible bullish (up)trend.
With each trade proper risk management is essential. Either by using my script Trailing Stoploss Bottom Activation indicator, visible as grey dots below the candles. Which sends an alert, when current price goes below the previous candle low. Or using my Heikin Ashi Trailing Stoploss Activation, the indicator below with green and red blocks. Or third option, exit when the Supertrend Ninja indicator displays a vertical red line with a downwards pointing black arrow. Remember, the first stop(loss) is always the cheapest stop.
Thank you for reading.
Namasté
Disclaimer: Ideas are for entertainment purposes only. Not financial advice. Your own due diligence is highly advised before entering trades. Past performance is no guarantee of future returns.

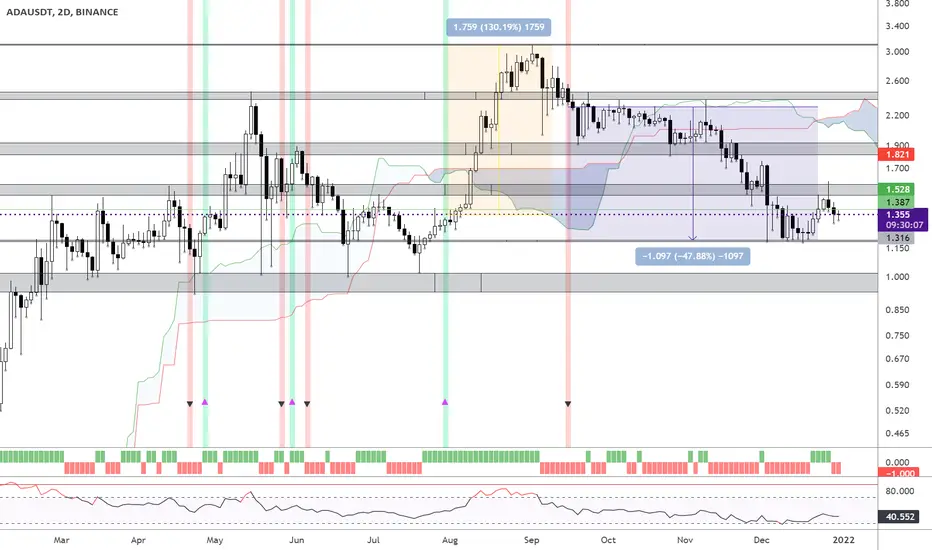
UPDATE: ADA UP 130% after bullish signal Please Like or Follow if you enjoyed this content.
UPDATE: The price jumped 130+% after bullish Supertrend Ninja signal. After the bearish signal (ideal for shorts), the price went down 48%. The RSI is slightly above 40. Which indicates we are still in a bearish (down) trend or sideways range. Supports and Resistances are highlighted as grey blocks.
In the chart I am using the Supertrend Ninja indicator, which is a trend-following indicator (Green and red vertical line with arrows).
When the background of the candlestick closes green (vertical line) with an upwards pointing pink arrow. It indicates a possible bullish (up)trend.
With each trade proper risk management is essential. Either by using my script Trailing Stoploss Bottom Activation indicator, visible as grey dots below the candles. Which sends an alert, when current price goes below the previous candle low. Or using my Heikin Ashi Trailing Stoploss Activation, the indicator below with green and red blocks. Or third option, exit when the Supertrend Ninja indicator displays a vertical red line with a downwards pointing black arrow. Remember, the first stop(loss) is always the cheapest stop.
Thank you for reading.
Namasté
Disclaimer: Ideas are for entertainment purposes only. Not financial advice. Your own due diligence is highly advised before entering trades. Past performance is no guarantee of future returns.
UPDATE: LUNA UP 50% after bullish signal Please Like or Follow if you enjoyed this content.
UPDATE: The price jumped 50+% after bullish Supertrend Ninja signal. Combining this with the indicator Heikin Ashi Trailing Stoploss activition proves to be worth it again.
In the chart I am using the Supertrend Ninja indicator, which is a trend-following indicator (Green and red vertical line with arrows).
When the background of the candlestick closes green (vertical line) with an upwards pointing pink arrow. It indicates a possible bullish (up)trend.
With each trade proper risk management is essential. Either by using my script Trailing Stoploss Bottom Activation indicator, visible as grey dots below the candles. Which sends an alert, when current price goes below the previous candle low. Or using my Heikin Ashi Trailing Stoploss Activation, the indicator below with green and red blocks. Or third option, exit when the Supertrend Ninja indicator displays a vertical red line with a downwards pointing black arrow. Remember, the first stop(loss) is always the cheapest stop.
Thank you for reading.
Namasté
Disclaimer: Ideas are for entertainment purposes only. Not financial advice. Your own due diligence is highly advised before entering trades. Past performance is no guarantee of future returns.

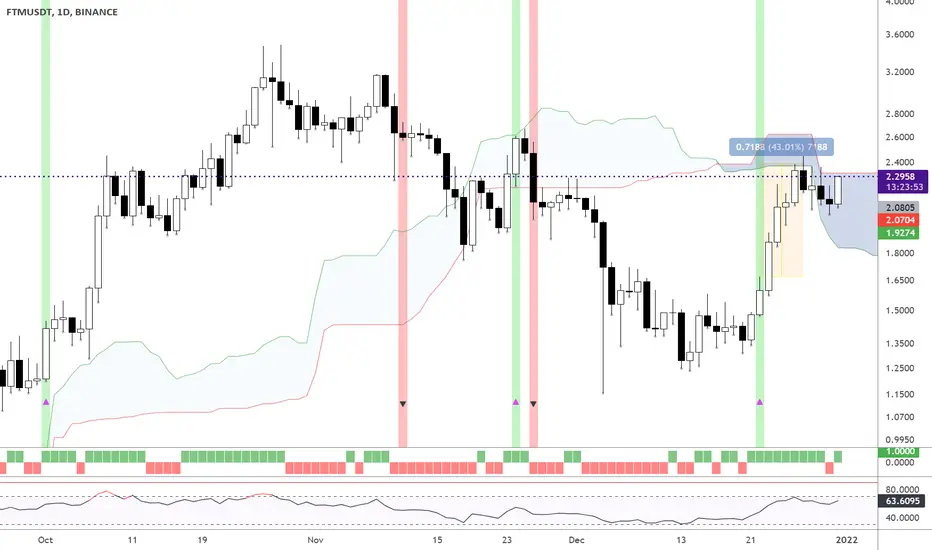
UPDATE: FTM UP 43% after bullish signal Please Like or Follow if you enjoyed this content.
UPDATE: The price jumped 43+% after bullish Supertrend Ninja signal. Finding resistance from the Ichimoku Cloud.
In the chart I am using the Supertrend Ninja indicator, which is a trend-following indicator (Green and red vertical line with arrows).
When the background of the candlestick closes green (vertical line) with an upwards pointing pink arrow. It indicates a possible bullish (up)trend.
With each trade proper risk management is essential. Either by using my script Trailing Stoploss Bottom Activation indicator, visible as grey dots below the candles. Which sends an alert, when current price goes below the previous candle low. Or using my Heikin Ashi Trailing Stoploss Activation, the indicator below with green and red blocks. Or third option, exit when the Supertrend Ninja indicator displays a vertical red line with a downwards pointing black arrow. Remember, the first stop(loss) is always the cheapest stop.
Thank you for reading.
Namasté
Disclaimer: Ideas are for entertainment purposes only. Not financial advice. Your own due diligence is highly advised before entering trades. Past performance is no guarantee of future returns.
BTC manipulation (we love it)!OPINION!
I learned that the Vs in ichimoku's red cloud take the price up from it, Stoch rsi shows the possibility of going up, but MACD X starts to worry me, even with the price going down and the bottom going up. Heikin Ashi with Last Candles Won by Bulls. Bulls:
If TODAY closes above Daily MA200 the correction will not go beyond 45K, Side channel support since the last fall on December 4th.
Bears:
If you close below 45k, it will fetch the shadow at 42k.
Unfortunately for bears, I don't believe falling below 45k, in this scenario we're out of volume!
And it needs more people in the game to have sales force and break the support of this channel at 45k.
Summary: I expect wick at 56k and then a strong bearish to break 45k. Afterwards 40k wick up to possible 37k (weekly ichimoku cloud limit), with rapid price recovery to 42k, strong absorption zone and for me, accumulation zone.
At this moment I am 30% long and I have sold the rest as soon as the price has lost 50200. I will start buying after my indicators show about selling in the diary. I follow 30% long, because we know about the manipulations in this market and that's why we are in it, no frills, here it is volatile, speculated and manipulated. Want peace of mind, go to other markets.
*** Português ***
OPINIÃO!
Aprendi que os Vs na nuvem vermelha de ichimoku levam o preço para cima da mesma, Stoch rsi mostra possibilidade de subida, porem MACD X começa a me preocupar, mesmo tendo preço descendo e fundo subindo. Heikin Ashi com últimos Candles Vencidos por touros. Touros:
Se fechar HOJE ah cima de MA200 Diário a correção não passara de 45K, Suporte do canal lateral dês da ultima queda em 04 de dezembro.
Ursos:
Se fechar abaixo de 45k, irá buscar a sombra em 42k.
Infelizmente para os ursos, eu não acredito queda pra baixo de 45k, nesse cenário que estamos está sem volume!
E precisa de mais pessoas no jogo pra ter força vendedora e romper o suporte desse canal em 45k.
Resumo: Espero pavio em 56k e depois uma descida forte para romper 45k. Posteriormente pavio de 40k até possíveis 37k (limite da nuvem de ichimoku no semanal), com recuperação rápida do preço para 42k, zona de forte absorção e pra mim, zona de acumulação.
Neste momento EU estou 30% comprado e vendi o restante assim que o preço perdeu 50200. Iniciarei as compras depois que meus indicadores mostrarem sobre venda no diário. Sigo 30% comprado, pois sabemos das manipulações desse mercado e por isso estamos nele, sem frescura, aqui é volátil, especulado e manipulado. Quer tranquilidade, vá para outros mercados.

AIM HIGH - Just my thoughts and analysis. All charts say bullish market. All charts must agree to make money. Remember to manage your money wisely.
S1/UP

Potential path for Jasmy! Very good opportunities to buyJasmy may follow this pattern, look for buy opportunities on retracements.

UPDATE: Rose UP 20% after bullish signal Please LIKE or FOLLOW if you like this idea.
UPDATE: The price jumped 20+% after bullish Supertrend Ninja signal.
In the chart I am using the Supertrend Ninja indicator, which is a trend-following indicator (Green and red vertical line with arrows).
When the background of the candlestick closes green (vertical line) with an upwards pointing pink arrow. It indicates a possible bullish (up)trend.
The Supertrend Ninja indicator formed its 7th bullish signal in 2021.
With each trade proper risk management is essential. Either by using my script Trailing Stoploss Bottom Activation indicator, visible as grey dots below the candles. Which sends an alert, when current price goes below the previous candle low. Or using my Heikin Ashi Trailing Stoploss Activation, the indicator below with green and red blocks. Or third option, exit when the Supertrend Ninja indicator displays a vertical red line with a downwards pointing black arrow. Remember, the first stop(loss) is always the cheapest stop.
Thank you for reading.
Namasté
Disclaimer: Ideas are for entertainment purposes only. Not financial advice. Your own due diligence is highly advised before entering trades. Past performance is no guarantee of future returns.

Callisto Network CLO about to turn, big bull run. CLO has just retested the previous heikin ashi doji, looks to be turning to an uptrend. Could be a big bull run after this breakout.

Analysis SHIB/USDT on 12H chart + Support and ResistancesPlease LIKE or FOLLOW if you like this idea.
RSI is moving towards 60, which is a bullish signal. Breaking RSI 70 is usually where it gets interesting. The Heikin Ashi indicator is also showing green blocks (indicator below). Which confirms we're in an uptrend.
Supports and resistances are drawn in grey blocks. Currently we are finding resistance from the Ichimoku Cloud. Moving above the cloud and finding support above 4500 is where it will be interesting.
In the chart I am using the Supertrend Ninja indicator, which is a trend-following indicator (Green and red vertical line with arrows).
When the background of the candlestick closes green (vertical line) with an upwards pointing pink arrow. It indicates a possible bullish (up)trend.
With each trade proper risk management is essential. Either I use my script Trailing Stoploss Bottom Activation indicator, visible as orange dots below the candles. Which sends an alert, when current price goes below the previous candle low. Or using my Heikin Ashi Trailing Stoploss Activation, the indicator below with green and red blocks. Or third option, exit when the Supertrend Ninja indicator displays a vertical red line with a downwards pointing black arrow. Remember, the first stop(loss) is always the cheapest stop.
Thank you for reading.
Namasté
Disclaimer: Ideas are for entertainment purposes only. Not financial advice. Your own due diligence is highly advised before entering trades. Past performance is no guarantee of future returns.

ROSE/USDT starting to look bullish.Please LIKE or FOLLOW if you like this idea.
RSI is moving towards 60, which is a bullish signal. The Heikin Ashi indicator is also showing green blocks (indicator below). Which also confirms we're in a possible uptrend.
In the chart I am using the Supertrend Ninja indicator, which is a trend-following indicator (Green and red vertical line with arrows).
When the background of the candlestick closes green (vertical line) with an upwards pointing pink arrow. It indicates a possible bullish (up)trend.
The Supertrend Ninja indicator is forming its 7th bullish signal in 2021.
With each trade proper risk management is essential. Either by using my script Trailing Stoploss Bottom Activation indicator, visible as orange dots below the candles. Which sends an alert, when current price goes below the previous candle low. Or using my Heikin Ashi Trailing Stoploss Activation, the indicator below with green and red blocks. Or third option, exit when the Supertrend Ninja indicator displays a vertical red line with a downwards pointing black arrow. Remember, the first stop(loss) is always the cheapest stop.
Thank you for reading.
Namasté
Disclaimer: Ideas are for entertainment purposes only. Not financial advice. Your own due diligence is highly advised before entering trades. Past performance is no guarantee of future returns.

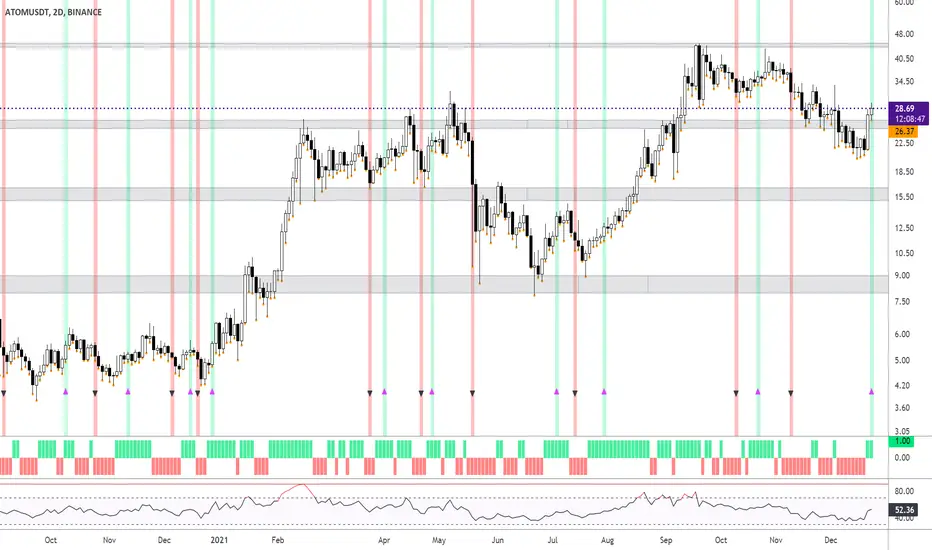
Analysis ATOM/USDT on 2Days chartPlease LIKE or FOLLOW if you like this idea.
RSI is above 50, which indicates a possible upmarket. The Heikin Ashi indicator is also showing green blocks (indicator below). Which also confirms we're most likely looking at a possible uptrend.
In the chart I am using the Supertrend Ninja indicator, which is a trend-following indicator (Green and red vertical line with arrows).
When the background of the candlestick closes green (vertical line) with an upwards pointing pink arrow. It indicates a possible bullish (up)trend.
The Supertrend Ninja indicator is forming its 7th bullish signal in 2021.
Supports and resistances are displayed in grey. With price finding support.
With each trade proper risk management is essential. Either by using my script Trailing Stoploss Bottom Activation indicator, visible as orange dots below the candles. Which sends an alert, when current price goes below the previous candle low. Or using my Heikin Ashi Trailing Stoploss Activation, the indicator below with green and red blocks. Or third option, exit when the Supertrend Ninja indicator displays a vertical red line with a downwards pointing black arrow. Remember, the first stop(loss) is always the cheapest stop.
Thank you for reading.
Namasté
Disclaimer: Ideas are for entertainment purposes only. Not financial advice. Your own due diligence is highly advised before entering trades. Past performance is no guarantee of future returns.
Analysis VET/USDT on Daily chartRSI is slowly moving towards 50, which indicates a possible upmarket. The Heikin Ashi indicator is also showing green blocks (indicator below). Which also confirms we're most likely looking at a possible uptrend.
In the chart I am using the Supertrend Ninja indicator, which is a trend-following indicator (Green and red vertical line with arrows).
When the background of the candlestick closes green (vertical line) with an upwards pointing pink arrow. It indicates a possible bullish (up)trend.
The Supertrend Ninja indicator is forming its 9th bullish signal for the 1 day chart in 2021. Six out of 9 signals, the price indeed went higher with a Monster Trend on March 2021.
Supports and resistances are displayed in grey. With below the price a strong support.
With each trade I make, proper risk management is essential. Either by using the Trailing Stoploss Bottom Activation indicator, visible as orange dots below the candles. Which sends an alert, when current price goes below the previous candle low. Or using the Heikin Ashi Trailing Stoploss Activation, the indicator below with green and red blocks. Or third option, exit when the Supertrend Ninja indicator displays a vertical red line with a downwards pointing black arrow. Remember, the first stop(loss) is always the cheapest stop.
Thank you for reading.
Namasté
Disclaimer: Ideas are for entertainment purposes only. Not financial advice. Your own due diligence is highly advised before entering trades.
Past performance is no guarantee of future returns.

How to detect a trend and trail an uptrend? How do I detect an uptrend?
In the chart BNB/USDT I am using the Supertrend Ninja indicator, which is a trend-following indicator (Green and red vertical line with arrows).
When the background of the candlestick closes green with an upwards pointing pink arrow. It indicates a possible bullish (up)trend.
The Supertrend Ninja indicator gave only 6 bullish signals for the 2 day chart in 2021. And 2 bullish signal in 2020. Which in my opinion makes each bullish signal very reliable.
It warned about the March 2020 and May 2021 (possible) corrections (big purple down arrows). And also the big uptrend of Dec 2020 (big blue up arrow).
How do I trail an uptrend?
With each trade I make, proper risk management is essential. Either by using the Trailing Stoploss Bottom Activation indicator, visible as orange dots below the candles. Which sends an alert, when current price goes below the previous candle low. Or using the Heikin Ashi Trailing Stoploss Activation, the indicator below with green and red blocks. Remember, the first stop(loss) is always the cheapest stop. Using one of these, or both offers me the possibility to ride bigger parts of the trend. Whichever triggers an alert first.
(For completeness, the grey blocks are supports and resistances)
Thank you for reading.
Namasté
Disclaimer: Ideas are for entertainment purposes only. Not financial advice. Your own due diligence is highly advised before entering trades.
Past performance is no guarantee of future returns.

Analysis EGLD/USDT on 2Days chartI was asked to chart EGLD /USDT. And how the Supertrend Ninja indicator performed on it since the listing.
Currently price is bouncing between support and resistance (2 grey blocks). Which makes/made EGLD ideal for a gridbot.
RSI is slowly moving towards 44, which means it is still in a range (displayed in the RSI as a yellow block). Right now as things stand it's not so interesting for trend traders. On the other hand volume is going down, which means a big move is likely to happen very soon. Before making any trades. I'll be waiting for confirmation from the Supertrend Ninja indicator showing some bullishness first. Ideally I would like to see some more green blocks on the Heikin Ashi indicator below as well.
In the chart I am using the Supertrend Ninja indicator, which is a trend-following indicator (Green and red vertical line with arrows).
When the background of the candlestick closes green with an upwards pointing pink arrow. It indicates a possible bullish (up)trend.
The Supertrend Ninja indicator gave only 4 bullish signals for the 2 day chart in 2021. And 1 bullish signal in 2020. Which in my opinion makes each bullish signal very reliable.
With each trade I make, proper risk management is essential. Either by using the Trailing Stoploss Bottom Activation indicator, visible as orange dots below the candles. Which sends an alert, when current price goes below the previous candle low. Or using the Heikin Ashi Trailing Stoploss Activation, the indicator below with green and red blocks. Remember, the first stop(loss) is always the cheapest stop.
Thank you for reading.
Namasté
Disclaimer: Ideas are for entertainment purposes only. Not financial advice. Your own due diligence is highly advised before entering trades.
Past performance is no guarantee of future returns.

SHIB/USDT bounced on support. Bullish?In the chart I am using the Supertrend Ninja indicator, which is a trend-following indicator.
When the background of the candlestick closes green with an upwards pointing pink arrow. It indicates a possible bullish (up)trend. I expect a signal within few days.
Price bounced on support (grey block). Which is a good sign.
The Supertrend Ninja indicator gave only 3 bullish signals for the 2 day chart in 2021. Including the monstertrend on 30th Sept. Entering on the blue arrow, and exit on the red down arrow (using Trailing Stoploss Bottom Activation indicator) made a whopping 250%. The Trailing Stoploss Bottom Activation, visible as orange dots below the candles. Sends an alert, when current price goes below the previous candle low (red horizontal line). This stoploss sell alert (using Tradingview webhook) worked great in combination with a bot. This happened on 14th Oct.
Heikin Ashi is showing green blocks in the indicator below as well. Which means an uptrend is likely. Also RSI is slowly moving towards 50, which is a bullish signal. SHIB looks done correcting. I'll be waiting for confirmation from the Supertrend Ninja indicator. Before entering any trades.
Namasté
Disclaimer: Ideas are for entertainment purposes only. Not financial advice. Your own due diligence is highly advised before entering trades.
Past performance is no guarantee of future returns.

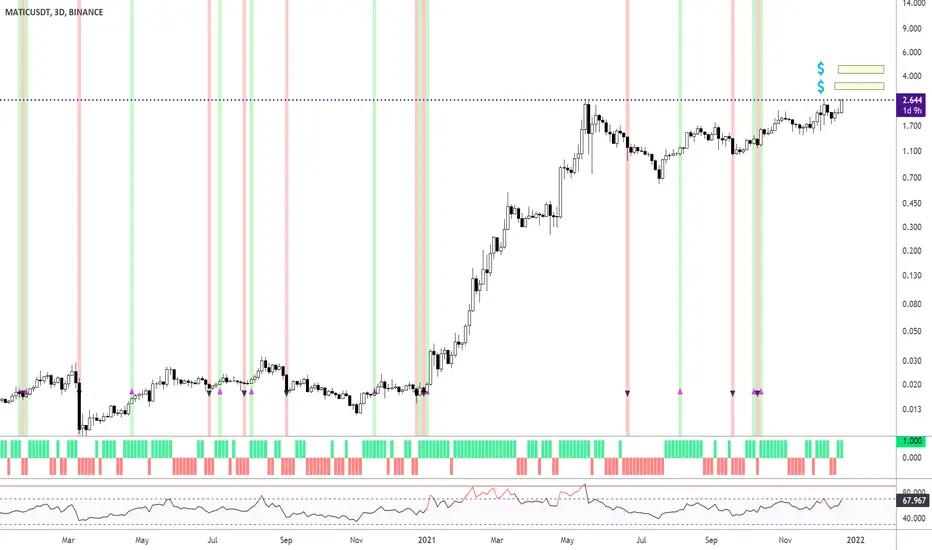
MATIC/USDT Uptrend Take Profit levels 🚀In the chart I am using the Supertrend Ninja indicator, which is a trend-following indicator.
Matic is currently facing resistance from the previous ATH. Break this and we gonna set ourselves some new ATH's. Which on midterm can go as high as 4.8 USDT.
My Take profit levels are in yellow blocks.
On 13th Oct, the background of the candlestick closed green with an upwards pointing pink arrow. Which indicated a possible bullish (up)trend. Since then the price has gone higher. Important detail. The Supertrend Ninja indicator gave only 4 bullish signals for the 3 day chart in 2021.
RSI is close to 70. Break RSI 70, and we might be at the beginning of a bigger uptrend. Heikin Ashi is showing the start of a bullish trend as well (indicator below in the form of green blocks). Do we need to buckle up are seatbelt?
Namasté
Disclaimer: Ideas are for entertainment purposes only. Not financial advice. Your own due diligence is highly advised before entering trades.
Past performance is no guarantee of future returns.
ONE/USDT starting to look bullish.In the chart I am using the Supertrend Ninja indicator, which is a trend-following indicator.
Today it's forming a bullish signal. With still 9 hours before candle close. If the background of the candlestick closes green with an upwards pointing pink arrow. It indicates a possible bullish (up)trend. Important detail. The Supertrend Ninja indicator is potentially forming its 7th bullish candle in 2021.
RSI is above 50. Heikin Ashi is showing a bullish trend as well (indicator below in the form of green blocks). Are we done with correcting? Are things heating up?
Namasté
Disclaimer: Ideas are for entertainment purposes only. Not financial advice. Your own due diligence is highly advised before entering trades.
Past performance is no guarantee of future returns.
