HDRN bullish and Bearish macro levelsKEY: white=monthly, purple=weekly, red=daily, yellow=4 hour.
For the macro: want to see a monthly candle close in the green above that bottom dashed level that’s white and .0000032142 to gain them as support in the future
One layer lower to the weekly: mirroring has commence between weekly break to weekly break. Left most arrow got hit to dollar by the 3rd arrow, which moves up and hits the second arrow to the dollar on the fourth arrow. Time frame levels respect their same time frame levels if they appear as a test on that time frame to the dollar or within fractions of a percent. There are some other circumstances too but not relevant here.
The weekly chart is forming architecture over a monthly level that is white on this chart, that could cause a break of that weekly level since the time frame higher than it it powering/holding the move upwards
On the daily so micro macro lol: the bottom red dotted line is a breakout point as well since two different color candles (a peak on lower time frames, yes a peak like a mountain) wicked through it but didn’t close accumulation above it. To continue move up price would want to close accumulation over this level today, or if it does close distribution it still needs to be above that dotted line. If not then that cues a dump down to the lower weekly levels probably.
SUMMARY:
Ultimately on the macro is looks like the move is going up since it held that bottom most white dashed line which is a hold level. Hold levels are either the top wick or the body of a candle before a color change. This is because on lower time frames it’s the top of a peak the bottom of a valley or one of those breakout points that can still be respected as support or resistance in the future/opposite of what they were initially required to “breakout” from
Monthly trend as well and lower time frame weekly trend cycling or increasing in angle on the diagonal axis the further you get on the horizontal axis
DITCH THE INDICATORS LEARN C0tt0nc4ndyta science and get moves to the dollar.
HEX

HEXUSD IdeaIdea showing a breakout of a large falling wedge
This breakout is very strong and I expect further continuation of the breakout upwards as shown with the bars pattern in green
It could be considered that this is the right arm of a larger inverted H&S structure, UP
Daily timeframe

BTC STUCK - INSIDE Day - Let's look at our Crystal Ball!BTC STUCK - INSIDE Day - Let's look at our Crystal Ball!
BTC - We are looking for a 2-2 Reversal or a 2-1-2 Break with Full Time Frame Continuity (Daily Bar) (All in the Video Below?
This Stream talks about what we want here to happen....
www.tradingview.com
What's Next? Wait for the Daily Candle to tell US!
Best of luck in your Trades......
DISCLAIMER: This video is for entertainment purposes only.

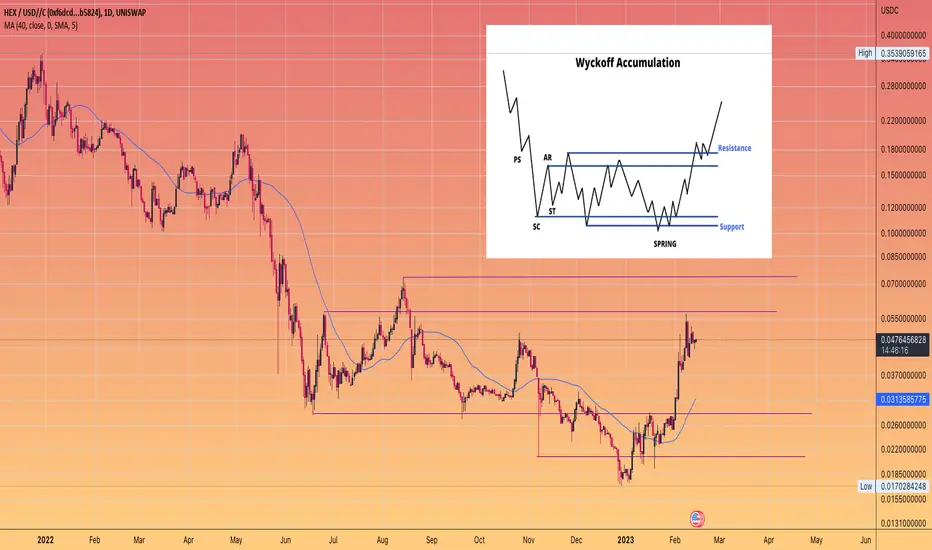
HEX in a Wyckoff type of accumulation (daily), phase AHEX could be in a Wyckoff type of accumulation. If so ,price action is after the selling climax (which was in June) ,and now we are at the end of phase A (we should see a marginally lower low very soon) sub 0.02c!!!
Phase B will be the longest phase (3 months or more) . It will be a more bullish phase ,where price will consolidate near resistance (0.04c-0.07c) giving "investors" hopium that the bottom is in
Phase C will be a short and sharp decline ,the ultimate capitulation . This happens usually at a black swan event or whales simply testing liquidity, dumping price and rebuying NEAR ultimate support. Sometimes price does lower lows or marginally higher lows on the grand scheme. ( +/- 0.02c )
This could play out probably Q1 next year
Phase D will be a sharp BUY . Will play out in Q1 or Q2 next year. At this point nobody will care cuz everybody will be REKT
Price could reach new yearly highs ,first 0.114 then the good ol` 0.168 cent area .
Conclusion :selling now is quite stupid (exept if u are still up 10-100x) hex could be a good buying oportunity UNDER 0.02 ....
I`m buying at 0,019 cents ....from this point a 5x should be easy in this shitcoin .
LONG

BTC SCLAP - TARGETS IN YELLOW (25K Challenge)Scalping BTC here...
Targets in Yellow..
THINKING This : Rationale Explained in the Video
1 HOUR BREAK, SETS UP the 4hr and the 4hr Break will setup the DAY!

#POORPLEB still has room to run This beautiful inverse head and shoulders
Is playing out to perfection
I expect the target to be run and even the possibility of tagging the first candle wick highs
at which a round of profit taking to come in
The higher the price the greater the risk for new entries of course
the risk being, a holding a position that will likely need a rest period
so pullbacks here could be a good entry to avoid holding in the red.

HEXUSD chartMACD crossover above 0 line and it happens below 200days moving average on 1D. With all of that it cross trendline downside.

BTC / ETH / HEX WEEKLY LOOK! WHAT's NEXT?BTC - INSIDE Day , Possible reversal on the week (21K target).Will 20K be retested??.. Next Target upside $25300 area needs to break and hold.
ETH - INSIDE Day , Possible reversal on the week ($1450 target)... Next upside Target $1750 area needs to break and hold.
HEX - 2 Down Day , Possible reversal on the week... Will 0.05 Cents hold? Next upside Target 0.073 needs to break. PULSECHAIN NEWS will help this coin keep raising. This asset has relative strength from BTC/ETH.
What's Next? Wait for the Daily Candle to tell US!
Best of luck in your Trades..
DISCLAIMER: This video is for entertainment purposes only.

What the HEX is going on? 0.073 cents our next target!HEX needs to break 7 Cents Next....
Pulsechain coming soon ? YOU BULLISH?
HEX took out 7 cents on a few charts. What's Next?
Wait for the Daily Candle to tell US!
Best of luck in your Trades.....................
DISCLAIMER: This video is for entertainment purposes only.

HEXUSD - IS IT TIME TO HEXIT! HEX broke 0.06 Cents today!
HEX needs to break 7 Cents Next....
Pulsechain coming?
YOU BULLISH?
What's Next? Wait for the Daily Candle to tell US! Best of luck in your Trades
DISCLAIMER: This video is for entertainment purposes only.

HEXUSD - STRONG LIKE BULL!HEX needs to break 7 cents next.
Pulsechain pump coming?
What's Next?
Wait for the Daily Candle to tell US!
Best of luck in your Trades!

HEX Februaryhere are some levels of support and resistance to look for on hex in the coming month. Daily trend keeps cycling up and weekly trend has a potential to break in 2 days. Signs pointing up but there is also a potential downside that is drawn on the dark red squiggly.
Shout out to c0tt0nc4ndyTA. Ditch the indicators.

HEX Broke 5 Cents....Pulsechain pump coming? YOU BULLISH??HEX took out 5 cents today. It gave us Monthly and Quarterly setups.....What's Next? Wait for the Daily Candle to tell US! Best of luck in your Trades!

#HEX Wyckoff accumulationLike some other #altcoins
#HEXUSDC appears to be showing a #Wyckoff accumulation pattern
not textbook , but a very good guide as to what has occurred during this #bear market
could we have CPI dump today , quite possible
but I am favouring a lower CP LIE and grounds for continuation in the #stock market
HEXUSDT going straight to 0.1000 based on this!HEXUSDT is recovering from the extreme volatility of February 04-05, keeping the 1D MA200 (orange trend-line) intact. Despite a largely overbought 1D RSI, the last time we saw such a huge 2 day volatility was during May 27-28 2022. That proved out to be just a pause before a continuation of that bearish leg towards the bottom of the long-term Channel Down.
That bearish leg hit the 3.0 Fibonacci extension with ease. Since we are currently on a bullish leg since the start of the year, a Fib 3.0 continuation will take HEX as high as 0.1000. That is our medium-term target.
-------------------------------------------------------------------------------
** Please LIKE 👍, FOLLOW ✅, SHARE 🙌 and COMMENT ✍ if you enjoy this idea! Also share your ideas and charts in the comments section below! **
-------------------------------------------------------------------------------
💸💸💸💸💸💸
👇 👇 👇 👇 👇 👇


ICSA x10 in 4Month ?Speculation only. Will Icosa return back in it´s LOG View Pattern?
Hex is gaining through Pulsechain Launch.
Price will push HDRN and ICSA against HEX which grows against USD.
Multiple X possible. Maybe x10 in 4 Month?

LESS THAN 500 DAYS 2 VICTORYThere is speculation of Pulsechain ( PLS ) & Pulesex (PLSX) launch, but one thing remains unchangeable: Hex on Ethereum (eHEX)
Let´s look back in 500 days and see how this turned out.
NO FINANCIAL ADVICE
Please do your own research, and do not use this as a projectile for your financial plan.

#Poorpleb double top breakoutbeautiful formation
#PP has been on a tear since bottoming and already 3X from its lows in USD
charted vs #HEX we see further room to run

#Hexicans embrace the #FUD , Sell the #FOMOThe hardest thing to do!
But what we must do.
Hex bear is over... but the accumulation zone can be long
It's a gift if taken advantage properly
1/2 a #Bitcoin can give a 80X from here.

HEXUSDT Trend AnalysisAnalysing trends on HEXUSD we can see two distinct seperate downchannel yet connected by the middle band
I have tried to plot outcomes with bars patterns, i am liking doing this.
Price action in ovals show two touches in two different scenarios, similar, hence highlighted

HEX 3D HEX chart,
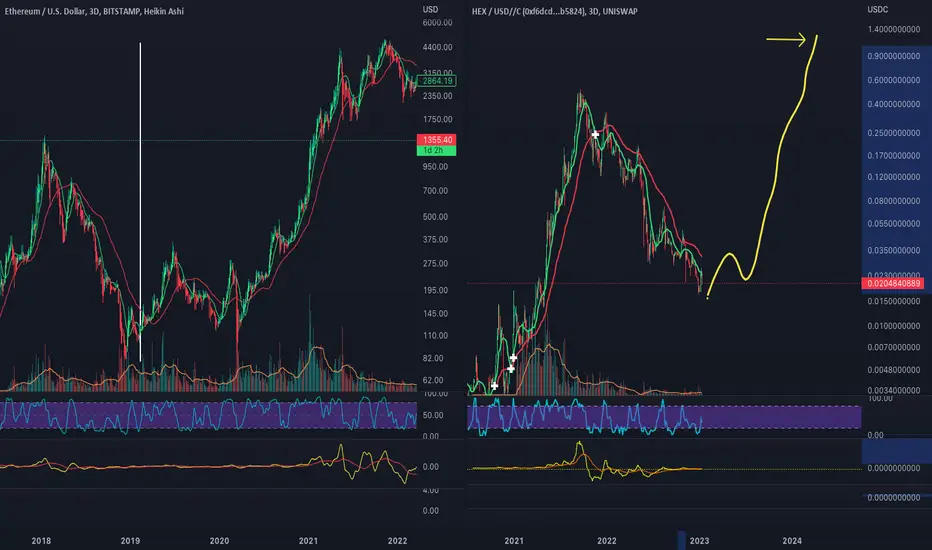
If HEX follows ETH 2021 trajectory run, HEX could be $1.00 in future, 50X return?
-Based on measurement from % ETH increase
-I am long term bullish
-Watching for the 3Day SMA cross
None of this should be interpreted as financial advice, I am not a professional or certified financial adviser! all charts, and or analysis' are my personal opinions and observations only!
HEX | MarketCap ideaHere, another HEX chart. I've been following this awhile and the last dip, tested perfectly. There is a gap to the green line... I didn't care to mark other levels there. the green line is the #finalLevel & #finalHold that still supports an accumulation uptrend.
Its not probable at the moment, but it it is possible. Its up to you to envision the why and how and especially the when.
What if the supply is so low because everyone has moved their value onto another chain?
What if that coincidental gap to the green line isn't actually born out of laziness?
I follow this stuff cause I enjoy the puzzles. Its a mental exercise to chart. It interesting, at times, the correlation between marketcap and price considering the T-share relationship when stakers hit that good accounting... or end stake. Market cap is up 12% while price dumped... Money goes in... converts to T-Shares.. Hex is burned... Lets see what happens when all these new stakes end in avg 35 days.
