Massive Upside for SUSHI from Key Demand Zone!CRYPTOCAP:SUSHI is bouncing strongly from a key multi-tested weekly support zone (~$0.42–$0.55), signaling a potential bottom formation. Price action shows a bullish structure with the possibility of a trend reversal. If momentum continues, we could see a rally first toward Resistance 1 at $1.25, followed by a larger move targeting Resistance 2 at $3.75.
Stop Loss: $0.43
Resistance 1:$1.25
Resistance 2:$3.75
BINANCE:SUSHIUSDT
Hexatrades

PHA Bounce from Historical Support ZonePHA is showing signs of a potential bullish reversal after bouncing off a long-standing support zone. Price has consistently respected this support level since mid-2022, creating a strong base. Now, we’re seeing bullish momentum building as the weekly candle breaks above the 50-week EMA, which had acted as dynamic resistance in the past.
A break above the recent swing high could trigger a larger move toward the $0.25–$0.35 resistance area. As long as the support zone remains intact, the structure remains bullish.
Cheers
Hexa

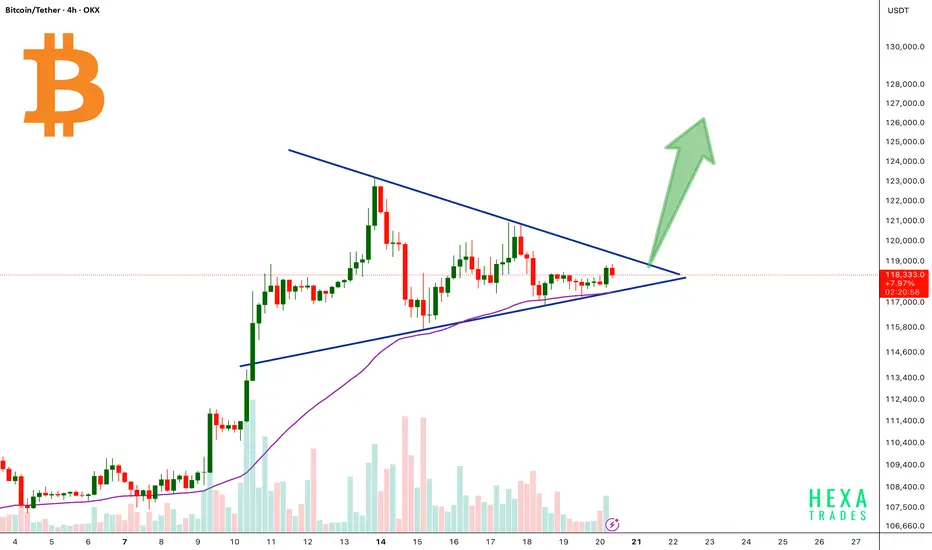
BTC Forming Bullish Triangle!Bitcoin is currently consolidating inside a symmetrical triangle pattern after a strong bullish rally. The price is approaching the apex of the triangle, signaling a potential breakout soon.
The 50 EMA is acting as dynamic support, perfectly aligned with the triangle’s lower trendline, reinforcing the bullish structure.
A confirmed breakout above the triangle resistance could trigger a strong upward move, with a potential target near the $125,000–$130,000 zone.
Cheers
Hexa
BINANCE:BTCUSDT CRYPTOCAP:BTC
WUSDT Approaching Major Breakout Point in Descending Channel!WUSDT is trading inside a well-defined descending channel on the daily chart. Price is now testing the upper boundary of the channel, showing signs of bullish strength after a strong move from the lower support.
If the price breaks and closes above the channel resistance, it could trigger a bullish trend reversal with a potential move toward the $0.23 zone.
Cheers
Hexa

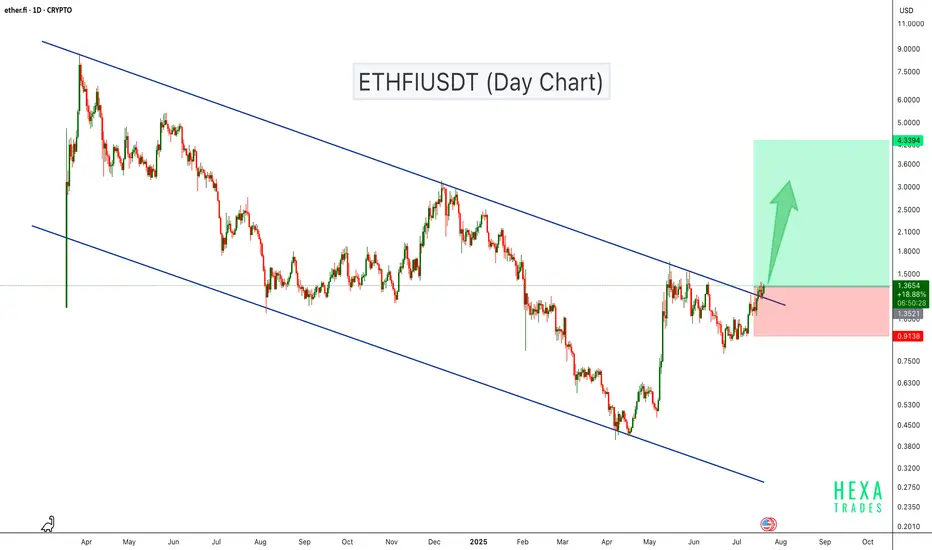
ETHFI Breaks Out of Descending Channel – Bullish Rally Ahead?ETHFI has been trading inside a descending channel for over a year, consistently respecting both resistance and support levels. Recently, the price broke above the channel resistance with strong bullish candles, suggesting a potential trend reversal.
This breakout indicates growing bullish momentum, and if the price sustains above the breakout level, we could see a move towards the $4.00–$4.70 range in the coming weeks.
Cheers
Hexa
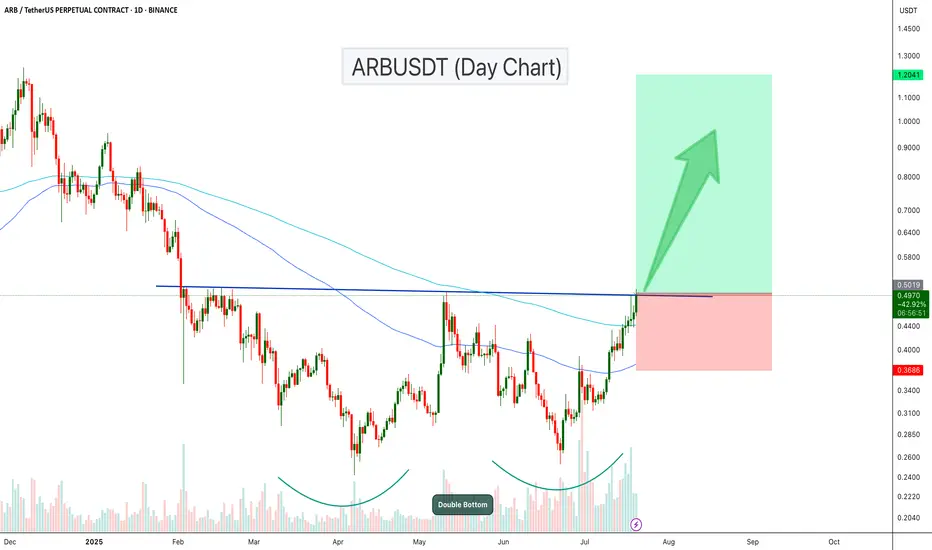
ARBUSDT Breaks Out of Double Bottom!ARB has formed a clear double bottom pattern on the daily chart, signaling a strong reversal structure. After multiple rejections, the price has now broken above the neckline resistance, confirming bullish momentum.
The breakout is also supported by increasing volume and a bullish crossover of the 100 and 200 EMA zones. If the current momentum holds, ARB could reach the target of $0.75- $1.20 level.
WLDUSDT Approaching Breakout After Long-Term Downtrend!WLD is currently trading inside a descending channel on the 3-day chart. The price has recently shown strong bullish momentum and is approaching the upper boundary of the channel as well as a key resistance zone.
A breakout above this zone could lead to a significant bullish continuation. Volume has started to pick up, indicating increasing interest. If the price manages to flip the resistance into support, we could potentially see a rally towards the $5.00 - $10.00 zone.

XTZ Is Waking Up – Next Stop $2.25?SEED_DONKEYDAN_MARKET_CAP:XTZ is currently bouncing from the lower boundary of a broadening wedge pattern on the weekly chart, signaling a potential trend reversal. This structure, characterized by widening price swings, has been developing since mid-2022.
The recent bullish move has pushed the price above a key resistance zone, with rising volume supporting the momentum. The upper boundary of the wedge aligns with the next major target zone near $2.25.
Resistance 1: $1.00
Resistance 2: $1.45
Resistance 3: $2.25
Cheers
Hexa
BINANCE:XTZUSDT

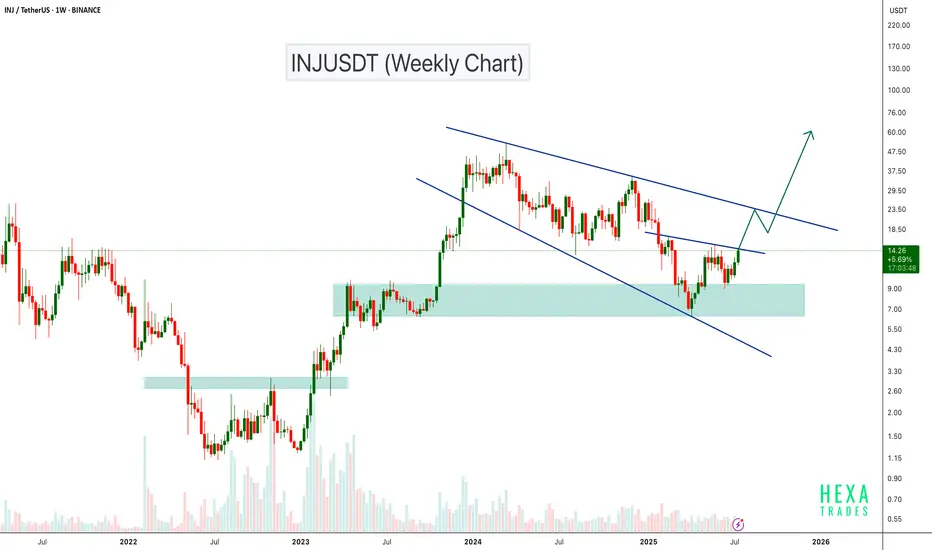
INJUSDT Approaching Key Wedge Resistance – Breakout Ahead?INJ is currently trading inside a broadening wedge pattern on the weekly timeframe. The price recently bounced strongly from the major demand zone around $8–$9, which has acted as a reliable support level in the past.
Now, INJ is approaching the upper resistance trendline of the broadening wedge. A confirmed breakout above this level could lead to a strong bullish move, potentially targeting the $50 level.
Cheers
Hexa
CRYPTOCAP:INJ BINANCE:INJUSDT
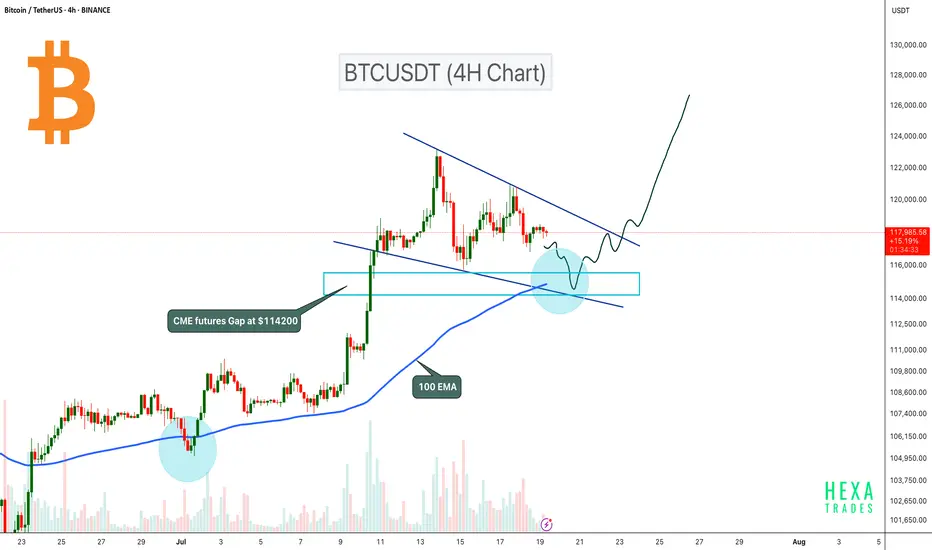
BTC Pullback Expected to $114K Before Next Leg Up!Bitcoin is currently consolidating inside a bullish flag pattern on the 4H timeframe. The price could retest the flag support, where the 100 EMA will act as dynamic support. Additionally, there is a CME futures gap at the $114,200 level, which also aligns with the 0.5 Fibonacci retracement level. Therefore, a retest to the $114,200 zone is likely before the next potential upward move.
A potential bullish reversal could occur if BTC retests this zone and confirms a bounce. A breakout from the bullish flag pattern could signal the next leg up.
Cheers
Hexa🧘♀️
BITSTAMP:BTCUSD CRYPTOCAP:BTC
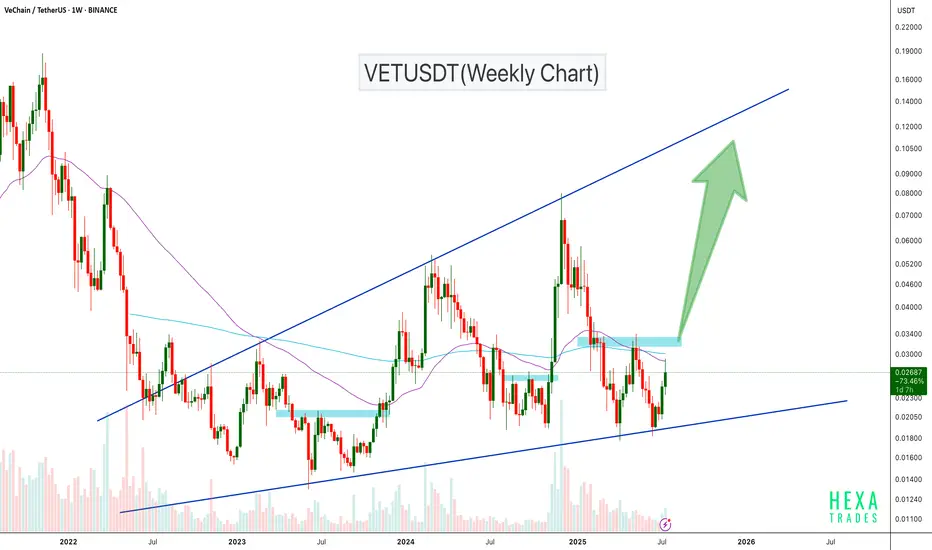
VETUSDT Ascending Broadening WedgeVETUSDT is trading inside a long-term ascending broadening wedge on the weekly chart, with price currently bouncing off major trendline support. After holding this support zone, VET is showing strength and approaching a critical resistance area around $0.033–$0.035.
A breakout above this zone could trigger a strong bullish rally, with potential upside targets in the $0.06–$0.10 range, and even higher toward the wedge top.
Cheers
Hexa
BINANCE:VETUSD NYSE:VET
ETH Healthy Retest Before Next Rally!Ethereum continues to trade within a strong uptrend on the 1-hour chart, respecting the 100 EMA consistently throughout the rally. After a strong impulse move, the price is now consolidating near the recent highs.
ETH price could retest the 0.382 Fibonacci level and the 100 EMA before continuing upward. A successful retest would signal strength and could lead to a bullish continuation toward the $3900 - $4000 range.
Similar historical retests of the 100 EMA led to strong rallies, and we could see a repeat of that pattern if support holds.
Cheers
Hexa
BITSTAMP:ETHUSD CRYPTOCAP:ETH

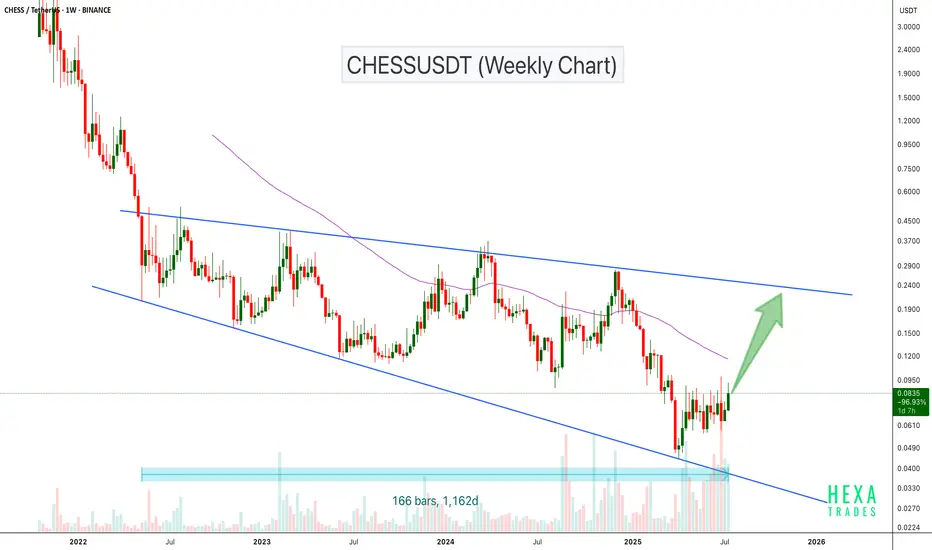
CHESSUSDT Bouncing from Broadening Wedge SupportBINANCE:CHESSUSDT has been trading inside a broadening wedge pattern for the past 1,150 days, showing long-term consolidation. The price recently bounced from the lower support of the wedge with rising volume, a potential sign of a bullish reversal.
If momentum continues, CHESS could move toward the upper wedge resistance in the $0.20–$0.25 range. A breakout above that zone may trigger a much larger trend shift.
Cheers
Hexa
CRYPTO:CHESSUSD
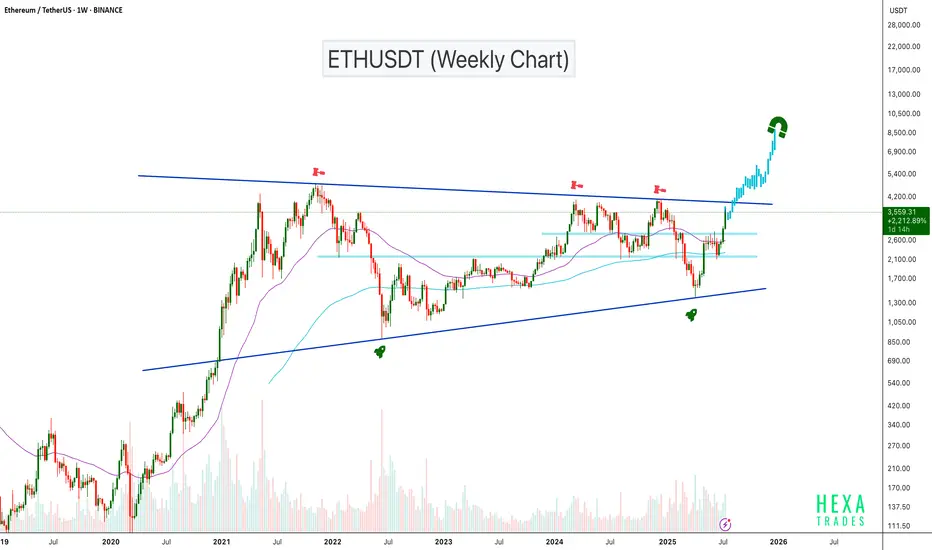
ETHUSDT Gearing Up for Explosive MoveBINANCE:ETHUSDT has been trading inside an ascending triangle pattern for the past 1,600 days. The price is now moving toward the triangle's resistance zone with strong volume support. A confirmed breakout above this resistance could trigger a powerful bullish move, with potential targets in the $6,000–$8,000 range.
Cheers
Hexa🧘♀️
BITSTAMP:ETHUSD
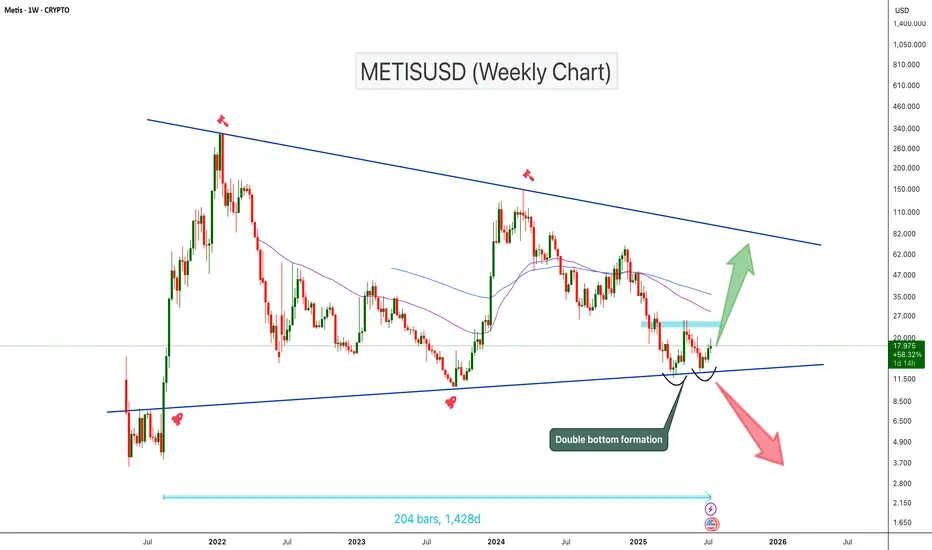
METISUSD Double Bottom at Triangle Support!METISUSD has been trading inside a symmetrical triangle for the past 1,400 days. The price is currently sitting at the triangle support and forming a potential double bottom pattern. The double bottom can be confirmed once the price breaks the neckline resistance zone. If the price breaks this key resistance zone, we could expect a 100%–250% bullish move toward the triangle’s upper resistance
Cheers
Hexa🧘♀️
BINANCE:METISUSDT SEED_DONKEYDAN_MARKET_CAP:METIS
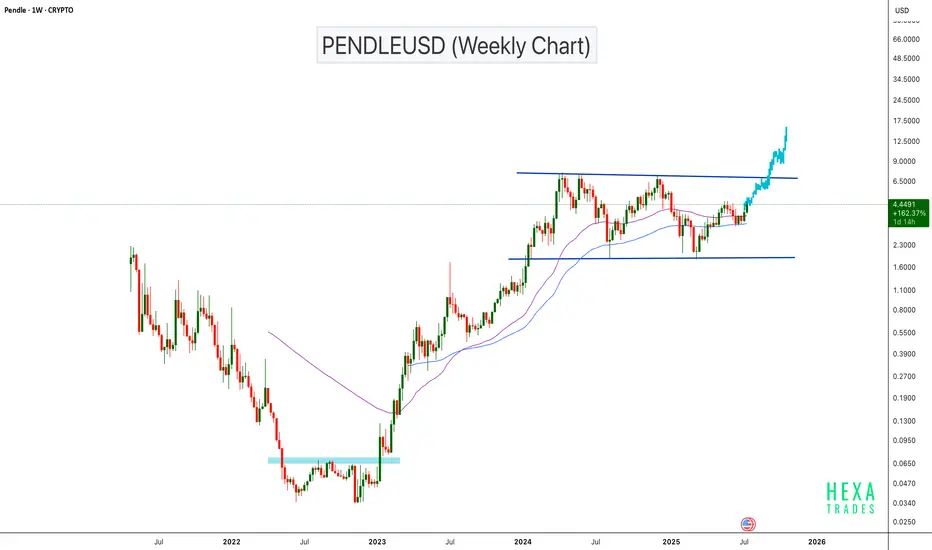
PENDLEUSD Bullish Continuation Setup!BINANCE:PENDLEUSDT has surged approximately 20,000% from its bottom, showing exceptional long-term strength. The price is now approaching a major horizontal resistance zone on the weekly chart. If the price breaks the parallel channel resistance, we can expect a bullish continuation with a psychological target of $15.
Cheers
Hexa
CRYPTOCAP:PENDLE CRYPTO:PENDLEUSD
FLOKIUSDT Breaks Key Resistance – Bullish Continuation Ahead?BINANCE:FLOKIUSDT is trading inside its longest ascending triangle. The price has respected the triangle's support and bounced back. It has now broken a key resistance zone. As seen in the chart, every time the price breaks a major resistance, a bullish move follows, and we can expect a similar scenario this time.
SEED_DONKEYDAN_MARKET_CAP:FLOKI CRYPTO:FLOKIUSD
Cheers
Hexa🧘♀️

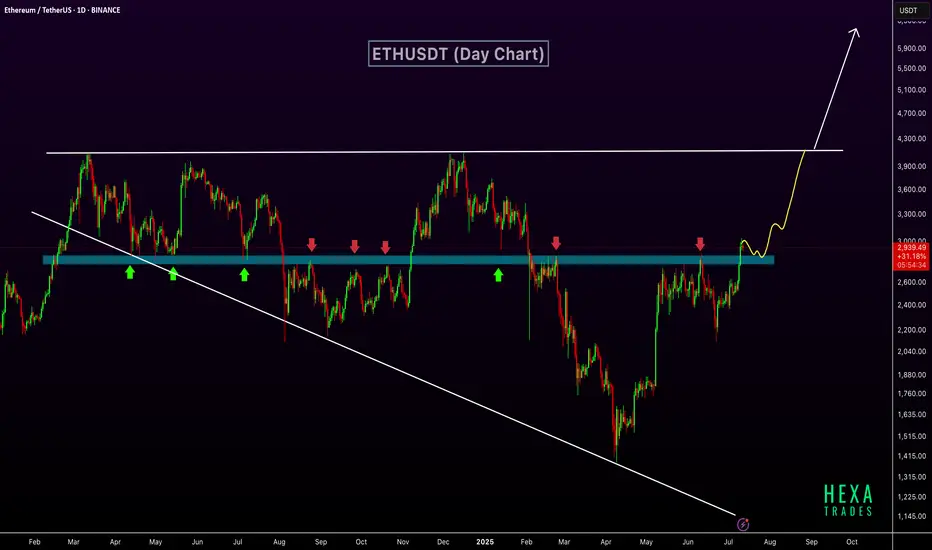
ETH Breaks Key Resistance – $6K Possible if Wedge BreaksETHUSDT has broken out above a key horizontal resistance zone that has historically acted as a strong support and resistance level. This zone, marked in blue, has seen multiple rejections and bounces over the past year, confirming its significance.
The recent breakout above this zone indicates a shift in market structure and suggests growing bullish momentum. The price action shows a clean move above resistance, with potential for a retest before continuing higher. The market is also forming a long-term broadening wedge pattern. The next target lies near the upper resistance of the wedge, around $4,000. If the price breaks above this broadening wedge, it could open the path toward the $6,000 level.
Regards
Hexa
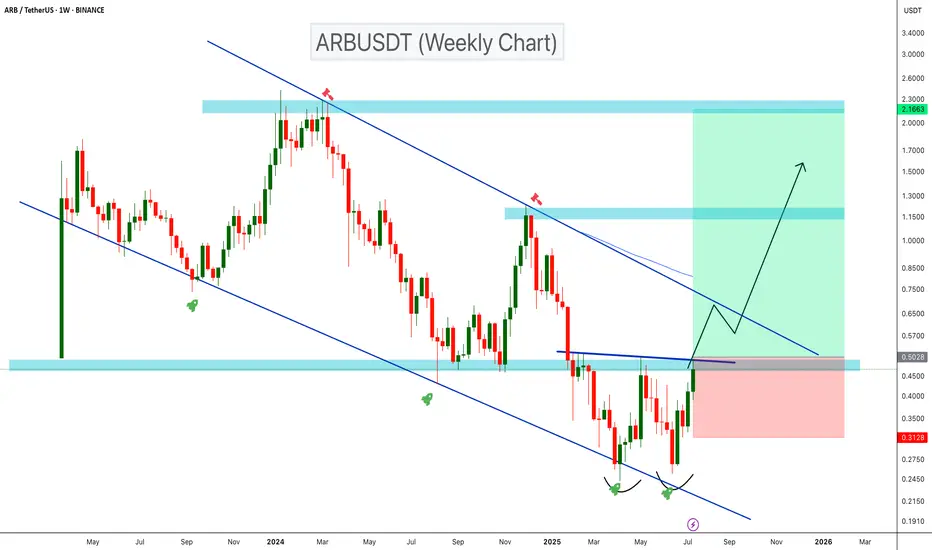
ARBUSDT Double Bottom Signals Bullish Reversal!ARBUSDT is showing a bullish reversal setup on the weekly timeframe after trading within a descending channel for over a year. A clear double bottom has formed near the channel’s lower support, and the price is now breaking above key resistance around $0.50. If this breakout holds, a move toward the upper resistance of the channel and potentially reach the ATH end of this bull run.
Cheers
Hexa
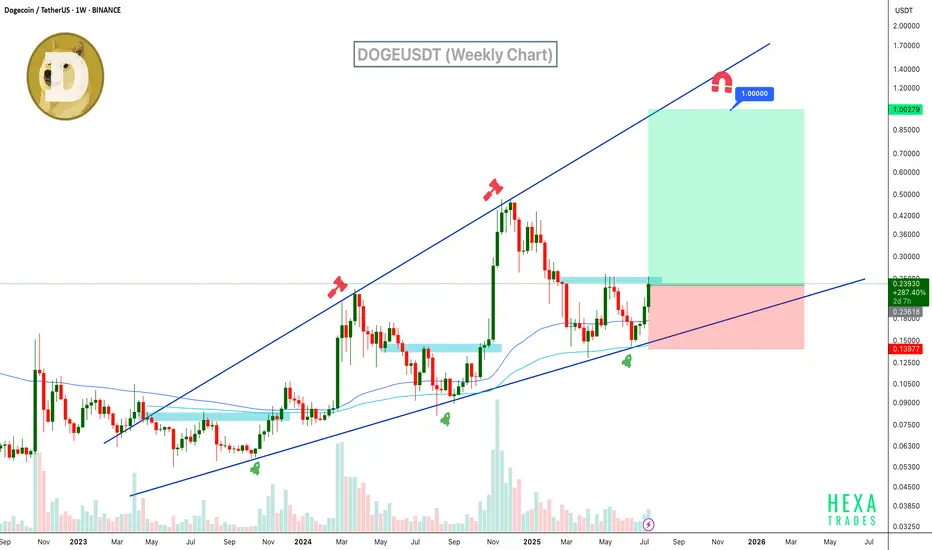
Will DOGE Hit $1? Ascending Broadening Wedge in PlayDogecoin is trading within a clear ascending broadening wedge on the weekly chart. The price has bounced strongly from wedge support and the 100 and 200 EMAs, now pushing upward with growing volume and bullish candles. If momentum sustains, DOGE could rally toward the $1 psychological target and broadening wedge resistance.
Resistance 1: $0.35
Resistance 2: $0.60
Resistance 3: $1.00
Stop Loss: $0.14
Cheers
Hexa
COINBASE:DOGEUSD BINANCE:DOGEUSDT
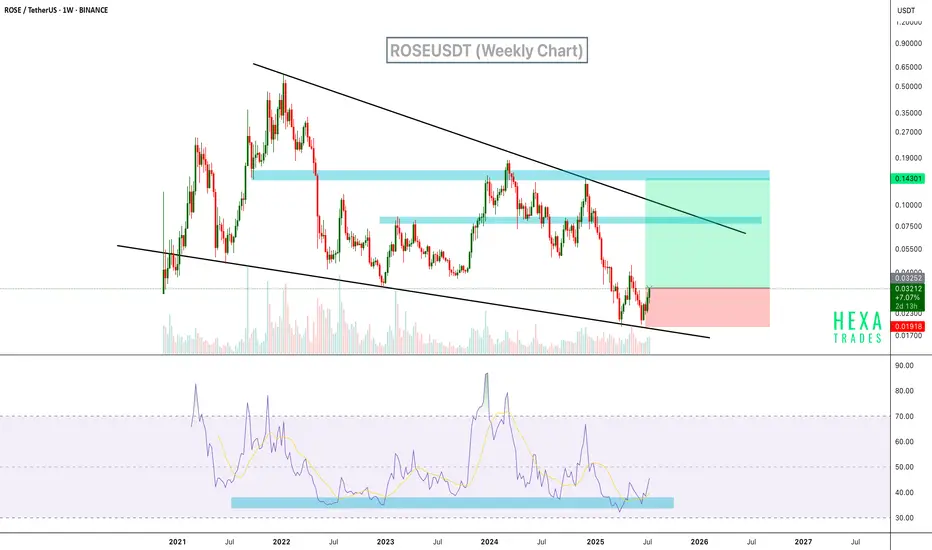
ROSEUSDT Rebounds from Wedge Support BINANCE:ROSEUSDT is currently trading within a long-term descending wedge on the weekly chart, a classic bullish reversal pattern. Price recently bounced off the lower wedge support with strong momentum. Additionally, the RSI indicator has rebounded from a historically strong support zone in the oversold region, which has previously signaled major bottoms.
Resistance 1: $0.048
Resistance 2: $0.075
Resistance 3: $0.145
Cheers
Hexa
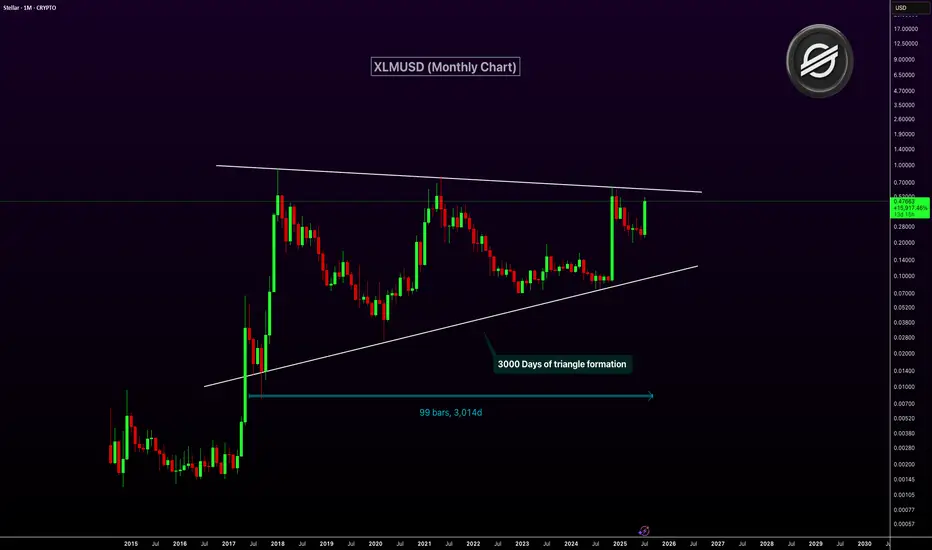
XLMUSD Nearing Breakout After 3,000-Day Triangle FormationXLM has been consolidating inside a massive symmetrical triangle for over 3,000 days. This long-term pattern on the monthly chart dates back to 2017. The price is now approaching the upper resistance trendline of the triangle. A breakout from this structure could ignite a major bullish rally.
The current monthly candle shows strong momentum with over 100% gains. A confirmed breakout above resistance could mark the start of a macro uptrend. This triangle is one of the most significant technical setups in XLM’s history.
Target 1: $1.00
Target 2: $2.50
Target 3: $5.00
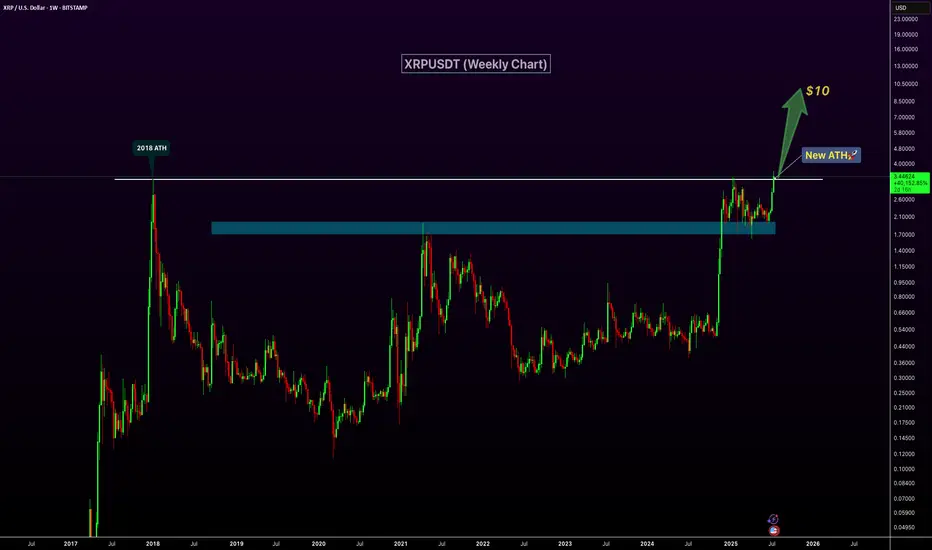
XRP Breaks 2018 High – New ATH Confirmed!XRP has officially broken above its 2018 peak, signaling a major bullish breakout and printing a new all-time high on the weekly chart. The previous resistance zone around $2.6–$3 has now flipped into strong support, confirming the strength of this move. With increasing volume and momentum behind the rally, XRP appears well-positioned for continued upside. The next key psychological target lies at $10, and current price action suggests a clear path toward that level. If bullish sentiment continues, this breakout could mark the beginning of a significant new uptrend.