BTCUSDT: Bounce Incoming?BTCUSDT Technical analysis update
-March 2024 resistance is now expected to act as a strong support level.
-The price has touched the 0.618 Fibonacci retracement level, suggesting a potential reversal from this zone.
-The 200 EMA on the 2-day chart is positioned as a strong dynamic support, reinforcing the bullish case.
We can expect a bounce from the $72-75k level.
Hexatrades

SEI Just Broke Out - Massive Rally Incoming?SEIUSDT Technical analysis update
SEIUSDT is testing a long-term descending trendline, which has acted as strong resistance on multiple occasions. Price has now broken above this level with strong volume, signaling a potential trend reversal. And price trading above 100 and 200 EMA, in the coming trading days, we can see a strong bullish move in SEI
NYSE:SEI

Ethereum Set for a Massive Pump!ETHUSDT Technical analysis update
ETH price has been trading within a channel pattern for the past 30 days, with the 100 and 200 EMA acting as strong support on the 4H chart. Therefore, the likelihood of the price dropping below the 100 and 200 EMA on the 4H chart is very low. Once the price breaks above the channel resistance, we can expect a strong bullish move in CRYPTOCAP:ETH
BITSTAMP:ETHUSD

Bitcoin's 215-Day Pattern: Another Breakout Loading?The Bitcoin chart shows a repeating pattern of consolidation lasting 215 days before each major upward breakout. This cycle has occurred multiple times over the past two years, with each accumulation zone followed by a strong bullish rally.
Currently, Bitcoin is once again emerging from a similar 215-day consolidation phase, suggesting the potential for another significant move to the upside if the pattern holds. If history repeats, we could see a target around $150K.
BINANCE:BTCUSDT CRYPTOCAP:BTC

BTC Correction Likely Before ATHBTCUSDT technical analysis update
BTC price could drop to the GETTEX:89K –$91K range before moving higher. There's a CME futures gap at $90.7K, which may act like a magnet. BTC has strong support around $90K and may see a small pullback before reaching a new all-time high.

THETAUSDT Bounce from Demand ZoneTHETAUSDT has once again respected its long-term support zone, . This area has acted as a reliable demand zone multiple times in the past, leading to strong upward moves. The recent bounce from this level indicates continued buyer interest and potential for a bullish reversal.
If the current momentum sustains, we could see a move toward the $2.00–$2.50 range in the coming months. As long as THETA holds above the support zone, the bias remains bullish.

SNXUSDT Bouncing from Channel SupportSNXUSDT Technical analysis update
SNXUSDT has been trading inside a clear descending channel for the last 1700 days. Recently, the price touched the lower support of the channel and is now showing signs of a bounce.
If the current momentum continues, SNX could move upward toward the upper resistance of the channel. A breakout above the upper trendline would be a strong bullish signal. Until then, the price may stay within the channel.
Price could move 100%-250% in a few months.

VANAUSDT Prepares for Bullish MoveVANUSDT Technical analsysis update
VANA has been forming a symmetrical triangle pattern over the past 90 days on the daily chart. A bullish move is expected once a breakout occurs. Additionally, a bullish MACD crossover happened a few days ago. Let's wait for a breakout above the triangle resistance for bullish confirmation.

MANAUSDT Huge Bounce Incoming?MANA is currently testing a long-term descending support trendline on the weekly chart. This level has acted as a reliable bounce zone multiple times in the past (highlighted with arrows).
-Price is holding above a major support level (~$0.21), showing signs of demand.
-Weekly RSI is forming a bullish divergence, with higher lows on RSI vs. lower lows on price — often a precursor to trend reversals.
-Previous touches on this trendline have led to significant rallies.

FLOKI at Key Support – Is a Bounce Coming?The price of FLOKI has dropped back to an important level where it used to face resistance before going up. Now, this same level is acting as support, which could lead to a bounce.
We also see a bullish divergence on the RSI, It often signals that selling is slowing down and a reversal might be coming.
If the price holds above this support zone, we might see a bounce toward the $0.09 to $0.11 area.
If the price breaks below the support, the idea may not work, so it’s important to manage risk.

PNUTUSDT Ready to Rally!PNUTUSDT Technical analysis update
PNUTUSDT is breaking out of a wedge pattern on the daily chart after three months of formation. We also observed a bullish RSI divergence in the daily timeframe, along with a MACD bullish crossover a few days ago. A 50–100% move could be seen in the mid-term.

VINEUSDT Approaching Bullish BreakoutVINEUSDT Technical analysis update
VINE has formed a triangle pattern at the bottom, and the price is about to break the triangle resistance. The 100 and 200 EMA are also about to form a bullish crossover. A bullish confirmation will occur once the price breaks out of the triangle formation.

Bitcoin bull run ends in 6 months?The above chart presents a macro view of Bitcoin’s monthly price action, showcasing the historical pattern of bull and bear market cycles. Each green box highlights a bull run lasting approximately 35 months (or 1,066 days), a consistent duration seen in the previous two cycles from 2015–2018 and 2019–2022. The current cycle, which began in late 2022 or early 2023, is now entering its final phase, suggesting that if the pattern holds, the BTC bull run may have around 5–6 months remaining before a potential peak.
The price action continues to mirror previous cycles, indicating that history may once again be repeating itself. If this cyclical behavior continues, traders and investors should consider the possibility of a cycle top approaching and plan accordingly,.

TIAUSDT Bottoming Out?TIAUSDT Technical analysis update
TIAUSDT has been trading within the longest descending channel. The price has once again touched the channel support and also retested the November 2023 support level or bottom. A strong bounce from this zone is likely, and we could potentially see a 100–150% move from the current level.

DENT at Strong Support – Bounce Ahead?DENTUSDT is trading at a strong support level on the weekly chart. This same area has been tested several times in the past, and each time the price bounced back up. Once again, the price has reached this support zone and is starting to show signs of a possible bounce.
As long as the price stays above this support area (around 0.00050–0.00060 USDT), there's a good chance we could see a bounce or even a trend reversal. But if the price breaks below this level, it could drop further. Right now, this is an important level to watch for a possible move up.

Bitcoin Holding Strong — Next Stop: $150K?BTCUSDT Technical analysis update
BTC price is currently retesting its major support zone, which was previously a strong resistance area, now acting as support at the $70K–$75K level. The price has just touched the $75K support zone, and we can expect a consolidation above the $70K level followed by a potential bounce back or a V-shaped recovery from the current level.if we see a strong bounce from the current support level, the next potential target could be around $150K

MEWUSDT Approaching a Breakout!MEWUSDT Technical analysis update
-MEWUSDT is trading within a pennant pattern on the daily chart.
-The price is currently above the 100 and 200 EMA.
-A bullish crossover between the 100 and 200 EMA could occur soon.
-There has been a notable increase in trading volume in recent days.
-The price is approaching a key resistance level on the volume profile and may break out soon.

FETUSDT at Key Support with Bullish Indicators!FETUSDT Technical analysis update
FET/USDT is currently trading at its major support zone. Key observations:
-The resistance from March 2022 and March 2023 is now acting as support.
-The daily chart's RSI has dropped below 30, indicating oversold conditions.
-A bullish MACD crossover has occurred below the histogram.
-A bullish divergence is visible in the RSI on the daily chart.

LQTYUSDT Bouncing Back!LQTYUSDT Technical analysis update
LQTYUSDT has bounced off a strong support zone, the same level where it previously showed a strong rebound. A bullish RSI divergence is visible on the daily chart, suggesting a potential bullish move from the current levels.
Buy zone : Below $0.76
Stop loss : $0.625

Bitcoin’s Monthly RSI Nearing Danger Zone – Time to Sell?The chart above illustrates Bitcoin’s price action alongside the Relative Strength Index (RSI) on a monthly timeframe, which helps identify overbought and oversold conditions. Historically, Bitcoin’s major bull cycle peaks in 2013, 2017, and 2021 coincided with the monthly RSI reaching between 85-95, as highlighted by the blue circles. A downward trendline connects these peaks, suggesting that each cycle has seen slightly lower RSI highs, indicating a potential long-term momentum decline.
Currently, the RSI is approaching this historical resistance zone, signaling that Bitcoin may be nearing its market peak. If this trend continues, it could mark the final phase of the bull run, making it a strategic period for profit-taking. Traders should closely monitor RSI behavior, as a rejection from this level could indicate the start of a correction.
Historically, a monthly RSI of 85-95 has been a strong sell signal, marking the end of Bitcoin’s bull markets. If Bitcoin follows this pattern again, a distribution phase followed by a downturn could be expected.

Bitcoin's 1065-Day Bull Run Nearing Its End – A Cycle ComparisonThis chart illustrates Bitcoin’s historical price action over three major market cycles, each lasting approximately 1065 days (35 months). The pattern suggests that Bitcoin follows a well-defined four-year cycle, influenced by its halving events. Each cycle begins with a bearish phase (marked in red), followed by a strong uptrend (green), leading to a peak before another correction phase starts.
A key observation is that the duration of each bull run remains consistent, lasting around 35 months (~1065 days) before reaching its peak. Historically, Bitcoin has followed a similar trajectory, with price action mirroring previous cycles. If this pattern holds, the current bull run may reach its peak within the next 6-8 months, placing the market top around late 2025.
Additionally, past cycles show that altcoins tend to experience their strongest moves after Bitcoin peaks, meaning an altseason could emerge by Q3–Q4 2025.

Bitcoin RSI Dips Below 30 Again!The above chart highlights Bitcoin's price action alongside the Relative Strength Index (RSI) on a daily timeframe. Historically, every time the RSI dropped below 30, indicating oversold conditions, Bitcoin experienced a price bounce shortly after. The chart marks these moments with blue circles and green arrows, showing clear upward reversals following each dip. Currently, Bitcoin's RSI has once again fallen below 30, with the price around $87,000 after a sharp 10% drop. If past patterns hold true, this could signal an upcoming bullish reversal.

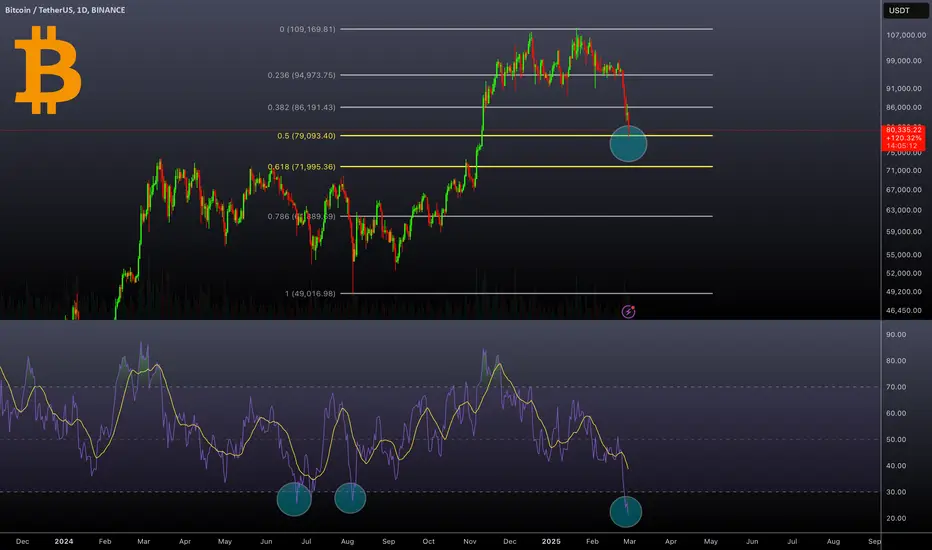
Bitcoin- Fibonacci Retest and Oversold RSIBitcoin's daily chart shows a significant price retracement, currently testing the key 0.5 Fibonacci level around $79,000. This level historically acts as a strong support zone during corrective phases. If BTC holds above this level, it could signal a potential rebound. However, if it breaks lower, the next major support is near $72,000 (0.618 Fibonacci level).
Additionally, the Relative Strength Index (RSI) has dropped to the 20 level, indicating extreme oversold conditions. Historically, such low RSI readings have led to strong reversals. If buying pressure emerges, BTC could see a recovery from these levels.
Regards
Hexa