HFTUSDT 1D AnalysisHFT ~ 1D Analysis
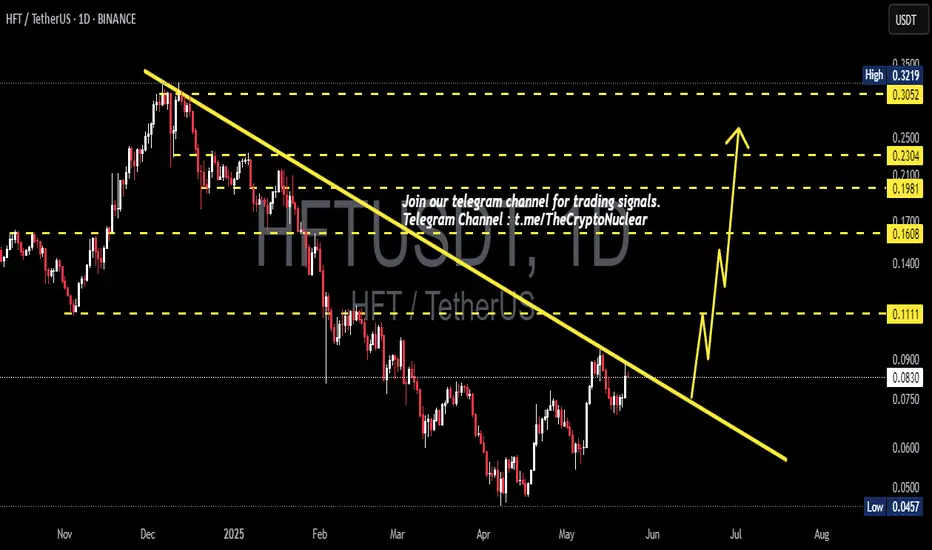
#HFT Buy after successfully breaking through this resistance line if you still have confidence in this coin with a short-term target of at least 10%+.
Hftsignals
Downtrends Finding Support for the Next Uptrend: AMAT ExampleNASDAQ:AMAT was over-speculated in 2023 and then had a top formation that trended down starting in July 2024. This is still considered technically to be an intermediate-term trend correction. The selling started at an all-time high.
HFTs are constantly in the mix, selling down. However, the shift of sentiment has started and there are gaps up recently.
It is NOT in a buyback mode but the stock is finding support from the 2021 highs, which is strong support. This should provide the basis for the beginning of a bottom formation.

HFTUSDTHFT ~ 3D
#HFT trying to break out this descending pattern. Wait for this descending pattern to be successfully broken, and you can make purchases gradually. If you have Conviction on this coin.

#HFT (SPOT) entry range (0.1200- 0.1590) T.(0.3950) SL(0.1113)BINANCE:HFTUSDT
entry range (0.1200- 0.1590)
Target1 (0.2430)- Target2 (0.3060)- Target3 (0.3950)
3 Extra Targets(optional) in chart, if you like to continue in the trade with making stoploss very high.
SL .1D close below (0.1113)
*** collect the coin slowly in the entry range ***
**** #Manta ,#OMNI, #DYM, #AI, #IO, #XAI , #ACE #NFP #RAD #WLD #ORDI #BLUR #SUI #Voxel #AEVO #VITE #APE #RDNT #FLUX #NMR #VANRY #TRB #HBAR #DGB #XEC #ERN #ALT #IO #ACA #HIVE #ASTR #ARDR #PIXEL #LTO #AERGO #SCRT #ATA #HOOK #FLOW #KSM #HFT ****

