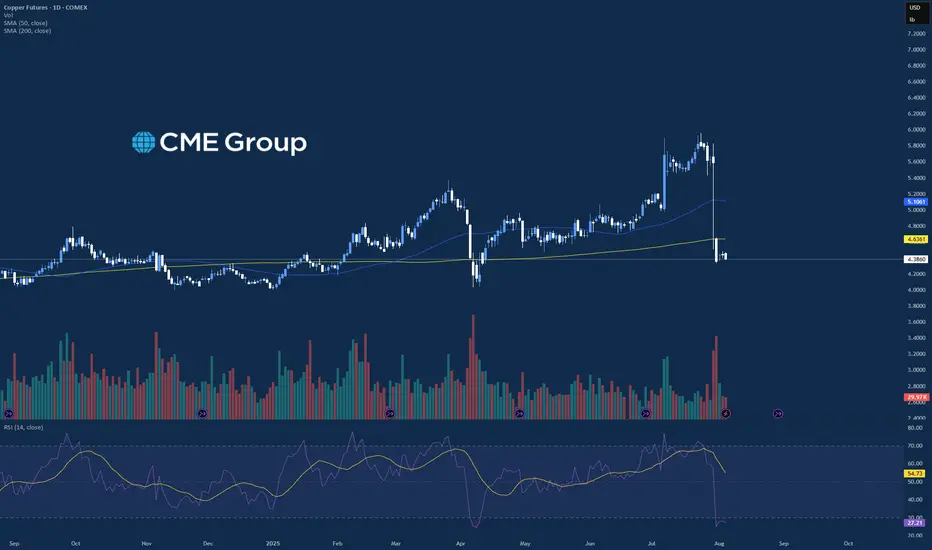
Copper establishing a baseFollowing the big drop in copper prices on the back of news at the end of July that Trump's tariff excludes refined metal, prices have started to stabilize near the lows, suggesting a potential recovery could be on the cards.
Copper prices dropped by the largest on July 30 after Trump excluded refined metal from his planned import tariff.
Dip-buyers are starting to step back in now, with prices now finding their footing around $4.40 area, which itself was a prior demand zone from early April.
Short-term resistance around $4.50 has provided a short-term ceiling but if that breaks then we could see a quick recovery towards the 200-day average first, ahead of potentially $5.00 in the coming weeks.
By Fawad Razaqzada, market analyst with FOREX.com
Hg1

Strength in Precious Metals ContinuesThere was a good mix in price action across many asset classes on the day today where the precious metals traded higher led by the Silver market, which traded up near 1.3% on the day. There was a mixed set of data being released today with manufacturing data and PMI, and the S&P and Nasdaq finished the day lower. Over the past few weeks, there has been significant volatility in the precious metals looking at Gold, Silver, and Copper, and the last few trading days Gold and Silver have strung together a few positive days in a row. Both Gold and Silver have been trading at or near all time high prices and have been able to hold at these levels even with slight selling pressure.
Copper on the other hand has continued to struggle after the 50% tariff on all imports was announced last week, and the market has dropped from “overbought” to “oversold” levels on a daily basis in a matter of a few days. There will be a good amount of earnings coming out for the remainder of the week that could add additional volatility to the equity indices along with the precious metals to wrap up the week.
If you have futures in your trading portfolio, you can check out on CME Group data plans available that suit your trading needs tradingview.com/cme/
*CME Group futures are not suitable for all investors and involve the risk of loss. Copyright © 2023 CME Group Inc.
**All examples in this report are hypothetical interpretations of situations and are used for explanation purposes only. The views in this report reflect solely those of the author and not necessarily those of CME Group or its affiliated institutions. This report and the information herein should not be considered investment advice or the results of actual market experience.
Copper: Trump Signs Tariffs on Imports Amid National Security...President Donald Trump signed a proclamation on Wednesday that imposes tariffs on copper imports, citing concerns over national security.
The White House announced that the new policy will introduce a 50% tariff on semi-finished copper products and other copper-derived goods that are highly dependent on the metal.
These tariffs are scheduled to come into effect on August 1, as outlined in a White House fact sheet.
In terms of market dynamics, copper is currently within a monthly demand zone, with a daily demand area also identified for setting pending orders. The potential impact on prices could be twofold: a possible upward movement driven by the discount effect on the metal, or continued decline following President Trump's announcement.
What are your thoughts on how these tariffs might influence copper prices moving forward?
✅ Please share your thoughts about HG1! in the comments section below and HIT LIKE if you appreciate my analysis. Don't forget to FOLLOW ME; you will help us a lot with this small contribution.

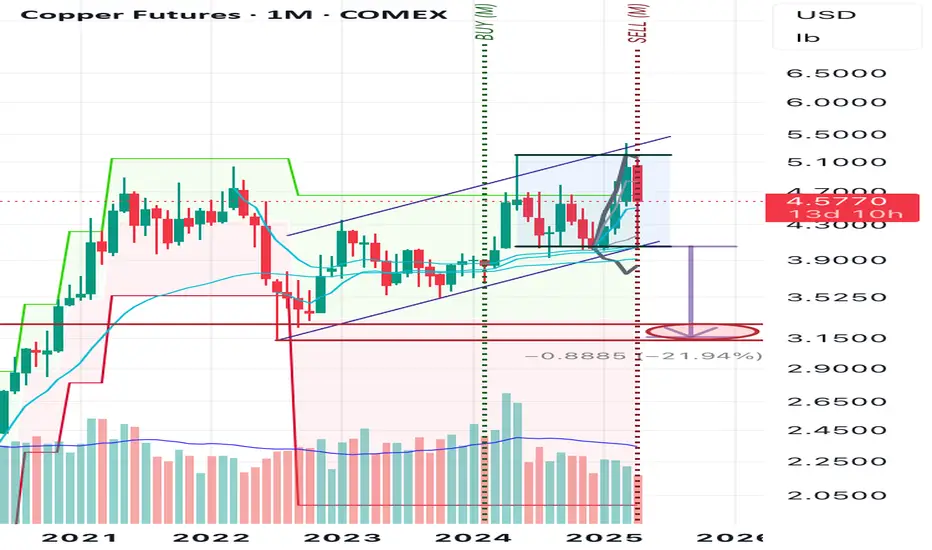
COPPER Top of 4-year Rising Wedge. Sell.Copper (HG1!) eventually followed the bearish break-out signal we gave on our last analysis (April 03, see chart below) and within 2 days it hit our 4.1250 Target:
Right now the price sits at the top of the 4-year Rising Wedge pattern and on the 1W time-frame it is a textbook technical sell signal.
With the 1W RSI also rejected on a Lower Highs trend-line, we are looking to aim for the 1W MA50 (blue trend-line) at least. Every Bearish Leg since the July 11 2022 Low, reached at least its 0.618 Fibonacci retracement level before rebounding again.
As a result, our Target is 4.700, which given a fair 3-month time-frame, should be at the time marginally below the 1W MA50, in line with all previous bottoms of the Rising Wedge.
-------------------------------------------------------------------------------
** Please LIKE 👍, FOLLOW ✅, SHARE 🙌 and COMMENT ✍ if you enjoy this idea! Also share your ideas and charts in the comments section below! This is best way to keep it relevant, support us, keep the content here free and allow the idea to reach as many people as possible. **
-------------------------------------------------------------------------------
💸💸💸💸💸💸
👇 👇 👇 👇 👇 👇

Bullish Consolidation After the copper market exploded higher on the Trump Administration’s 50% tariff headline, the market has been quietly consolidating above the breakout level at 5.33. While above this level the risk is higher, and in case of a break back below the 5.30 level, the risk would be a larger retracement. This would likely be caused by the Trump Administration abandoning that threat of a 50% tariff.

Copper: Event-driven Trade Idea on Recent TariffsCOMEX: Micro Copper Futures ( COMEX_MINI:MHG1! ), #microfutures
The Event
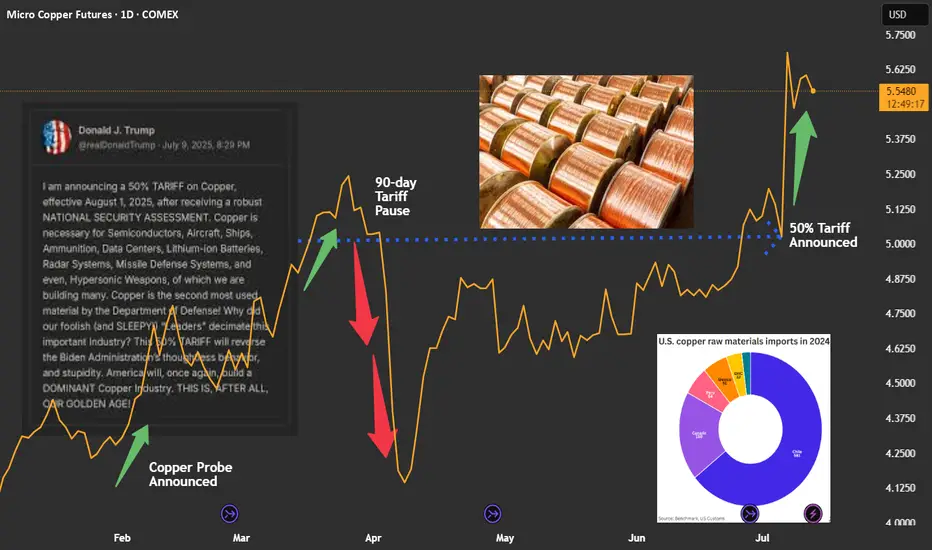
On July 9th, President Trump announced that he would impose a 50% tariff on imports of copper, effective August 1st.
The decision was based on national security assessment. Copper is the second most used material by the U.S. Department of Defense. The President intents to use tariffs to reduce reliance on imports and shore up support for domestic production.
Immediate Market Reaction
U.S. copper prices ended Tuesday’s session over 13% higher — the sharpest single-day gain since 1989. The September COMEX copper futures contract was settled at $5.584 a pound on Friday, up 35.7% year-to-date.
Due to tariffs, Copper in the U.S. is priced at a large premium over international markets.
• UK: LME copper contract was quoted at $9,660.5 per ton on Friday.
• China: SHFE coper futures was settled at RMB 78,420 per ton. It can be converted to $10,959.4 via the Dollar/RMB exchange rate of 7.1555.
• US: COMEX copper quote of $5.584 can be converted to $12,312.7 per ton.
• As of Friday, COMEX copper is priced at a 27.5% premium over LME copper, and a 12.3% premium over SHFE copper.
The U.S. Copper Market
The U.S. Geological Survey reports that the 2024 total refined copper consumption was 1.8 million metric tons. Of which, 850,000 tons were from mining, 150,000 tons were refined from scrap, and 810,000 tons from imports.
Chile is the biggest source of U.S. copper imports, accounting for 581,000 tons, or 71.7% of total imports. Canada is the second largest, for 169,000 tons, or 20.9%.
Copper is a widely used base metal, found in products ranging from machinery, electronics, household goods, housing, infrastructure projects, to aircraft and missiles.
Since President Trump announced a probe into copper in February, traders have been poised for a hike on copper duties, leading to major shifts in inventories away from Europe and Asia and into the U.S.
The Next Event: Will the Copper Tariffs get postponed or reduced?
The goal to increase domestic production of copper is very challenging. It will take years to ramp up and decades to fully meet demand — at a massive upfront investment cost.
Hiking the import duties would not help national security. It could not change the fact that the biggest copper mines are in Chile, Peru and Canada. A sharp increase in the cost of copper will quickly translate into wide-ranging inflation in the U.S.
In my opinion, once the Trump administration realizes the full impacts, we could possibly see a crawl-back from the intended copper tariffs. The effective date would be postponed, the tariff rate could be reduced, and many companies may get exemption/waiver. We have seen similar maneuvers happening multiple times in the past few months.
Overall, the actual impact of copper tariffs will be much smaller than the original announcement.
Shorting COMEX Copper Futures
Historically, the price difference between COMEX and LME coppers has been near-zero and was around the $150 level in 2024.
Since February, COMEX copper has been trading at $500-$1,500 premium over LME. As of Friday, COMEX copper futures have gone up 35% this year and are now priced at $2,652 per ton above LME copper.
In my opinion, these price differences reflect no economic fundamentals. It is purely due to the ever-changing global tariff conflict. If President Trump rescinds his tariff narratives, we could likely see a large drop in COMEX copper prices.
A trader sharing this view could explore shorting the COMEX Micro copper ( GETTEX:MHG ).
Last Friday, the September micro copper futures contract (MHGU5) was settled at 5.5910. Each contract has a notional value of 2,500 pounds of high-grade copper, or a market value of $13,977.5. To buy or sell 1 contract, a trader is required to post an initial margin of $1,100. The margining requirement reflects a built-in leverage of 12.7-to-1.
Let’s use a hypothetical trade to illustrate how to use a short futures position to take advantage a potential reduction on copper tariffs.
Hypothetical Trade:
• Short 1 MHGU5 contract at 5.5910, and set a stop loss at 6.00
• Trader pays $1,100 for initial margin
Scenario 1: Tariffs go into effect, copper rises to $6.57
• Futures reflect a 50% premium over current LME copper price, which is at $4.38 per pound
• Short order stop loss at 6.00, and the maximum loss is $1,022.5 (= (6-5.591) x 2500)
• The trader loses most of the margining fund, but owes no more
Scenario 2: Trump Rescinds Tariffs, Copper falls to $4.38
• COMEX copper will be priced at No premium over LME
• Short position gains: $3,027.5 (= (5.591-4.38) x 2500)
• The hypothetical return will be 275.2% (= 3027.5 / 1100)
The above scenarios show that
• When copper falls, short position will have higher returns due to its leverage nature.
• When copper rises, the stoploss will kick in to set maximum losses.
The above trade idea could be deployed using the standard-size Copper Futures contract. Its notional value is 25,000 tons, which is 10 times bigger than that of the micro contract. The initial margin is $11,000. The standard-size contract is more liquid. On Friday, it had a total volume of 60,313 contracts, and an open interest of 221,682.
Happy Trading.
Disclaimers
*Trade ideas cited above are for illustration only, as an integral part of a case study to demonstrate the fundamental concepts in risk management under the market scenarios being discussed. They shall not be construed as investment recommendations or advice. Nor are they used to promote any specific products, or services.
CME Real-time Market Data help identify trading set-ups and express my market views. If you have futures in your trading portfolio, you can check out on CME Group data plans available that suit your trading needs www.tradingview.com
XCU/USD: Low-Risk Loot Opportunity!🔥 THE COPPER HEIST: XCU/USD Robbery Plan (Swing/Day Trade) 🔥
🌟 Attention, Market Robbers & Money Makers! 🌟
(Hola! Oi! Bonjour! Hallo! Marhaba!) 🤑💰💸✈️
Based on the 🔥Thief Trading Style🔥, here’s our master heist plan for the XCU/USD "The Copper" Metals Market! This is a high-probability long setup, but we must escape before the police (bears) set their trap near the red zone! 🚨📉
📌 THE HEIST BLUEPRINT
✔ Entry Strategy (Breakout or Pullback)
✔ Stop Loss (Protect Your Loot!)
✔ Target (Escape Before the Cops Arrive!)
🚀 ENTRY: TIME TO STRIKE!
"The heist is ON! Wait for the ATR breakout (5.00000) before moving!"
Option 1: Place Buy Stop orders above the Moving Average.
Option 2: Use Buy Limit orders on pullbacks (15m/30m recent swing lows).
📢 ALERT! Set a breakout alarm—don’t miss the move!
🛑 STOP LOSS: PROTECT YOUR LOOT!
"Yo, listen up! 🗣️ If you're entering on a Buy Stop, DON’T set your SL until AFTER the breakout!
📍 Thief SL Placement: Recent swing low + Moving Average (5H TF) → 4.80000
⚠️ WARNING: If you ignore this, you’re playing with fire! 🔥 (Your risk, not mine!)
🎯 TARGET: CASH OUT & ESCAPE!
🏴☠️ First Take-Profit: 5.25000 (or exit early if the market turns!)
💰 Scalpers: Only trade LONG—use trailing SL to lock in profits!
📊 MARKET STATUS: NEUTRAL (But Bullish Potential! 🐂)
Fundamentals? Check COT Reports, Macro Data, Geopolitics, News Sentiment!
🔗 Links in bio0 for full analysis! 👉🌎📰
🚨 TRADING ALERT: NEWS = VOLATILITY!
⚠️ Avoid new trades during major news!
🔒 Use Trailing SL to protect open positions!
💥 BOOST THIS HEIST PLAN!
Hit 👍 LIKE & 🔄 SHARE to strengthen our robbery squad!
🚀 More heists coming soon—stay tuned! 🤑💎
🎯 FINAL WORD:
"Take profits, treat yourself—you deserve it! 💸🏆"

Copper: Cycle TopLooking at Copper, is back near the highs due to tariffs. Miners are probably producing more, but industrial buyers won’t keep paying these high prices forever. That’s usually when investors get hurt.
Current phase its a cycle top IMO.
GH

Lundin Mining Outlook - Copper trade - Coming monthsIm getting really bullish on this stock. With a few copper mines left in the world with tiny lifespans, Lundin mining comes in with copper mines that will deliver for the next 15-20 years. Taking advantage of these high copper prices in the coming raging bull market.
If the price close above the upper resistance line then it will most likely take off. Eventually we will most likely get a pullback to make the resistance line to a support level. Im using DCA method for entry on this one.
Always make your own analysis and your own decision. Don´t see this as a financial advice. I only show you what I do. Nothing else.
OMXSTO:LUMI
CMCMARKETS:COPPERN2025
COMEX:HG1!
OANDA:XCUUSD
CAPITALCOM:COPPER

Ready to Rob the Copper Market? XCU/USD Heist Plan Revealed!🌍 Hello Global Traders! 🌟
Money Makers, Risk Takers, and Market Shakers! 🤑💸✈️
Dive into our XCU/USD "Copper" Metals Market heist, crafted with the signature 🔥Thief Trading Style🔥, blending sharp technicals and deep fundamentals. Follow the strategy outlined in the TradingView chart, focusing on a long entry targeting the high-risk Yellow ATR Zone. Expect a wild ride with overbought conditions, consolidation, and potential trend reversals where bearish players lurk. 🏆💰 Celebrate your wins, traders—you’ve earned it! 💪🎉
📈 Entry: Storm the Vault!
The market’s ripe for a bullish grab! 💥 For Pullback trade place buy limit orders within the most recent 15 or 30-minute swing low/high levels. Set alerts on your chart to stay locked in. 🔔
🛑 Stop Loss: Guard Your Loot!
Set your Thief SL at the nearest swing low on the 3H timeframe for day/swing trades. Adjust based on your risk tolerance, lot size, and number of orders. Safety first! 🔒
🎯 Targets: Claim Your Prize!
🏴☠️ Short-Term Target: 5.10000
👀 Scalpers, Listen Up!
Stick to long-side scalps. Got deep pockets? Jump in now! Otherwise, join swing traders for the heist. Use trailing stop-loss to lock in gains and protect your stash. 💰
🐂 Why XCU/USD "Copper" is Hot!
The Fiber’s bullish surge is fueled by key fundamentals. Dive into Macro, COT Reports, Quantitative Analysis, Sentiment, Intermarket trends, and future targets via the linkss below for the full scoop. 👉🔗. Stay informed to stay ahead! 📰
⚠️ Trading Alert: News & Position Management
News releases can shake the market like a heist gone wrong! 🗞️ To protect your profits:
🚫 Avoid new trades during news events.
🛡️ Use trailing stops to secure running positions.
💥 Boost the Heist!
Hit the Boost Button to supercharge our Thief Trading Strategy! 💪 Every click strengthens our crew, making it easier to swipe profits daily. Join the squad, trade smart, and let’s make money rain! 🌧️💵

The relationship between gold, copper and the US10YFirst, can you tell me what you think the relationship between these two curves is? Clearly, these two curves have a strong negative correlation, meaning they move exactly opposite to each other. You can see in the image that their behavior is like a mirror image (from 2007 to before 2022).
You are familiar with the gold-to-copper ratio, right? Now, when this gold-to-copper ratio curve rises, it means that gold is giving better returns compared to copper. This indicates that the global economy is moving away from growth and heading toward a recession. Investors, instead of investing in production (where copper symbolizes production), choose to invest in a safe haven like gold. The opposite happens when this curve goes down.
The lower curve represents the yield on long-term U.S. bonds. When this curve is rising, it means that the supply of bonds is greater than the demand. People are selling bonds, which causes the bond yield to rise. When the curve is falling, it means people are buying bonds, which causes the bond yield to drop.
Why do these two curves move in opposite directions?
Now, let’s get to the main question. The answer to this question is simple: bonds, like gold, serve as a safe haven for investors. When the economy moves toward a recession (when gold offers better returns than copper, and the gold-to-copper ratio is rising), some investors shift towards bonds, and the yield curve drops. That’s why these two curves move in opposite directions.
To summarize the entire story: Movement toward recession = investors moving toward gold and bonds = rise in the gold-to-copper ratio and drop in bond yield curve.
Now it’s clear why these two curves move opposite to each other. The big surprise is coming👇
Since the beginning of 2022, the historical trend has changed. These two curves have started to show a positive correlation! Meaning, everything I mentioned above has gone out the window! Now, the question is: What suddenly happened? There are several analyses, but I believe what changed is that U.S. bonds are no longer a safe haven for investors, as they once were (the same fear signal I mentioned earlier). In fact, after the pandemic, the world has never been the same. This is an important development and it affects many things. I’ve addressed this topic from various perspectives before, and here’s a new angle on it.
For the past two to three years, contrary to the historical trend, investors have been buying gold but selling bonds, and these two curves have been rising together.
As you can see, the analytical situation has changed drastically compared to, say, 10 years ago, and many fundamental facts have shifted. For instance, many people expect the Federal Reserve to lower interest rates and gold to go up again, but after an initial short shock, the story will probably reverse.
#Gold #XAUUSD #HG1!

Mid-Week Market Forecast: GOLD, SILVER, COPPER & PLATINUMIn this video, we'll present analysis and best setups for Wednesday, April 22nd to the end of the week.
Gold is still a buy.
Silver may present a sell opportunity at current levels.
Copper looks like it is setting up for a valid sell.
Platinum has showed weakness early this week. We'll watch for continuation.
Be patient, and wait for confirmations!
Enjoy!
May profits be upon you.
Leave any questions or comments in the comment section.
I appreciate any feedback from my viewers!
Like and/or subscribe if you want more accurate analysis.
Thank you so much!
Disclaimer:
I do not provide personal investment advice and I am not a qualified licensed investment advisor.
All information found here, including any ideas, opinions, views, predictions, forecasts, commentaries, suggestions, expressed or implied herein, are for informational, entertainment or educational purposes only and should not be construed as personal investment advice. While the information provided is believed to be accurate, it may include errors or inaccuracies.
I will not and cannot be held liable for any actions you take as a result of anything you read here.
Conduct your own due diligence, or consult a licensed financial advisor or broker before making any and all investment decisions. Any investments, trades, speculations, or decisions made on the basis of any information found on this channel, expressed or implied herein, are committed at your own risk, financial or otherwise.

Bearish COPPER Price target equivalent to the width of the prior range, 3.10$/3.30$. Fundamentals signaling a recession. 4.38$, SMA 200 days, is the level to hold
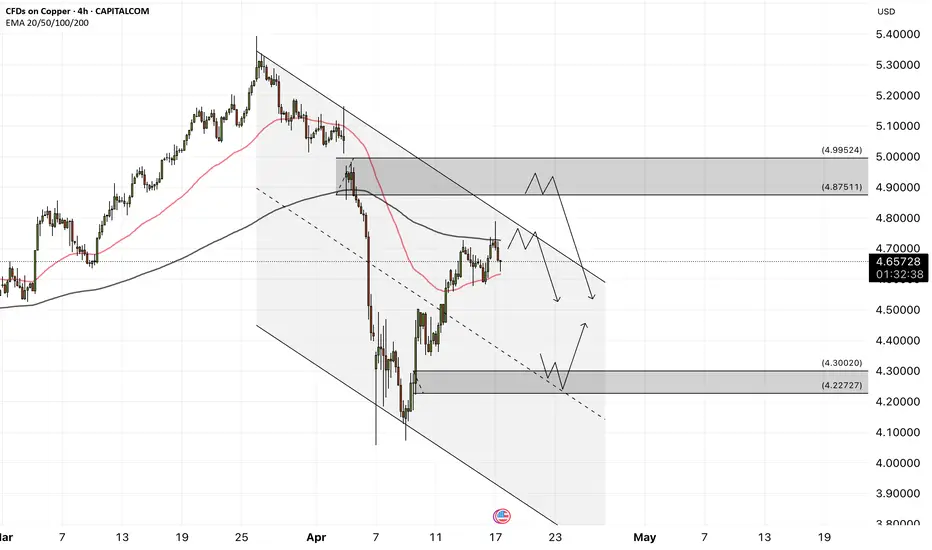
Copper: Markets are waiting for the continuation of trade tensioCopper is located between the EMA200 and EMA50 on the 4-hour timeframe and is moving in its descending channel. An upward correction of copper will provide us with a good risk-reward selling position. If the downward trend continues, we can buy copper at the next demand zone.
The World Trade Organization (WTO) has significantly downgraded its outlook for global merchandise trade in its latest report, now forecasting a 0.2% contraction in 2025. Previously, it had projected a 3% growth. The organization warned that if the United States fully enforces its reciprocal tariffs and their effects intensify, global trade could shrink by as much as 1.5%.
While the temporary suspension of some tariffs recently announced by Washington has somewhat eased the downturn in trade, the WTO emphasized that substantial downside risks remain. However, for 2026, the organization painted a more optimistic picture, anticipating a moderate 2.5% rebound in trade growth.
In a pointed address, Chinese Vice Premier He Lifeng sent a clear message to the international community, especially the U.S., asserting that China has no intention of backing down and will stand firm if its interests are threatened. His remarks came as a new wave of heavy U.S. tariffs—including duties as high as 245% on certain Chinese exports—has reignited tensions between the two economic powers.
He Lifeng affirmed that China remains a reliable trade partner for the world. He also announced increased government support for Chinese businesses engaged in foreign trade and encouraged them to leverage opportunities at the Canton Fair and explore broader global markets. According to him, China’s vast domestic market could become a key destination for high-quality imported goods.
Alongside these economic and diplomatic messages, Chinese officials’ rhetoric has turned more confrontational in response to recent U.S. actions. He dismissed what he called the U.S.’s “numerical games” and warned that China’s response to threats would be decisive. Stressing the importance of a healthy business environment, he urged officials to implement supportive policies effectively, ensuring foreign trade and economic activity proceed with greater transparency, efficiency, and ease.
Meanwhile, the global maritime shipping industry has entered a concerning phase. New data from Vizion shows that bookings for shipments to the U.S. have sharply declined following the implementation of new tariffs by the American government.
This sudden drop occurred just one week after the tariffs were imposed and reflects how businesses are reacting to deep policy uncertainty. High-traffic routes such as Shanghai to Los Angeles—which typically take 20–30 days—and routes through the Panama Canal to New York—which add another 15 days—have seen notable declines in bookings. This downturn is occurring precisely when summer orders should be peaking.
The data clearly indicates that the anticipated decline in U.S. port volumes will materialize soon and with greater intensity in May. The plunge in bookings is sounding alarms not just for importers and retailers but also for the broader logistics industry, ports, and even Asian manufacturers, potentially leading to a slowdown in all these sectors.
In parallel, Deutsche Bank’s latest report sharply downgraded the U.S. economic growth forecast for 2025 while raising inflation projections, signaling a shift in the bank’s analysis toward a stagflation scenario.
According to the report, U.S. GDP is expected to grow by only 0.9% on a quarterly basis in 2025—markedly lower than earlier estimates. Key factors behind this revision include trade tariffs, policy uncertainty, and tighter financial conditions. The new wave of tariffs, particularly those targeting Chinese imports, has been cited as a major driver of renewed inflationary pressures.
On the monetary front, Deutsche Bank warned that the abrupt economic policies of the U.S. administration have created unprecedented instability in the global financial system—an impact that will likely persist even if some tariffs are temporarily rolled back. The report also raised concerns about the future of the U.S. dollar as the world’s reserve currency and suggested that the country’s ability to finance its growing fiscal deficits could be seriously undermined.
High Risk, High Reward: Shorting ATH in a Bullish Copper Market.Copper just broke above its all-time high, triggering my short entry at 5.3010. While the macro trend is undeniably bullish, past price action has shown that each major high was followed by aggressive selloffs. This might not be the case this time – but that’s exactly why we have a stop-loss in place.
This is a tactical counter-trade: not about fighting the trend but playing a potential rejection from a psychological and technical key zone. Let’s see if history rhymes or the red metal keeps melting resistance!
Technicals:
• Daily timeframe breakout above ATH triggered the short at 5.3010.
• Strong vertical rally into major supply – parabolic move often cools down.
• Previous ATH levels have consistently attracted heavy selling.
• If price invalidates with a continuation above 5.61, the setup is out.
• Volatility around this zone is expected – precision and SL management are key.
Fundamentals:
1. Trump’s Proposed Copper Tariffs:
• Tariffs of up to 25% could disrupt global trade flow and introduce price instability.
• Market already priced in a bullish narrative, so any delay or uncertainty could spark a correction.
2. Panama’s Cobre Mine Shutdown:
• The mine accounts for 1% of global supply, and uncertainty around reopening may already be priced in.
• The government is holding off public visits, which adds operational risk but no clear bullish resolution yet.
3. China Smelter Closures:
• While bullish in nature, these are known factors – any shift or reversal from China could cool the demand-side speculation.
4. Overbought Sentiment:
• Prices surged rapidly, creating a gap between LME and NY copper prices, reaching record spreads.
• Speculative exhaustion could trigger a short-term pullback or deeper correction.
Risk-Managed Play. Let’s see if this time is different – or just the same old Copper story in a new macro wrapper.
Note: Please remember to adjust this trade idea according to your individual trading conditions, including position size, broker-specific price variations, and any relevant external factors. Every trader’s situation is unique, so it’s crucial to tailor your approach to your own risk tolerance and market environment.

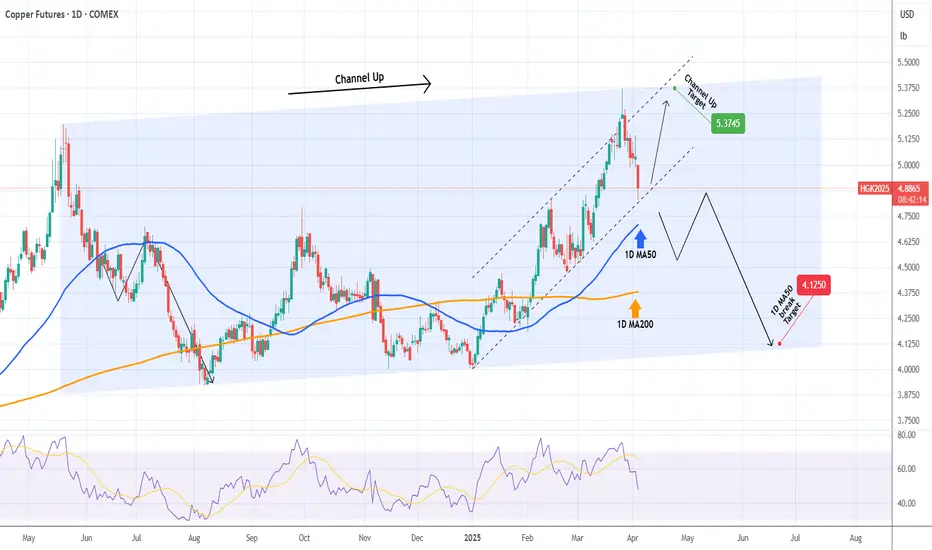
COPPER The 1D MA50 is the key.Last time we looked at Copper (HG1!) was on January 24 (see chart below) giving a buy signal that easily hit our 4.6550 Target:
This time the market is in front of a critical moment. The 2025 pattern has been a Channel Up, which last Wednesday reached the top (Higher Highs trend-line) of the 1-year Channel Up. As long as the 2025 pattern holds, the recent pull-back is a buy opportunity targeting 5.3745.
If the 1D MA50 (blue trend-line) breaks however, we expect a quick dive, rebound re-test and rejection, similar to July 05 2024. In that case, we will target the bottom of the 1-year Channel Up at 4.150.
-------------------------------------------------------------------------------
** Please LIKE 👍, FOLLOW ✅, SHARE 🙌 and COMMENT ✍ if you enjoy this idea! Also share your ideas and charts in the comments section below! This is best way to keep it relevant, support us, keep the content here free and allow the idea to reach as many people as possible. **
-------------------------------------------------------------------------------
💸💸💸💸💸💸
👇 👇 👇 👇 👇 👇
I Cracked The Bearish Code on Copper Using COTCopper is setup for sells based on fundamental underlying conditions.
We also see confirmations from accumulation measurements, seasonals & cycle analysis.

Copper's Grip: Stronger Than Oil's?Is the U.S. economy poised for a red metal revolution? The escalating demand for copper, fueled by the global transition to clean energy, the proliferation of electric vehicles, and the modernization of critical infrastructure, suggests a shifting economic landscape where copper's significance may soon eclipse oil. This vital metal, essential for everything from renewable power systems to advanced electronics, is becoming increasingly central to U.S. economic prosperity. Its unique properties and expanding applications in high-growth sectors position it as a linchpin for future development, potentially rendering it more crucial than traditional energy sources in the years to come. This sentiment is echoed by recent market activity, with copper prices hitting a new record high, reaching $5.3740 per lb. on the COMEX. This surge has widened the price gap between New York and London to approximately $1,700 a tonne, signaling strong U.S. demand.
However, this burgeoning importance faces a looming threat: the potential imposition of U.S. tariffs on copper imports. Framed under the guise of national security concerns, these tariffs could trigger significant economic repercussions. By increasing the cost of imported copper, a vital component for numerous domestic industries, tariffs risk inflating production costs, raising consumer prices, and straining international trade relationships. The anticipation of these tariffs has already caused market volatility, with major traders at a Financial Times commodities summit in Switzerland predicting copper could reach $12,000 a tonne this year. Kostas Bintas from Mercuria noted the current "tightness" in the copper market due to substantial imports heading to the U.S. in anticipation of tariffs, which some analysts expect sooner than previously anticipated.
Ultimately, the future trajectory of the U.S. economy will be heavily influenced by the availability and affordability of copper. Current market trends reveal surging prices driven by robust global demand and constrained supply, a situation that could be further exacerbated by trade barriers. Traders are also anticipating increased industrial demand as major economies like the U.S. and EU upgrade their electricity grids, further supporting the bullish outlook. Aline Carnizelo of Frontier Commodities is among the experts forecasting a $12,000 price target. However, Graeme Train from Trafigura cautioned that the global economy remains "a little fragile," highlighting potential risks to sustained high demand. As the world continues its march towards electrification and technological advancement, copper's role will only intensify. Whether the U.S. navigates this new era with policies that ensure a smooth and cost-effective supply of this essential metal or whether protectionist measures inadvertently hinder progress remains a critical question for the nation's economic future.

Copper Bounce? $HG1! at Key Demand Zone!Back at a strong demand level on COMEX:HG1! (Copper futures). The key invalidation is a 4-hour close below 3.92, so I'll be watching closely to manually close.
I'm looking for a potential bounce from here, and if the weekly candle closes bullish, I may consider this a reversal setup. The confluence between the weekly support and the current demand zone gives me confidence to take the trade.
If the move fails, my next level to watch is 3.7 for another potential entry.
Let’s see if COMEX:HG1! behaves this time.

XCU/USD "The Copper" Metals Market Heist Plan🌟Hi! Hola! Ola! Bonjour! Hallo! Marhaba!🌟
Dear Money Makers & Robbers, 🤑 💰💸✈️
Based on 🔥Thief Trading style technical and fundamental analysis🔥, here is our master plan to heist the XCU/USD "The Copper" Metals market. Please adhere to the strategy I've outlined in the chart, which emphasizes long entry. Our aim is the high-risk Red Zone. Risky level, overbought market, consolidation, trend reversal, trap at the level where traders and bearish robbers are stronger. 🏆💸Book Profits Be wealthy and safe trade.💪🏆🎉
Entry 📈 : "The vault is wide open! Swipe the Bullish loot at any price - the heist is on!
however I advise to Place buy limit orders within a 15 or 30 minute timeframe most recent or swing, low or high level. I Highly recommended you to put alert in your chart.
Stop Loss 🛑:
Thief SL placed at the recent / nearest low level Using the 4H timeframe (9500) swing trade basis.
SL is based on your risk of the trade, lot size and how many multiple orders you have to take.
Target 🎯: 10050 (or) Escape Before the Target
🧲Scalpers, take note 👀 : only scalp on the Long side. If you have a lot of money, you can go straight away; if not, you can join swing traders and carry out the robbery plan. Use trailing SL to safeguard your money 💰.
📰🗞️Read the Fundamental, Macro Economics, COT Report, Seasonal Factors, Intermarket Analysis, Sentimental Outlook:
XCU/USD "The Copper" Metals Market is currently experiencing a bullish trend,., driven by several key factors.
⭐Fundamental Analysis⭐
Overview: Fundamental analysis of XCU/USD involves evaluating the intrinsic value of copper based on economic, industrial, and external influences. At $9.70/lb, copper is at an unusually high level, suggesting strong demand, supply constraints, or external pressures.
Economic Growth: Copper is a key industrial metal tied to global GDP growth, particularly in manufacturing, construction, and electrification (e.g., EVs, renewable energy). A price of $9.70 could reflect robust economic expansion, especially in emerging markets like China and India.
Inflation and Currency: High inflation in 2025 could weaken the USD, pushing commodity prices like copper higher. Alternatively, a strong USD might temper this rise unless offset by other factors.
Industrial Demand: Increased demand from green energy (e.g., solar, wind, EVs) and infrastructure projects could justify this price.
Supply Constraints: Disruptions in major copper-producing countries (e.g., Chile, Peru) or reduced mining output could tighten supply, driving prices up.
⭐Macroeconomic Factors⭐
Interest Rates: If the Federal Reserve maintains high rates in 2025 to combat lingering inflation, this could strengthen the USD, typically pressuring commodity prices downward. However, at $9.70, demand might outweigh this effect.
Global Growth: Strong GDP growth in China (a top copper consumer) or a global infrastructure boom (e.g., post-2024 recovery) could support high prices. Conversely, a recession would cap upside potential.
Inflation: Persistent inflation in 2025 could make copper a hedge, boosting prices. A cooling inflation trend might signal a peak.
USD Strength: A weaker USD (e.g., due to Fed rate cuts) would naturally lift XCU/USD, while a stronger USD could challenge the $9.70 level unless supply/demand dynamics dominate.
⭐Geopolitical Factors⭐
Trade Policies: Escalating U.S.-China tensions or tariffs in 2025 could disrupt copper flows, raising prices if China stockpiles or seeks alternative suppliers.
Regional Instability: Political unrest in copper-rich regions like Peru or Chile (e.g., protests, strikes) could reduce output, supporting high prices. For instance, Peru’s flat production trends (noted in prior data) might persist.
Sanctions/War: Geopolitical events, such as sanctions on Russia (a minor copper player) or conflicts affecting shipping routes (e.g., Red Sea disruptions), could increase costs and prices.
Energy Transition: Global commitments to net-zero (e.g., post-COP29 agreements) might amplify copper demand, reinforcing the $9.70 level.
⭐Supply and Demand Factors⭐
Demand: Copper’s role in electrification (EVs, grids) and construction suggests strong demand. At $9.70, industries might face cost pressures, potentially curbing consumption unless offset by growth.
Supply: Multi-month low inventories (e.g., Shanghai warehouses) and challenges in mining (e.g., declining ore grades, environmental regulations) could limit supply. A price this high implies significant tightness.
Substitution Risk: High prices might encourage substitution (e.g., aluminum in wiring), though copper’s conductivity makes this limited in key applications.
Stockpiles: LME warehouse data showing declining stocks would support $9.70; rising inventories could signal a reversal.
⭐Technical Factors⭐
Price Levels: At $9.70, XCU/USD might be testing a major resistance (e.g., a psychological $10.00 level). Historical highs (around $4.90 in 2022) suggest this is a breakout, potentially overextended.
Moving Averages: If the 50-day MA ($9.50) and 200-day MA ($9.00) are below the current price, this indicates bullish momentum. A drop below these could signal a correction.
RSI: An RSI above 70 (overbought) at $9.70 suggests a potential pullback; below 50 would indicate bearish momentum.
Support/Resistance: Support might lie at $9.00–$9.20 (former resistance turned support), with resistance at $10.00–$10.50.
⭐Sentiment Factors⭐
Market Sentiment: At $9.70, sentiment is likely bullish, driven by optimism about industrial demand and supply fears. However, over exuberance could lead to profit-taking.
X Trends: Discussions on X about unexpected commodity price spikes (akin to trending weather surprises) might reflect surprise at this level, hinting at speculative froth.
Media: Positive coverage of copper’s role in green tech could fuel bullish sentiment; negative economic outlooks might shift it bearish.
⭐Seasonal Factors⭐
Construction Cycles: Spring (March–May) typically sees higher copper demand due to construction in the Northern Hemisphere, supporting $9.70.
Chinese Demand: Post-Lunar New Year (Feb 2025) often boosts industrial activity in China, aligning with this price spike.
Historical Patterns: Copper prices can peak mid-year if supply lags seasonal demand, suggesting $9.70 might hold short-term but face pressure later.
⭐Intermarket Analysis⭐
USD Index: A declining DXY (e.g., below 100) would support higher XCU/USD; a rising DXY could cap gains.
Gold (XAU/USD): Copper often correlates with gold as an inflation hedge. If gold is also at highs (e.g., $2,900+), this reinforces bullish commodity trends.
Oil Prices: High oil prices (e.g., $90+/barrel) increase mining costs, supporting copper prices but potentially slowing industrial demand.
Equities: Strong industrial stocks (e.g., mining, EV firms) suggest copper demand; a broader market sell-off could drag prices down.
⭐Market Sentiment Analysis of All Types of Investors⭐
Retail Investors: Likely bullish at $9.70, chasing the trend via ETFs or futures, but prone to panic selling on dips.
Institutional Investors: Hedge funds and banks might be long copper, betting on supply shortages, though some could hedge if overbought signals emerge.
Industrial Users: Manufacturers (e.g., EV makers) might lock in prices via forwards, supporting the market, but high costs could prompt hedging or substitution.
Speculators: High volatility at $9.70 attracts traders; sentiment could turn bearish if momentum fades.
⭐Next Trend Move and Future Trend Prediction⭐
Short-Term: Likely a pullback to $9.20–$9.50 due to overbought conditions (RSI > 70) and profit-taking. Target: $9.30.
Medium-Term:
If supply remains tight and demand grows (e.g., China’s 5% growth goal), prices could test $10.00–$10.50. Target: $10.20.
Long-Term:
Sustained electrification trends might push prices to $11.00+, but economic slowdowns or substitution could cap at $9.00. Target: $10.50 (bullish) or $8.50 (bearish).
⭐Overall Summary Outlook⭐
Current Stance: At $9.70 on March 12, 2025, XCU/USD is in a Long/Bullish phase short-term, driven by strong demand, supply constraints, and a weaker USD. However, the extreme price suggests a Short/Bearish correction is imminent medium-term due to overbought signals and potential demand softening.
Bullish Case: Continued supply disruptions (e.g., Peru/Chile strikes), robust Chinese growth, and green tech demand could push prices toward $10.50–$11.00 long-term.
Bearish Case: Economic slowdown, USD strength, or inventory buildup could trigger a decline to $8.50–$9.00 within 6–12 months.
Recommendation: Hold long positions short-term but prepare for a correction. Watch $9.50 support and $10.00 resistance for trend confirmation.
📌Keep in mind that these factors can change rapidly, and it's essential to stay up-to-date with market developments and adjust your analysis accordingly.
⚠️Trading Alert : News Releases and Position Management 📰 🗞️ 🚫🚏
As a reminder, news releases can have a significant impact on market prices and volatility. To minimize potential losses and protect your running positions,
we recommend the following:
Avoid taking new trades during news releases
Use trailing stop-loss orders to protect your running positions and lock in profits
💖Supporting our robbery plan 💥Hit the Boost Button💥 will enable us to effortlessly make and steal money 💰💵. Boost the strength of our robbery team. Every day in this market make money with ease by using the Thief Trading Style.🏆💪🤝❤️🎉🚀
I'll see you soon with another heist plan, so stay tuned 🤑🐱👤🤗🤩

GOLD SILVER PLATINUM COPPER: Metals Are Bullish! Wait For Buys!This is a FUTURES market outlook for the Metals, for the week of March 24-28th.
In this video, we will analyze the following markets:
GC | Gold
SIL | Silver
PL | Platinum
HG | Copper
The USD continues its bearish ways this upcoming weak. It's currency counterparts will likely see some upside this week. Especially the JPY.
Patience and an ear to the news will be the best way to approach the equity markets. The same would also apply to news sensitive commodity markets like US OIL, Gold and Silver.
Enjoy!
May profits be upon you.
Leave any questions or comments in the comment section.
I appreciate any feedback from my viewers!
Like and/or subscribe if you want more accurate analysis.
Thank you so much!
Disclaimer:
I do not provide personal investment advice and I am not a qualified licensed investment advisor.
All information found here, including any ideas, opinions, views, predictions, forecasts, commentaries, suggestions, expressed or implied herein, are for informational, entertainment or educational purposes only and should not be construed as personal investment advice. While the information provided is believed to be accurate, it may include errors or inaccuracies.
I will not and cannot be held liable for any actions you take as a result of anything you read here.
Conduct your own due diligence, or consult a licensed financial advisor or broker before making any and all investment decisions. Any investments, trades, speculations, or decisions made on the basis of any information found on this channel, expressed or implied herein, are committed at your own risk, financial or otherwise.

Market Forecast UPDATES! Monday, Mar 3rdIn this video, we will update the forecasts posted last March 2nd for the following markets:
ES \ S&P 500
NQ | NASDAQ 100
YM | Dow Jones 30
GC |Gold
SiI | Silver
PL | Platinum
HG | Copper
Enjoy!
May profits be upon you.
Leave any questions or comments in the comment section.
I appreciate any feedback from my viewers!
Like and/or subscribe if you want more accurate analysis.
Thank you so much!
Disclaimer:
I do not provide personal investment advice and I am not a qualified licensed investment advisor.
All information found here, including any ideas, opinions, views, predictions, forecasts, commentaries, suggestions, expressed or implied herein, are for informational, entertainment or educational purposes only and should not be construed as personal investment advice. While the information provided is believed to be accurate, it may include errors or inaccuracies.
I will not and cannot be held liable for any actions you take as a result of anything you read here.
Conduct your own due diligence, or consult a licensed financial advisor or broker before making any and all investment decisions. Any investments, trades, speculations, or decisions made on the basis of any information found on this channel, expressed or implied herein, are committed at your own risk, financial or otherwise.

does anyone remember Dr Copper?here is my meaningful description. Dr copper is at a level, transports have rolled, and we have to wonder what banks are up to... SSS...
