Coppe (Comex) - Weekly UpdateComex Copper - Weekly
Bottom Line : Adjusted wave count: Comex Copper may complete a flat correction by rising to a new high.
Comex Copper may be rising in wave (C) of a flat correction developing as wave X (circled) of an ongoing bear market from 2011.
Hg1

Copper is ready for higher pricesCopper's been trading tightly above the 50d/200dsma and is joining the commodities boom seen in agriculture and energy
Here's a view of the weekly chart with the 50 week moving average. That tightness in price action is exactly what you want to see before a major move higher. Measured target is at least mid 5s

2/27/22 FCXFreeport-McMoRan, Inc. ( NYSE:FCX )
Sector: Non-Energy Minerals (Other Metals/Minerals)
Market Capitalization: 67.415B
Current Price: $46.34
Breakout price: $46.00 (hold above)
Buy Zone (Top/Bottom Range): $44.45-$41.10
Price Target: $45.90-$46.20 (reached), $56.00-$57.60 (2nd)
Estimated Duration to Target: 100-107d (2nd)
Contract of Interest: $FCX 6/17/22 60c
Trade price as of publish date: $1.16/contract

Copper Futures : H1 Short (Price Action : LH + LL)Copper Futures HGU2021 H1 chart shows series of LOWER HIGHS + LOWER LOWS from July 26 2021. Contrarary to fundamentals (strike in copper mine would create shortage in supply, etc) the technical analysis shows there is a room for some more down side towards 4.285. The downtrend would end if the price trades above previous HIGHER HIGH.

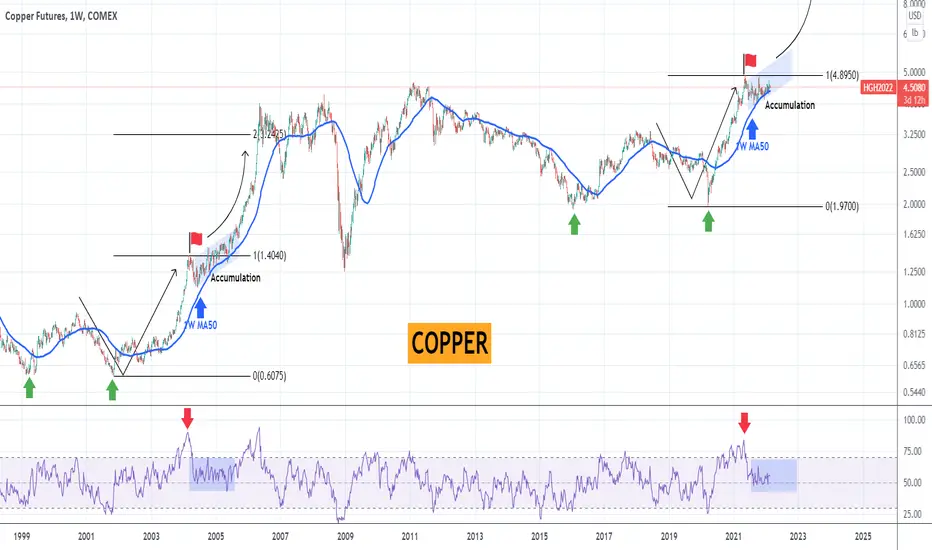
COPPER is one of the best investments on a 2 year basisInvestors looking for value long-term better have a look at Copper, which has been consolidating ever since its May 2021 All Time High (ATH). The 1W MA50 (blue trend-line) has been supporting all this time, indicating that the market has found a new long-term demand zone where buyers step in.
The last time a similar demand level on the 1W MA50 took place was half-way through Copper's historic parabolic rally of the 2000s. In particular, in February 2004, the market made a similar High (red flag), then turned sideways into a +1 year accumulation period, when again the 1W MA50 was supporting. Eventually that demand level initiated the last and more aggressive part of this rally during 2005-2006. The 1W RSI sequences between the accumulation phases of today and 2004 are also identical.
The 2006 rally peaked a little higher than the 2.0 Fibonacci extension. That should be a solid benchmark for long-term investors looking for value.
--------------------------------------------------------------------------------------------------------
** Please support this idea with your likes and comments, it is the best way to keep it relevant and support me. **
--------------------------------------------------------------------------------------------------------
Trade idea #Copper #HG1! longEntry at current level 4.56
Stop 4.30
First Target (33% of the position) 4.80

Battery Metals: Lithium and CobaltTrends to watch in 2022. Charts trending hard which is my favorite kind of chart, possibly could be good into the next few years...

Copper - a barometer for stock market performance There are more ways than you and I can think of in analysing the stock market performance. From very complex charting tools to using stars alignment, for as long as stock market exists, people are obsessed with coming with tools to predict the market.
Copper, for a long time has been touted as a good stock market barometer (if you believe in it).
Using the weekly chart, we can see that copper price has hit a resistance level , back to where it was in 2011 (11 years ago). Is it any coincidence we are seeing some correction in the stock market now ?
I leave that judgement to you !

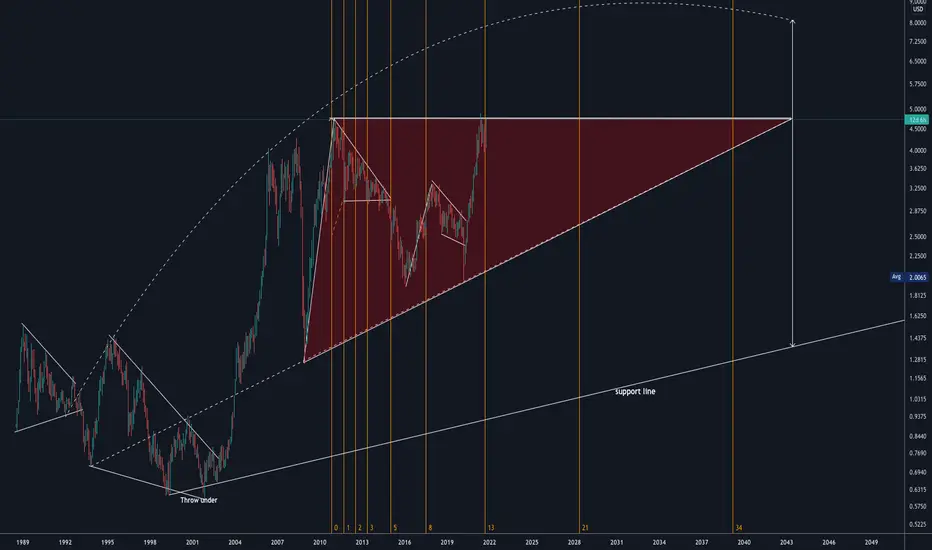
HG1! (COPPER) STILL IN A TRIANGLEHG1! (COPPER) is still making a triangle on the primary degree 4th wave. We will finish the triangle around 61.8% or 78.6% of Fibonacci. The 78.6% area is also a trend-line support zone. With the high chance, we will rebound from the trend-line area. Wave E can take further time to develop.
DISCLOSURE - Please be informed that the information I provide is not a trading recommendation or investment advice. All of my work is for educational purposes only. All labeling and wave count have been done by me manually and I will keep changing according to the LIVE MARKET PRICE ACTION. So don't bias, hope on my trade plans. Try to learn Elliott Wave or other strategies and make your own strategy. Following is not that much easy. I am not responsible for any losses if u took the trade according to my trade plans.
#HG #HG1! #COPPER


Leading Indicators Reversal in ProgressInteresting... in the last couple of weeks, as the Leading Indicators signaled a retracement, it appears that it may be time for a technical bounce...
JNK broke down as expected, and exceeded target. Last week's candle had a long tail recovery, and this current week is forming a rebound.
MACD still in bear territory.
IWM, DJT and VALUG all seemed to have retraced hard, and bounced off a support. MACD crossed and still in bear territory... may not be over. sus.
TIPS failed a support and does not seem to be recovering, not bouncing for the matter. MACD appears to be recovering though. This one is rather odd, so I would just note and leave it for now.
TLT is not bullish as one would expect it to be. In fact, it looks bearish, which is favorable (bullish) for the equity markets.
VIX failed a solid break out and looks to be finding 16 again, signalling the interim volatilty is over and more bullish markets to prevail.
/HG Copper futures are held in a tight range and appear to be recovering this week - if it can hold steady and break out. MACD is not yet bullish.
Overall, the leading indicators are signalling an interim bottom. perhaps a larger than expected rebound should follow in the coming weeks...

Hg Copper Yeah, its overbought I know but that rsi hold above 50% is a sign.
and its happened before.

Sell COPPER As a basic observation in The Monthly chart of copper Futures (HG1) . Copper reached during the last year it's highest levels since 2011 breaking its all time high . As a result of the high demand from china in 2020 and the lower production from the miners in Chile and Peru .
In the other hand the Chart has shown selling configuration .There's a high probability that the prices might visit the 4.7 level before it starts dropping down and visit some of the lowest levels passing by $3.5 - $3 as first target in the next few month and if the price breaks down this level then the target will be $2.5 , and there is a lot of fundamental reasons .
-Lately the Li Keqiang Index has dropped down as sign of china's Industrial situation . and as known the high correlation between Copper and the Li Keqiang and it lower the demand on copper in 2022 .
-Chile started rising its production rate so this will affect the supply in the market .
-The US federal Bank has been declared that they will rise The Interest rate by the end of March and it will affect all industrial and technological sectors.

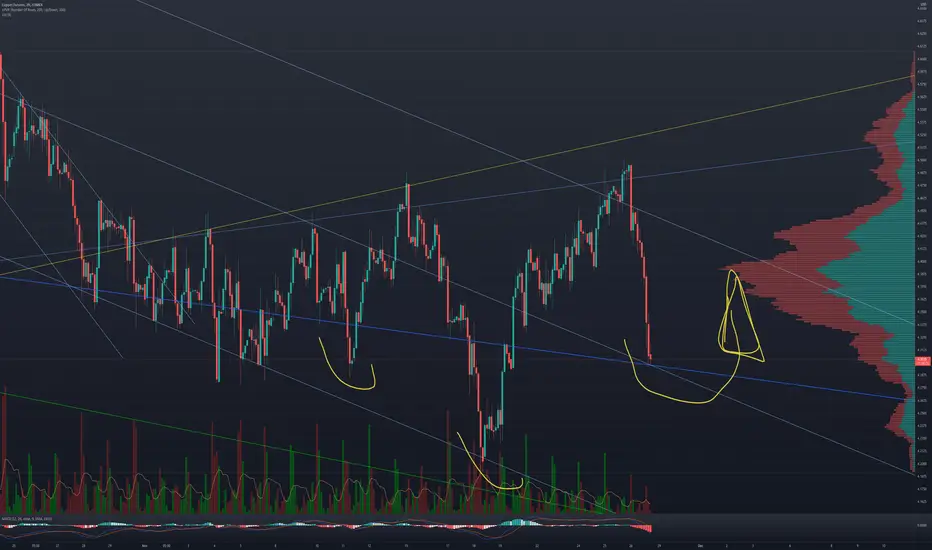
Trading In The Copper TriangleIn this update we review the recent price action in Copper and identify a high probability trading pattern to take advantage of

HG ( COPPER ) MAKING A TRIANGLEHG ( COPPER ) making a triangle on a Primary degree 4th. We are on a D wave of the triangle. Most probably we finish A wave of D wave as a preferred count (Projected by the black line) and we are coming down to making a B wave. On another side of the analysis as an alternative (projected by the red line)we are on an A wave and we are going upside a little bit and we finish the A wave then we will come for a B wave. Copper take more time to finish the triangle and after that, we can see a new high on an HG for primary degree 5th.
DISCLOSURE - Please be informed that the information I provide is not a trading recommendation or investment advice. All of my work is for educational purposes only. All labeling and wave count have been done by me manually and I will keep changing according to the LIVE MARKET PRICE ACTION. So don't bias, hope on my trade plans. Try to learn Elliott Wave or other strategies and make your own strategy. Following is not that much easy. I am not responsible for any losses if u took the trade according to my trade plans.
#HG #COPPER

HG1! - Copper and CornersSo, is this what means: A market is cornered? ;-)
OK...let's get serious...they observe us hehe...
The very old top acts as a perfect resistance.
Now, focus on the white pitchfork.
The market overshooted the U-MLH (upper line). This is a huge stretch. In fact, if the power where there, price had to go to the next extension of the Pitchfork. But so far it mised it (HAGOPIAN) and it's just dancing on the U-MLH.
What does this mean?
It means, that
a) the potential to take off is still in place
b) the market could tank very hard and reaching at least the white centerline. The extended version of a target is simply the grey centerline.
Anything else?
Jep, Santa is comming! §8-)

$copper going to absolutely fly. Massive backtestdeep ih&S was actualyl backtesting deeper shells ina. giant bullflag.
She's gong to fly.
Safest entry is here-ish ith a tight stop-leooss adn exit before the turn up high.
COPPER Buy signalPattern: Channel Up on 1D.
Signal: Buy as the price is rebounding on the Higher Lows (bottom) trend-line of the Channel Up while the MACD just formed a Bullish Cross.
Target: 4.980 (the 1.236 Fibonacci extension).
--------------------------------------------------------------------------------------------------------
** Please support this idea with your likes and comments, it is the best way to keep it relevant and support me. **
--------------------------------------------------------------------------------------------------------

2 Facets of ESG: Speculation and FundamentalsIt's informative to see the positioning of Commercials (producers and consumers in the Commitment of Traders Report) and how that relates to price action. Commercials are considered the "smart money" in the commodity markets because they supposedly are better able to judge future price direction based on supply and demand conditions "on the ground". These 2 charts show very different positioning by commercials in Copper and Crude Oil futures as price rallied during the reopening. Commercials in the Copper Futures markets increased their net short position whist in the Crude Oil markets they reduced shorts/became more net long. This potentially indicates the commercials have a more bullish view on oil than on copper based on the fundamental supply and demand conditions in the the industry.

Copper to resume trend higher? resting on 50dmaNice retest of the breakout area. Consolidating and holding above the 50dma for the 3rd successive day. RSI still strong and with the 50dma > 200dma, i expect the positive trend to continue higher shortly..

Copper could go to $8, $20 evenPushing the price up:
- High demand for EVS, renewable energy production, the Green New Deal, means copper production is below demand and expected to be in shortage for years
- Stimulus spending and inflation of industrial goods
- Producers cannot increase supply fast enough, examples: Freeport CEO "It will take 7-8 years to get new production to the market", "Oyu Tolgoi (Mongolian super mine) is set to bring a further 480,000 tonnes of copper into the market from 2028"
www.mining.com
www.proactiveinvestors.co.uk
Stopping (or slowing) the price from going up:
- Traders taking profit (short term)
- An end to all the renewable projects
- A total collapse of civilization?
This is what happened with the previous price explosion in the 2000s
As the price consolidates around ATH we might want to bet on the price going up up up in usd terms
I'd just go for the DEC 2022 contract, or a DEC 2022 call:
There is a discount on that contract too (backwardation).
At a price of $4 1 contract = $100,000. A 10% stop is a risk of $10,000.
So maybe we'll just take short term trades on the way up. Unless we all become millionaires in a few months with Cryptos?
There is an e-mini for copper but no one trades that, I don't even know if I have access to this and where/what broker? Plus I don't see DEC 22 :(
www.cmegroup.com

Copper ready to go down in 2022As we can see copper is in the oversold zone. It can be expected correction 30% or more in 2022.

HG1! 1M Comes Copper Futures test
What is HG copper?
Our Copper Futures contract (HG) offers the ability to deliver or take delivery of Grade 1 electrolytic copper cathode in a timely, transparent and efficient fashion at CME Group approved and regulated facilities located throughout the United States.