LINKBTC POSSIBLE HIDDEN BULL DIV ON MONTHLYTHis is getting confirmed tonight,
I think this is super bullish should see a pivot much higher in BTC!!!
Hidden Bullish RSI Divergence

ADA/USDT Will increase in the coming days!Hi every one
Cardano / US Dollar
As you can see, the price is inside the broadening wedge and the price can go up to point E .
The { Hidden Bullish divergence } indicates a price increase, Remember that oscillators show the future of the market.
Traders, if you liked this idea or have your opinion on it, write in the comments, We will be glad.
Things can change...
The markets are always changing and even with all these signals, the market changes tend to be strong and fast!!
Thank you for seeing idea .
Have a nice day and Good luck.

DOT 4h Hidden bullish divergenceHidden bullish divergence in the dot 4h, buy on breakout, stop loss below support.

AUD/NZD expected to IncreaseHi every one
AUSTRALIAN DOLLAR / NEW ZEALAND DOLLAR
chart is speaking it self!!
As you can see, the neckline is broken. And the price can go up to the measured movements,
and bullish Hidden divergence{+HD} indicates a price increase.
Traders, if you liked this idea or have your opinion on it, write in the comments, We will be glad.
Things can change...
The markets are always changing and even with all these signals, the market changes tend to be strong and fast!!
Thank you for seeing idea .
Have a nice day and Good luck.


BTCUSDT 1D chart Buying Opportunity1D chart Bullish flag formation
1D Hidden Bulish divergence with MACD

Bullish Scenario for Blow-off Parabolic: Three Drives to TopPrevious tops characterized by parabolic surge with extreme overbought RSI (arrows). This is the Third Drive; expect another parabolic blowout, followed by an extreme Bearish reaction. This final move will complete a Nenstar pattern and likely usher in a Bear Market for 2021.
A measured move from 3230 -> 3630 of 400 pips, extended to upper TL formed by previous tops, yields price 4K.
This move could occur rapidly, over 7-10 trading sessions in December, as we saw in the two prior moves, look when RSI moved from high to extreme overbought, takes about a week.
NB: Time from 30 June ending ABC correction to next top: 64 days; from 30 October projects rally ending ~> 3 Jan
This is a rosy scenario priced for perfection. Printing free money will be the catalyst. Failure in Congress will result in rollover.
I do not advise going long here; risk is extreme! Rather, this idea suggests when shorts might come into play.
Shorting this trend is also extremely risky. Calling tops is worse than fishing for bottoms IMO!
ANYTHING can happen now; trade safe FGS!!!
As always, this is not advice, just another crackpot idea. Trade at your own risk; GLTA!

Weekly Hidden Bullish Divergence at a 78.6 Retrace.Last week we closed bullishly after bouncing off the 200 week SMA and staying above the 786 retrace, we are showing Hidden Bullish Divergence I think this looks to have potential to be a Bullish Gartley i will put my stop somewhere below the 200 week SMA and as for profit taking targets we're going all the way!

PLTR- More than just data analytics companyPLTR's narrative and story align well with the overarching theme and development of big data, AI, deep analytics and cybersecurity.
Yes, it is a story-driven stock and it is clearly overvalued. However, I'm betting on its long-term potential and am willing to take a risk by market buy 1/2 of the positional size and put in the rest on the retracement as I think the short-term bottom is already in.
Stop loss placed below $20
DYOR. Not the investment advice.

$RYCEY Beginning of an uptrend$Rycey higher highs on the daily. Mac D crossing. Volume increasing. RSI trending up. So many bullish signs for a break out

Weekly Hidden Bullish Divergence Breakout. 62% pump possible.Ebay is looking like it wants to begin a new wave of upside with it's measured move taking us to the 2.618 Fib extension..

$aapl - descending broadening wedgecan go either way, but seeing hidden bullish divergence... so the higher high trend may continue.
bullish on a break past the dotted purple trend line, bearish with a rejection of the dotted purple trend line & break below dashed orange line

Vet/usd bullish continuation patternQuick vet update: it looks to have formed a hidden bullish divergence on the four hour meaning continuation likely. I still like my .022 target for now. Good luck y’all!

CEMI Potential Bullish set upCemi looks like is about to complete a Bullish Bat Pattern. I also noticed declining volume on the correction (bullish) and Hidden Bullish div on the MACD histogram.


#BTCUSDT - Bitcoin - Hidden Divergence 1H - Go up to 24500$#BTCUSDT - Bitcoin - Hidden Divergence 1H
- If back test successful , then bitcoin will go up to 24500$. Please make a entry Long at back test and stop loss 1%.

XRP Triangle likely to create Rising Channel or Rising WedgeGreetings! First things first a reminder on how chart formations nest, or develop over time and second will be a divergence primer. Lots of people have seen the symmetrical triangle developing on XRPUSD, which is great. The next step is to figure out what will form when the pattern breaks either to the upside or downside. This post is my upside senariocast, which is what I will be looking for at key moments. Final reminder: Triangles are the easiest formations to recognize but the worst to trade by themselves. They are prone to be inconsistent and underperform so they are best when paired with other structures, structures that are largely lacking right now.
Price Action Senarios
Performs the hight of the triangle taking us to the top of the channel. A strong move that will make a lot of people happy.
Based on above: We form a rising wedge
Doubletop and Drop (lol) which would most likely happen on a weak move up with the top occurring at the channel midline. I find this the least likely scenario at this point.
Goes impulsively out of the triangle and right out the channel and continues a flagpole run. Not very helpful because their is not much of a flagpole.
Bounces between the channel baseline and midline for an extended period of time, frustrating people looking for a massive pamp but reassuring those hoping to accumulate and expecting an even bigger move.
Primer on Divergences
Normal Divergence (Trend Reversal)
Bearish: Higher highs on price action but lower highs on the indicator
Bullish: Lower lows on price action but higher lows on the indicator
Hidden (Trend Continuation)
Bearish: Lower high on the price action and higher highs on the indicator
Bullish: Higher low on the price action and a lower low on the indicator
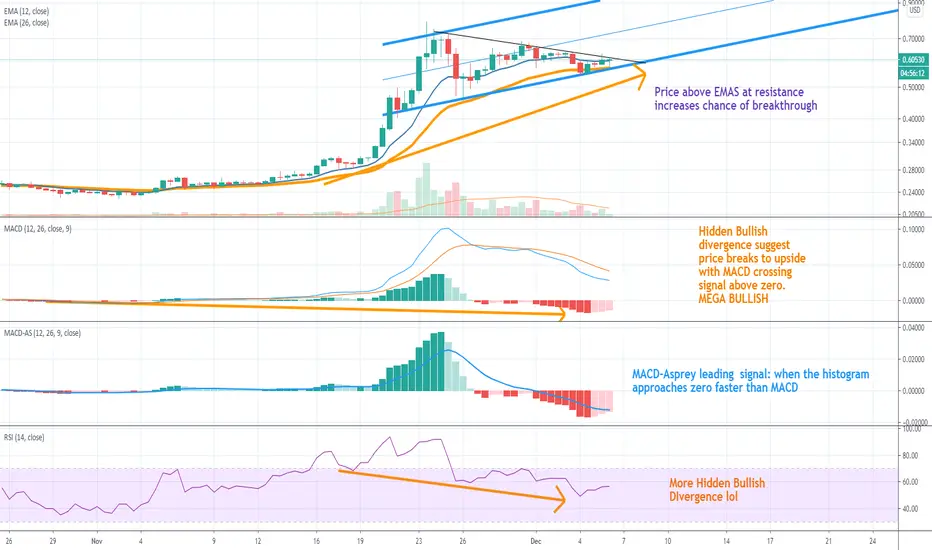
The arrows show all kindz of bullish divergence which suggest this triangle with break up with continuation. Something that confirms this bias is the fact that the price action is above both the 12 and 26 EMA (the MACD EMAs) as it hits resistance. If the price action had the EMAS as resistance at the trendline resistance this would be very bearish. But since we don't, it is bullish as the price can ride the EMAS out of the triangle.
The MACD-Asprey version is one of the earlier forms of the MACD and it can give you earlier entries. The MACD centers more around zero so it can be evaluated compared to its histogram. In this scenario, with bullish divergence, the histogram is leading the charge to the zero level. When you start to see blank space between the histogram and MACD you have an early entry. The chart below shows the white space and how you can use hidden bullish divergence. This time it is paired up with the bollinger band and buying these can be a bit high risk for leverage traders if you in with a bad system or a great system with poor discipline. If you don't like scalping or short swing trades that wouldn't be a timeframe setup you would use. The bollinger bands stop you from getting to high on hopium and show you where you can take some profit. They are great entries for investors looking to get great prices on a project they believe in the long run. Another word for leverage traders.... I expect a grind against the bollinger band in our current instance and people should not be surprised by quick retests of the baseline or lower edge.
The normie MACD has the same histogram as the Aspray version so you see the extract same divergence. What is important about the normal MACD is that it doesn't center around zero as much, so when you see the MACD crossing up bullishly across the signal line (which is still pending) you get an extraordinarily strong move for that timeframe.
And finally, almost as an afterthought: the RSI also has the same hidden bullish divergence.
Final Thoughts
My recent and linked post on XRP show a pair of quick trades I have put on using a lot of stuff I have covered in this post. Should this chart formation break to the upside I hope to hold this trade closer to two or three weeks, not two or three days or even 12 hours. With enough confirmation I will be adding to my position when I see pullbacks and consolidations. And as I said, that is the hope, not a 100% commitment. There is also my long term post using fibchannels. I will definitely look for retracements and consolidation at these fib levels like the chart below forecasts (hopefully accurately).
Hidden Divergence in GoldGold is making higher highs and higher lows, while the RSI and MACD oscillators/histograms show lower lows and lower highs. This is a case of hidden divergence which is an indication of the trend continuing. People who are looking to short should consider this. I recommend traders to avoid shorting for now. For people who are longing, it should be good news. Expect Gold to reach 1862.
Please give a thumbs up if you agree with the idea and if there are any questions, feel free to comment down below.

Upward Trend ContinuesRSI Hidden Bullish divergence formed. Let's join in on the upward trend. The correction is done. Buy on every dip in price.

as bullish as it gets**assuming the market is still strong
✓ cup and handle
✓ macd buy signal
✓ hidden bullish divergence
sitting at resistance

DMMX - hidden bullish divergence - start to uptrend
DMMX has hidden bullish divergence
support 175-176
TP1 : 208-210
TP2 : 240-250

Bitcoin's brrr runGood morning Traders
On account of brrr machines sustaining market liquidity, here's a macro bullish count. Bitcoin does seem corrective on this rise but could be completing a larger wave 2 before the real fun begins. For now we have a 3-day MA50/100 cross followed by a bullish retest and confluent with hidden bullish divergence on RSI.
Dollar index also not looking too healthy on the HTF. You know what that means for crypto and stonks!

Hidden Bullish Divergence on 15-minute LENDBTCAave got nice room to grow here, with a bullish divergence pattern on RSI and Price action.
0.236 fib level could act as resistance (or 50 level on RSI), but if broken 0.00006765 would be the next target. That is where I am looking for.
Daily RSI look good aswell, where the RSI has to found support above the 50-line to continue the uptrend.
